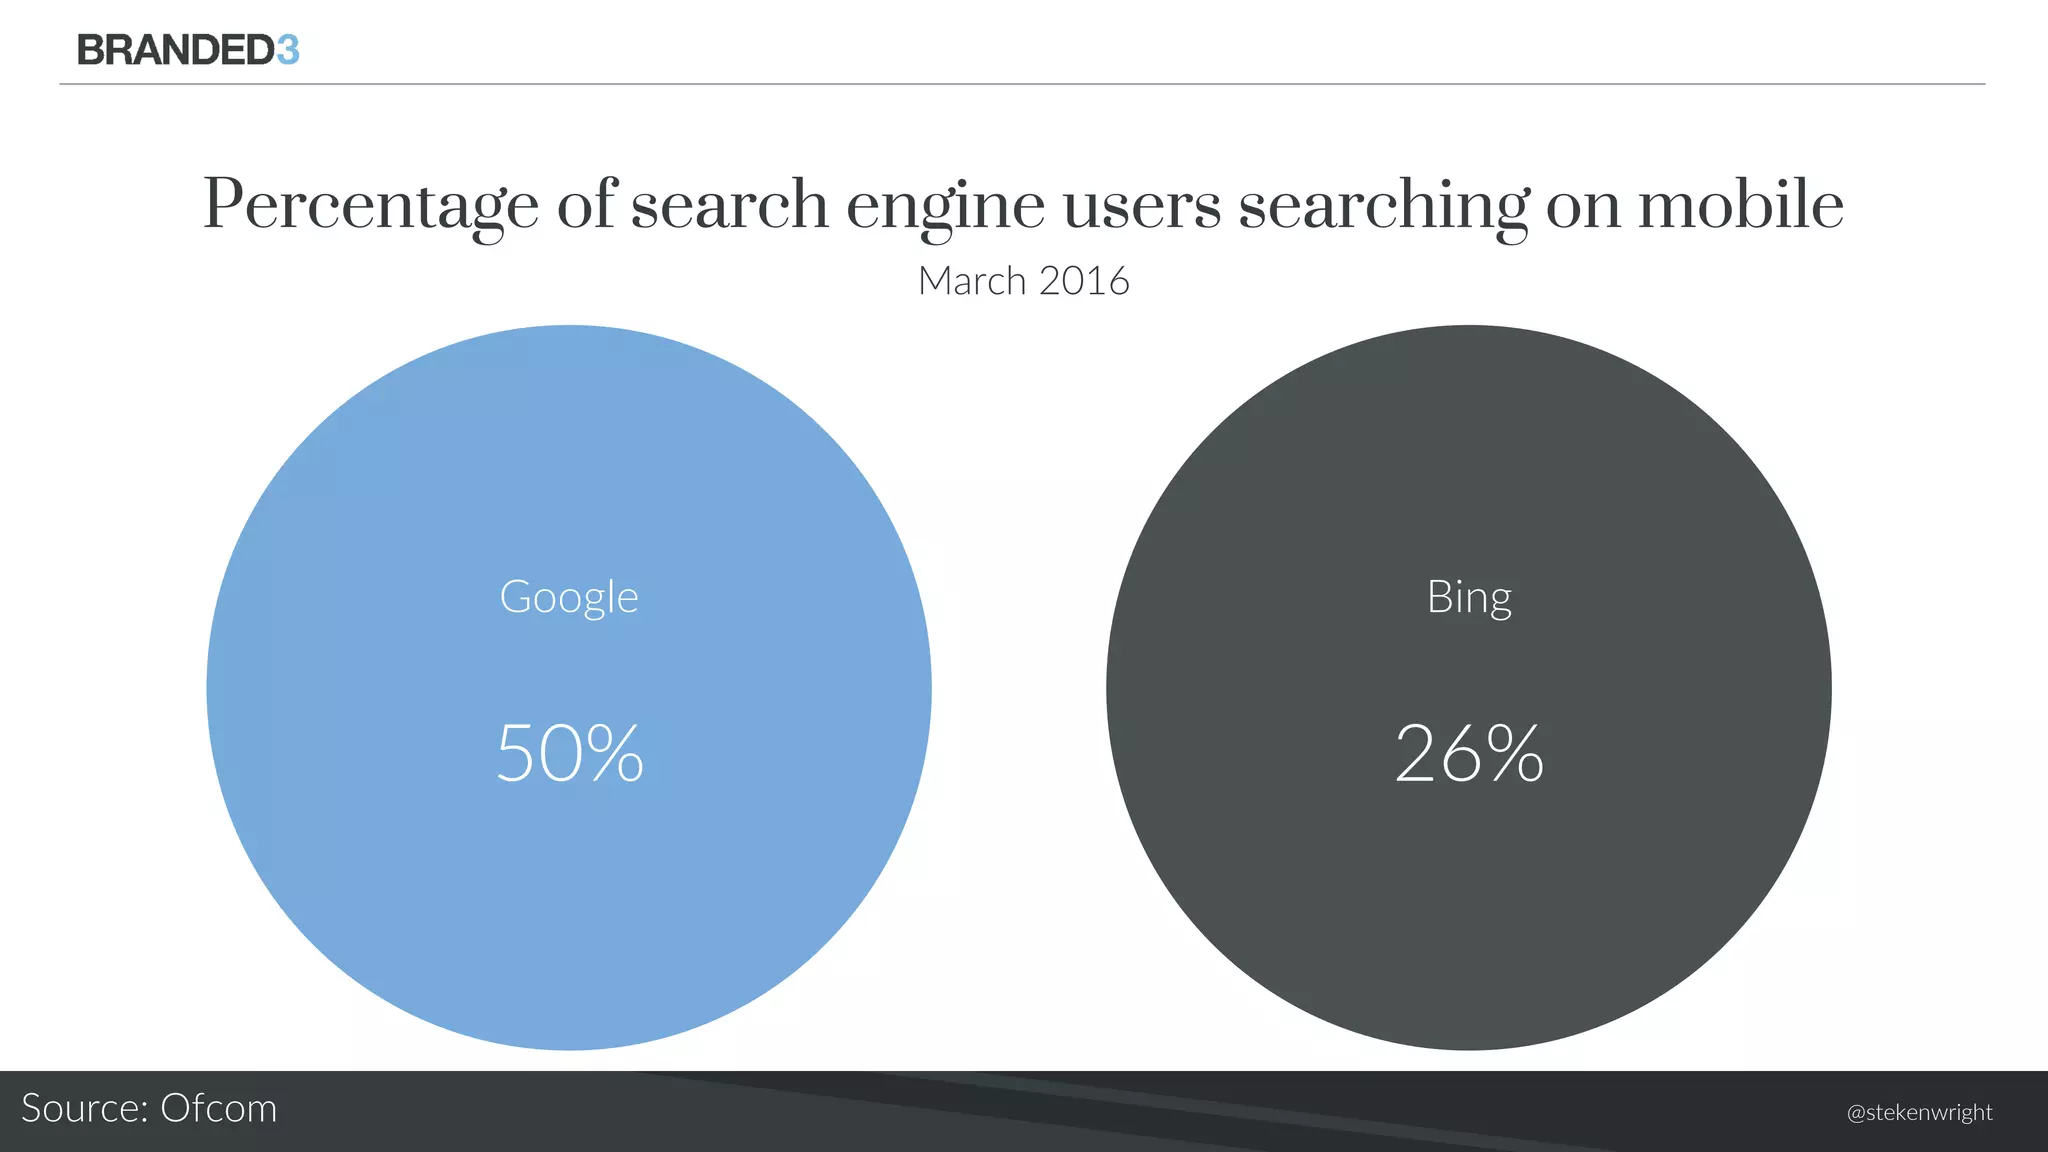
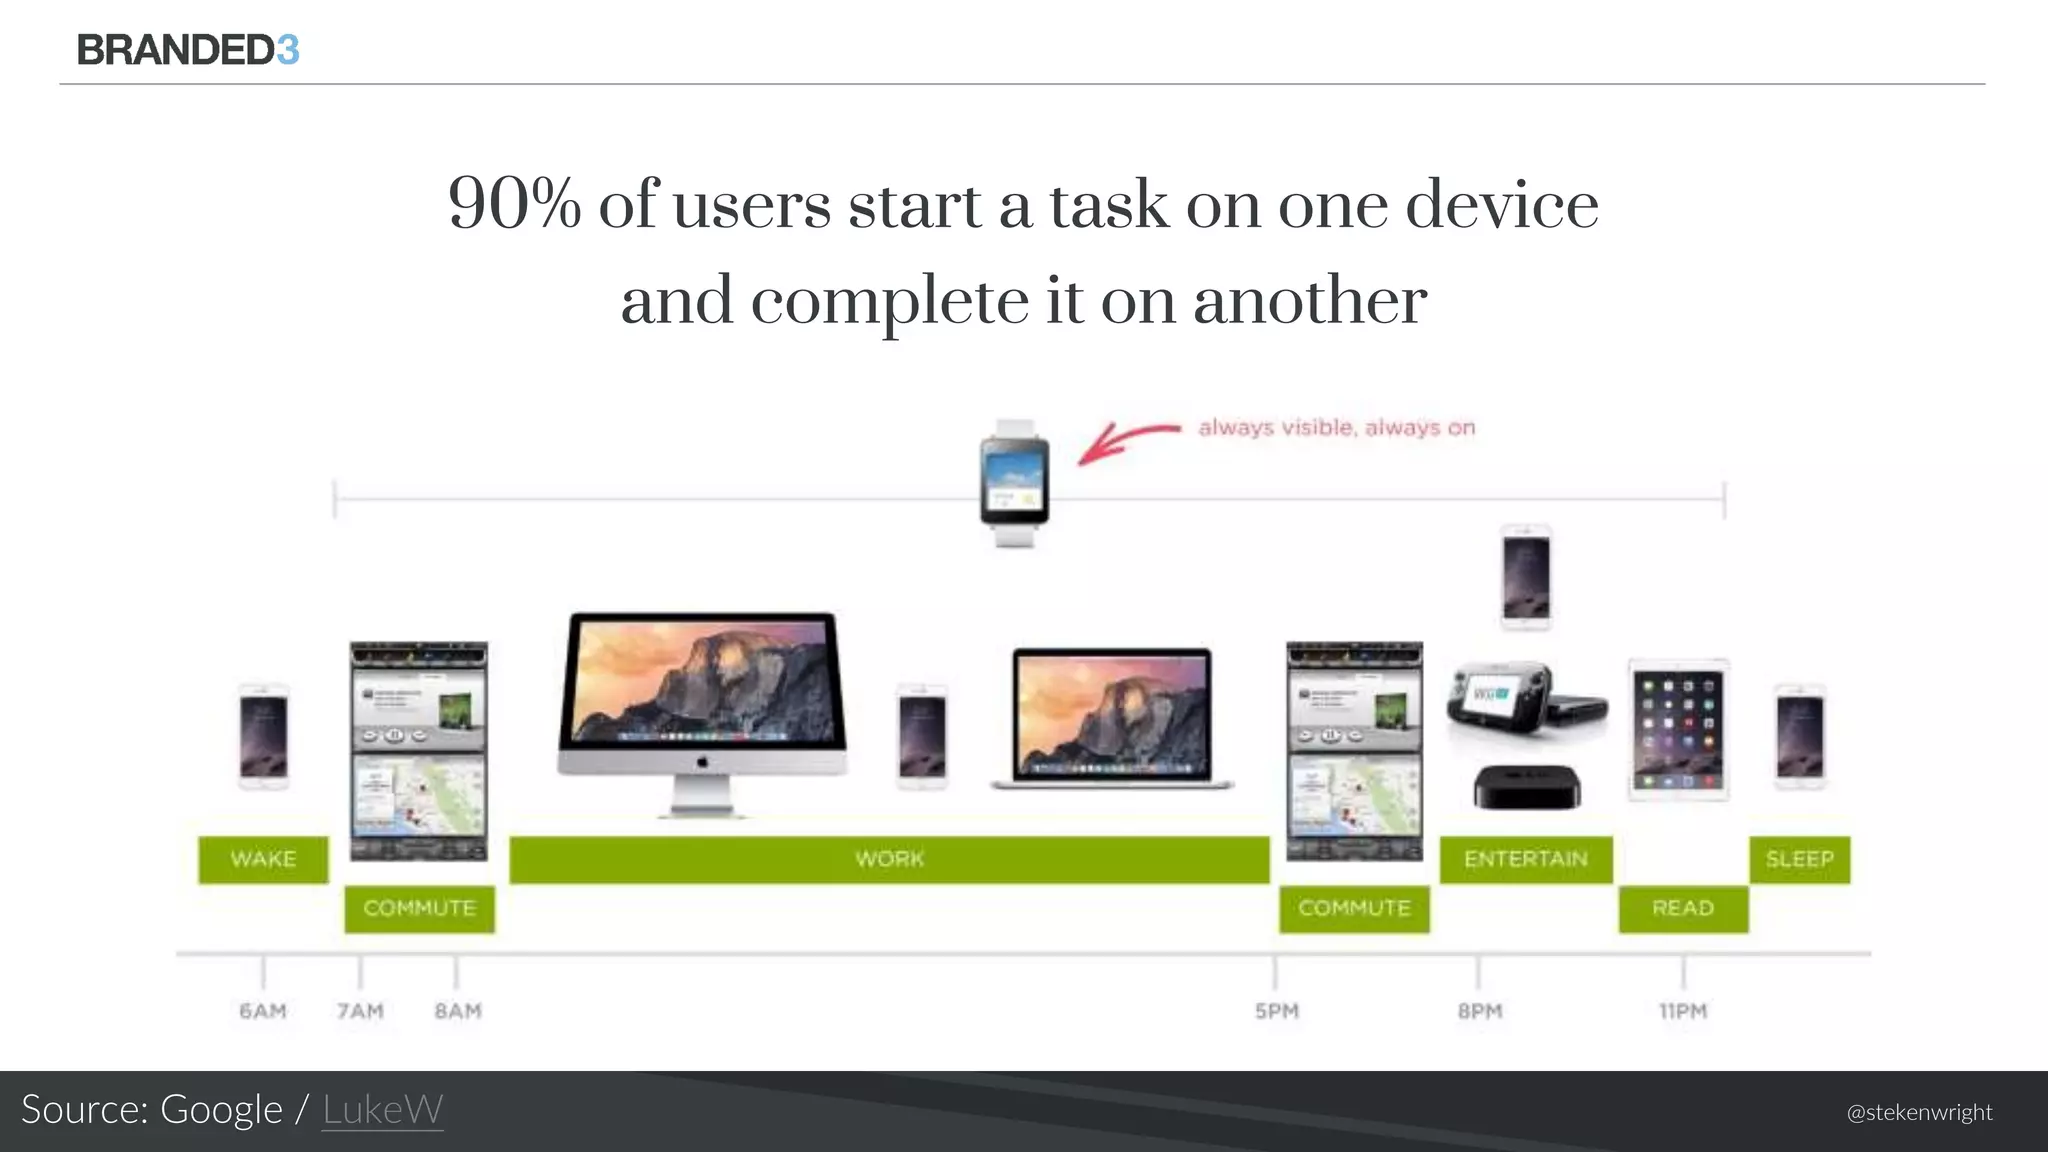
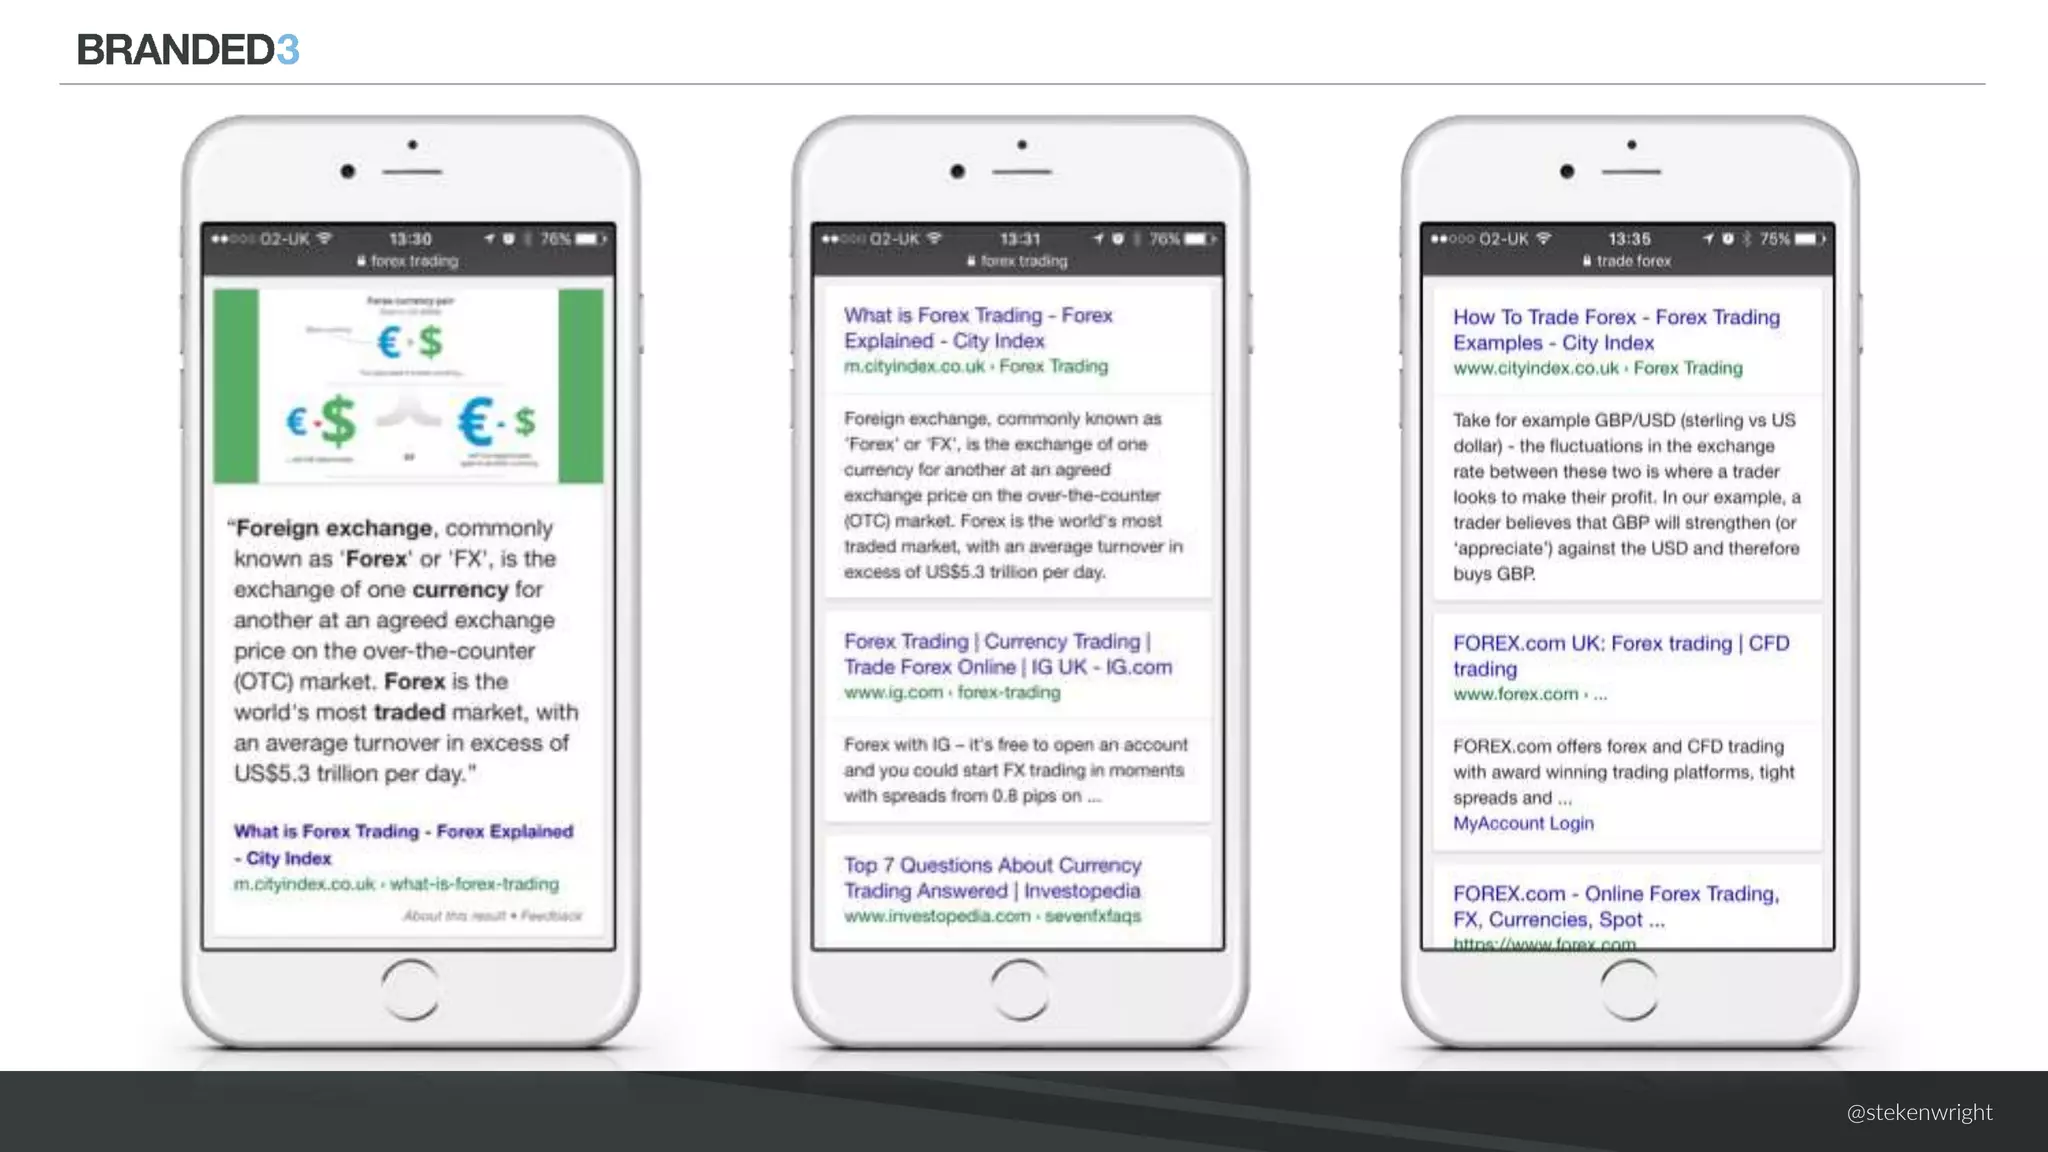
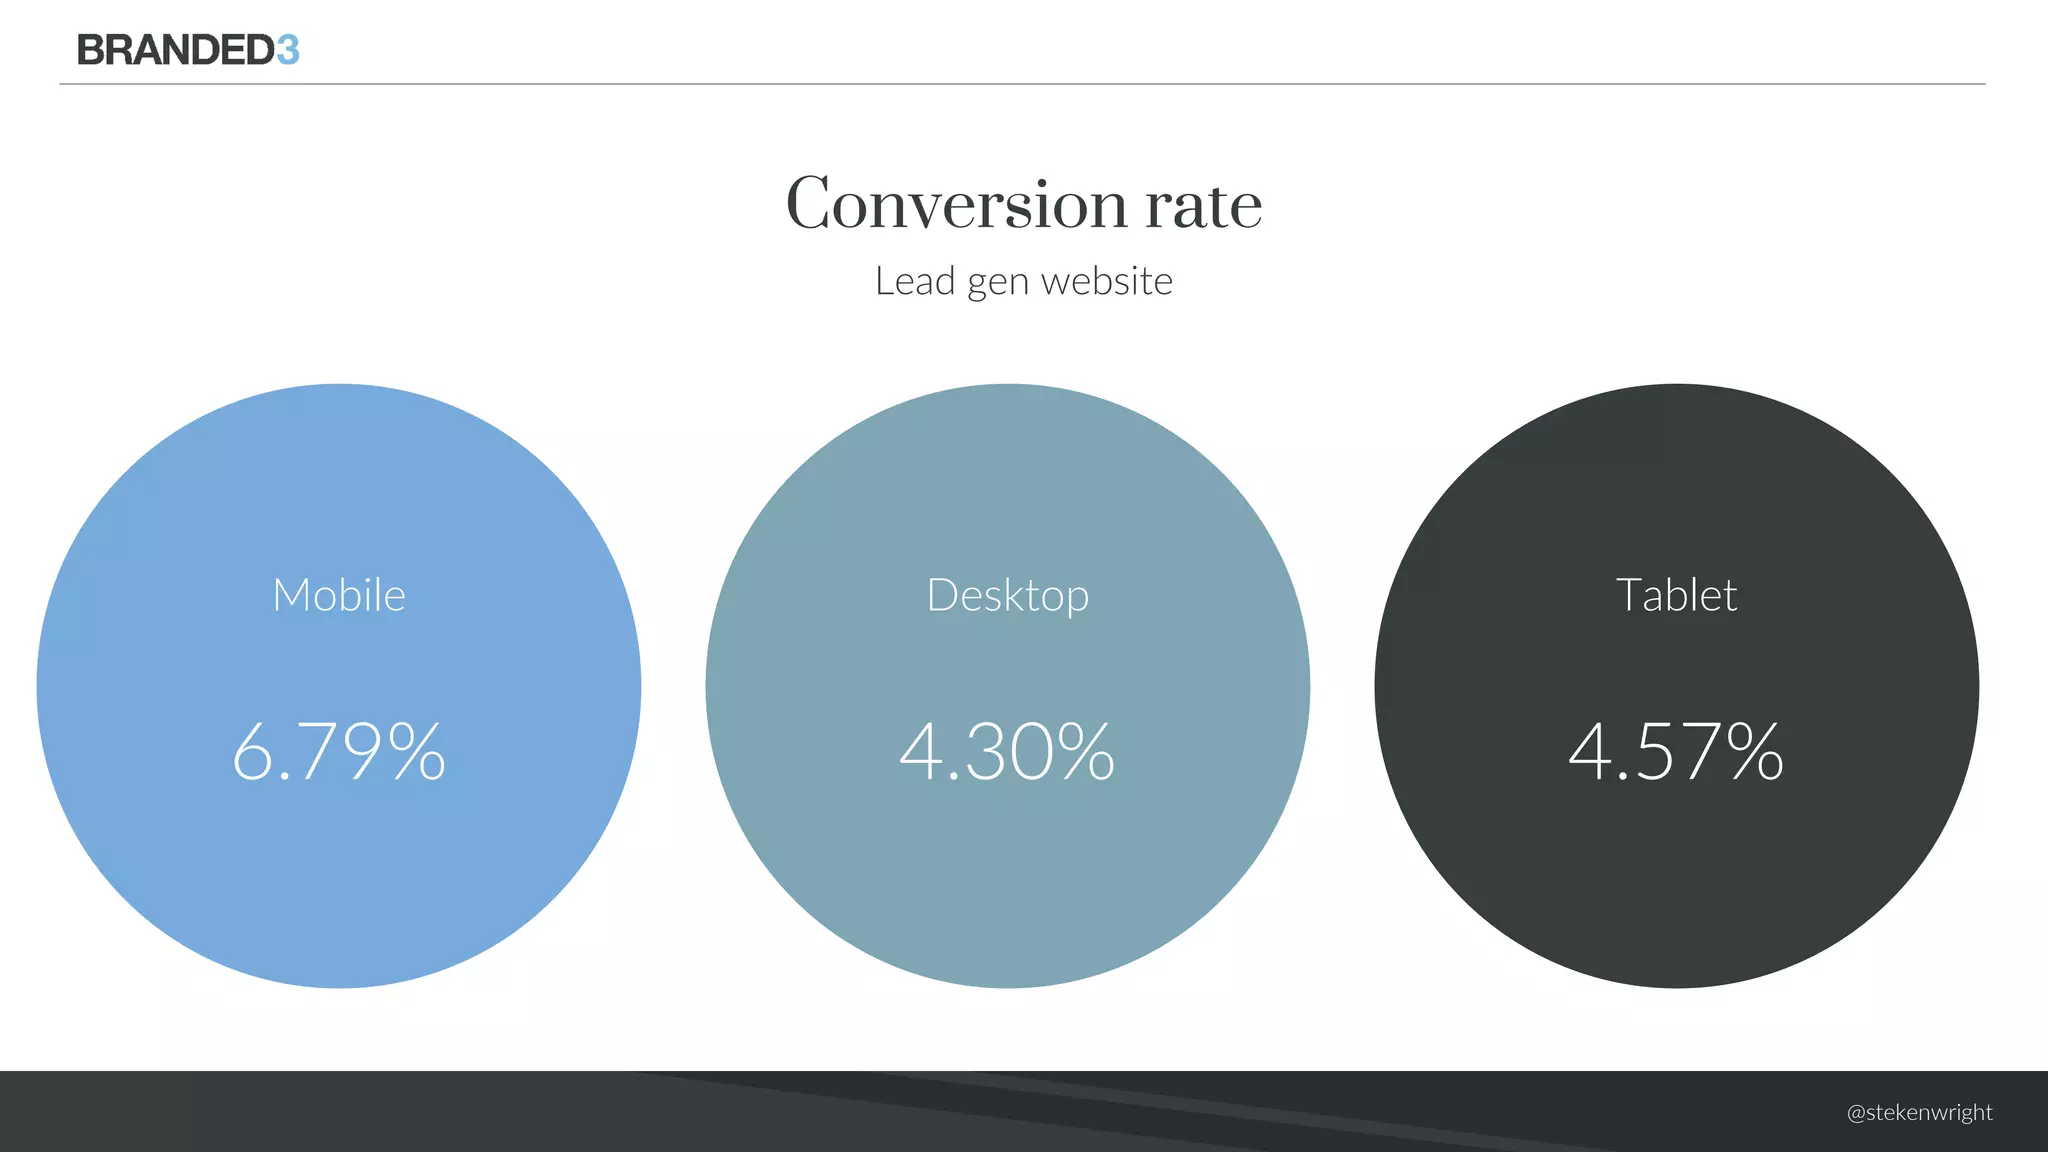
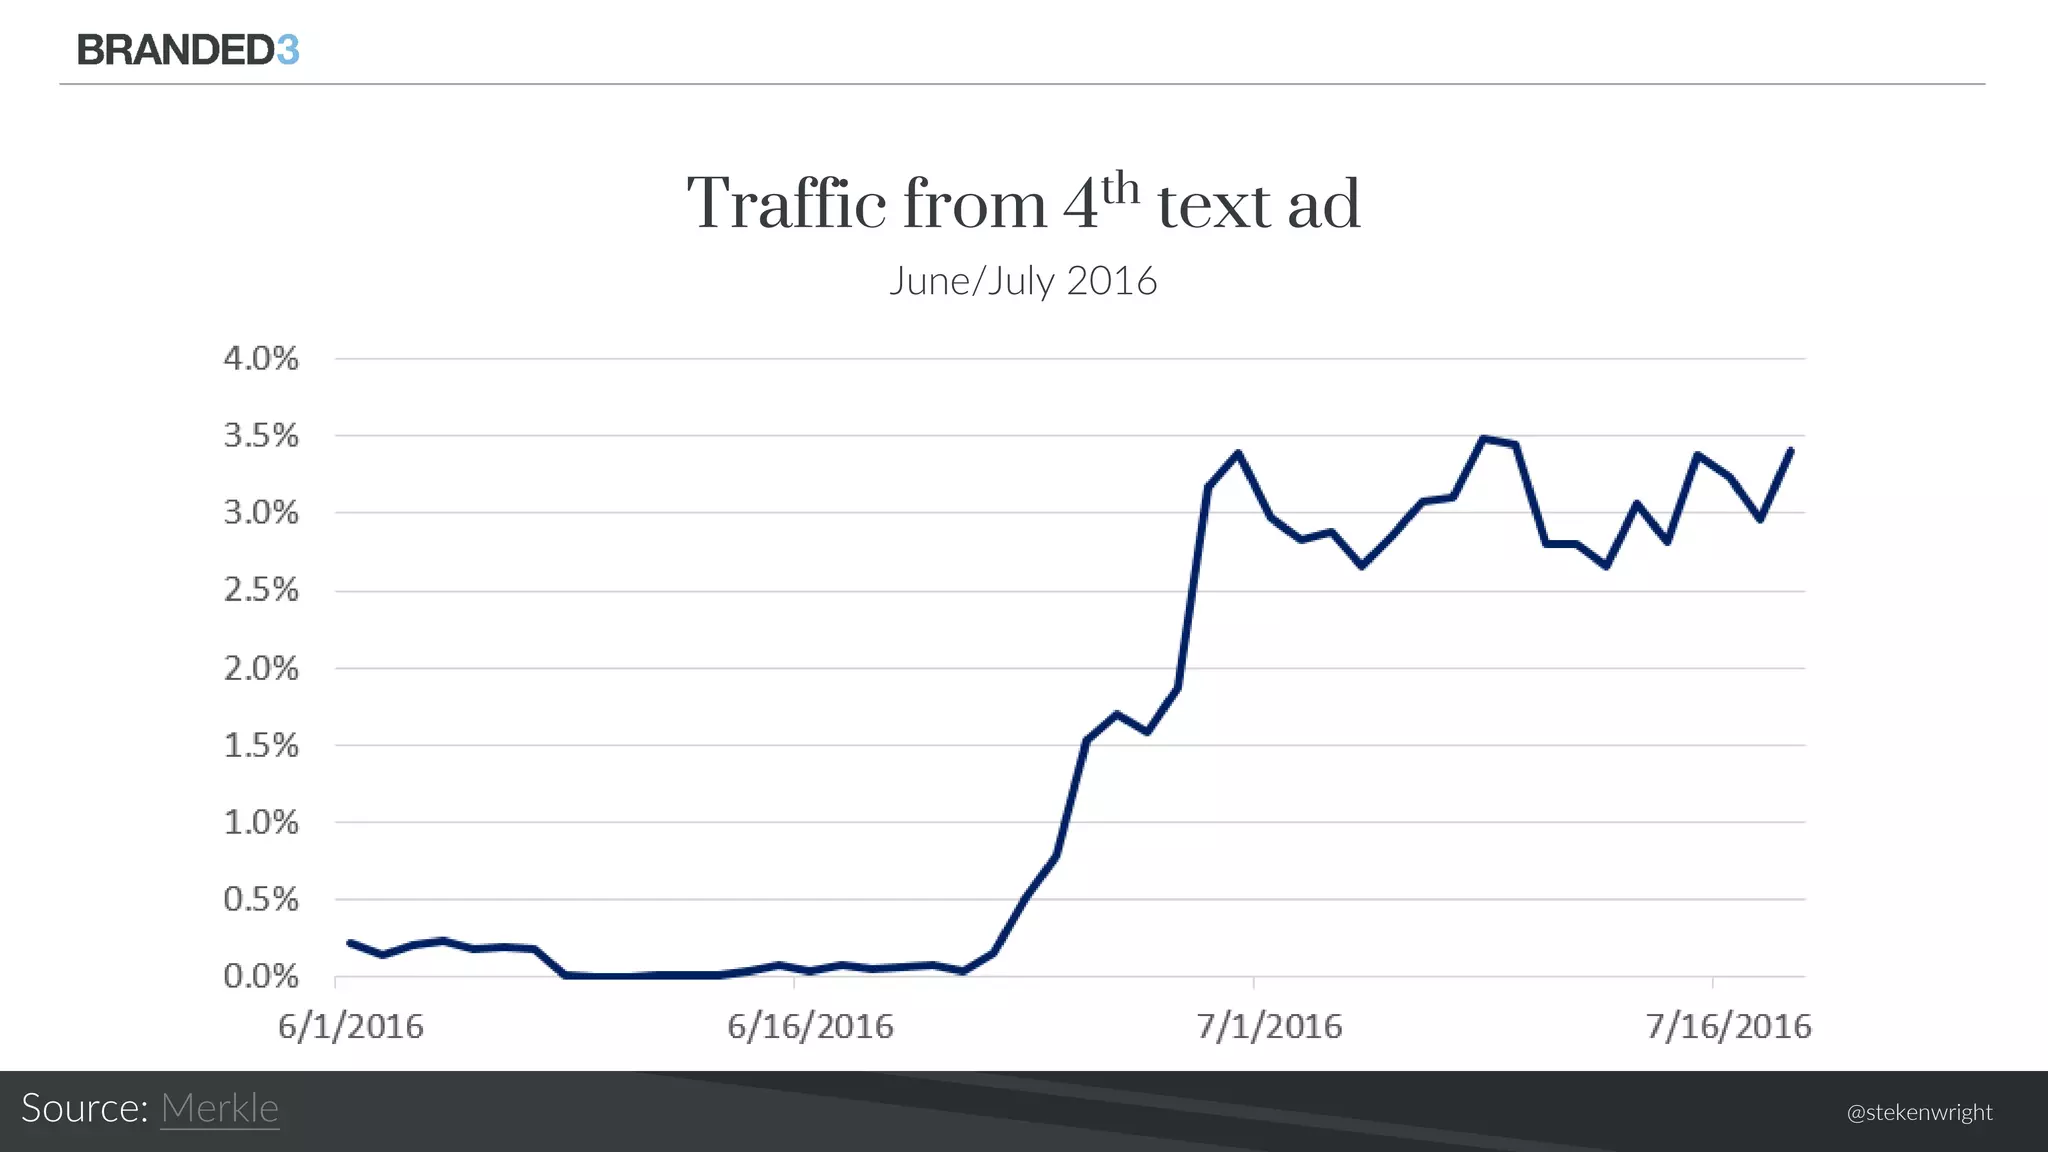
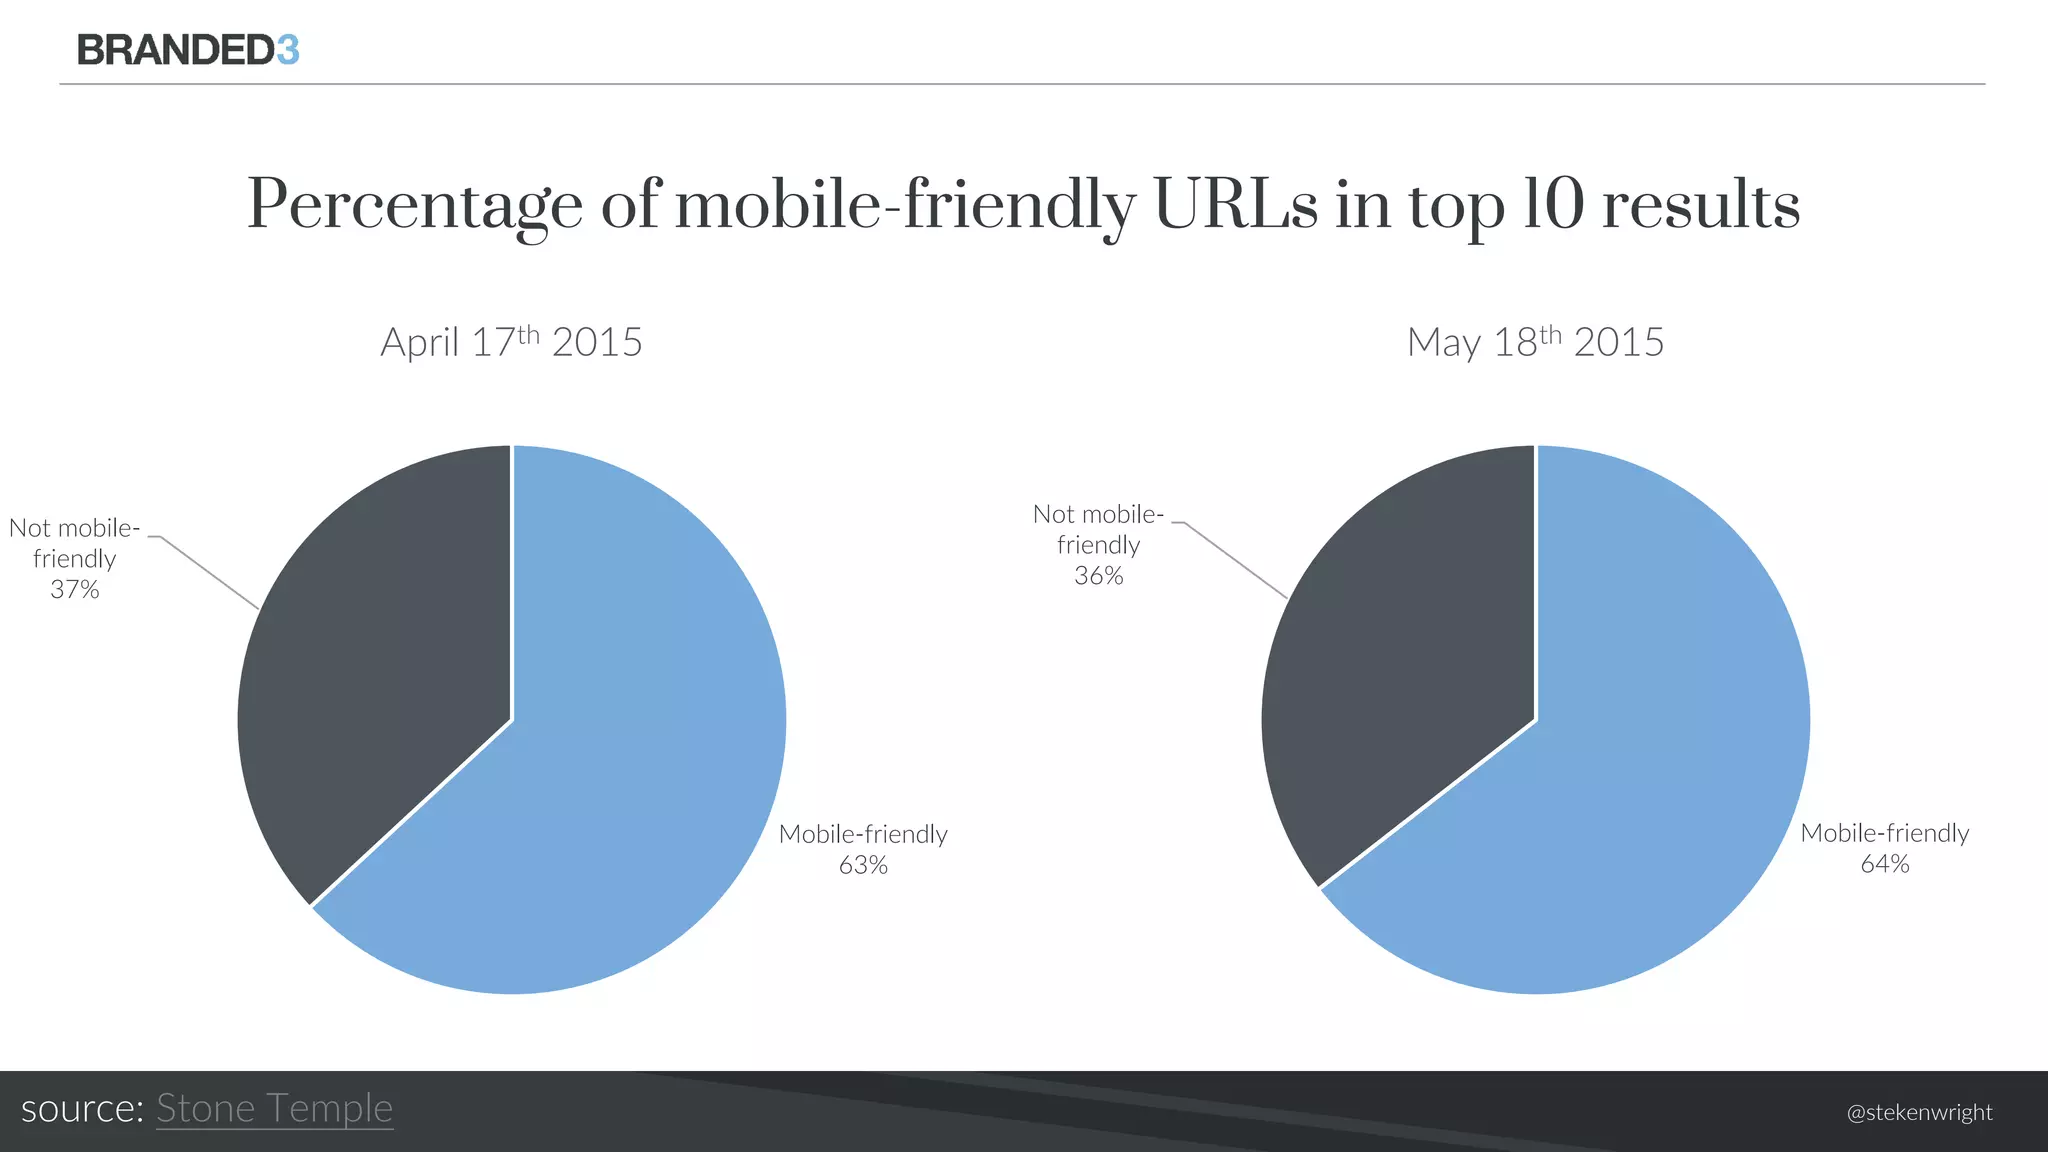
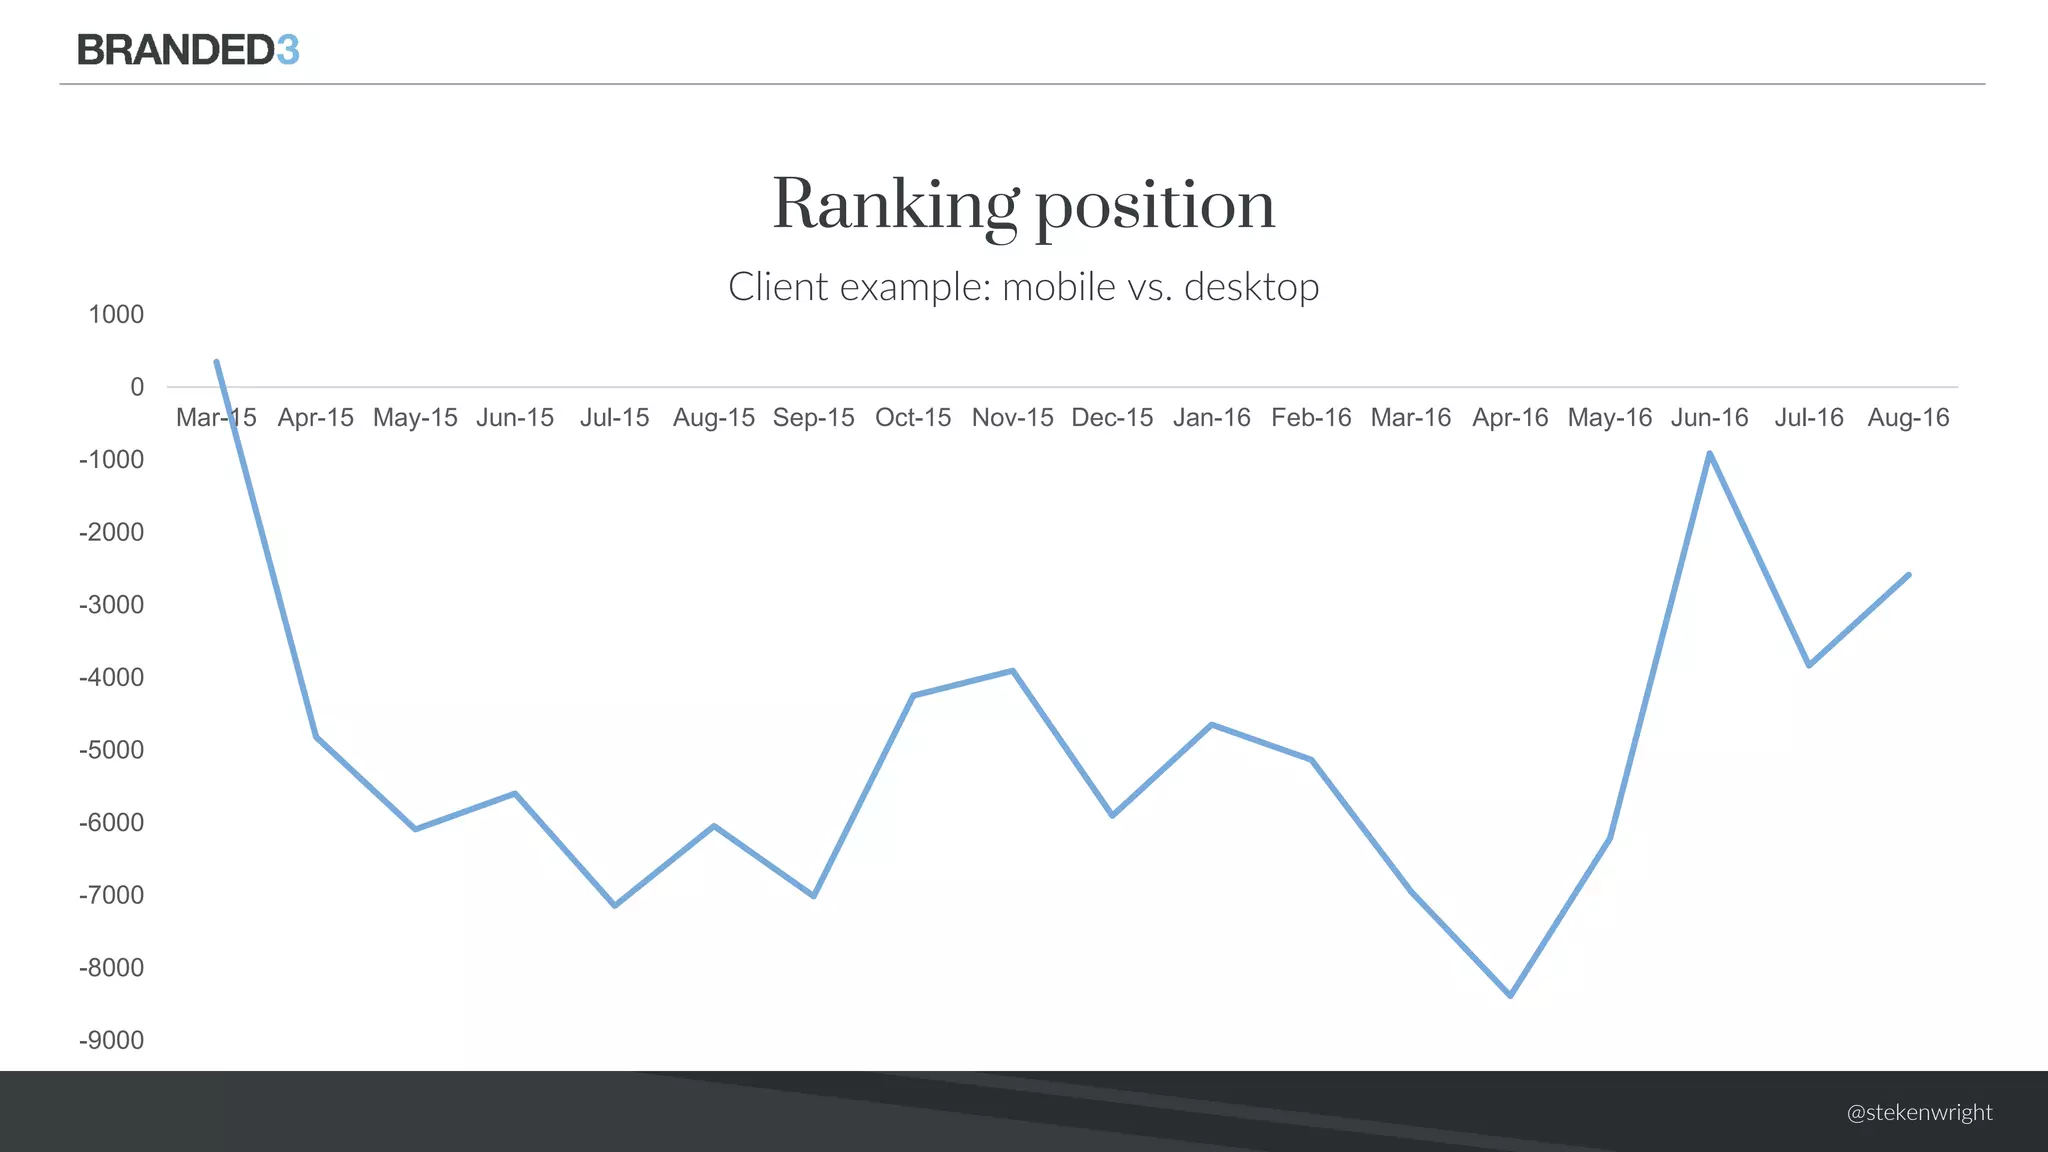
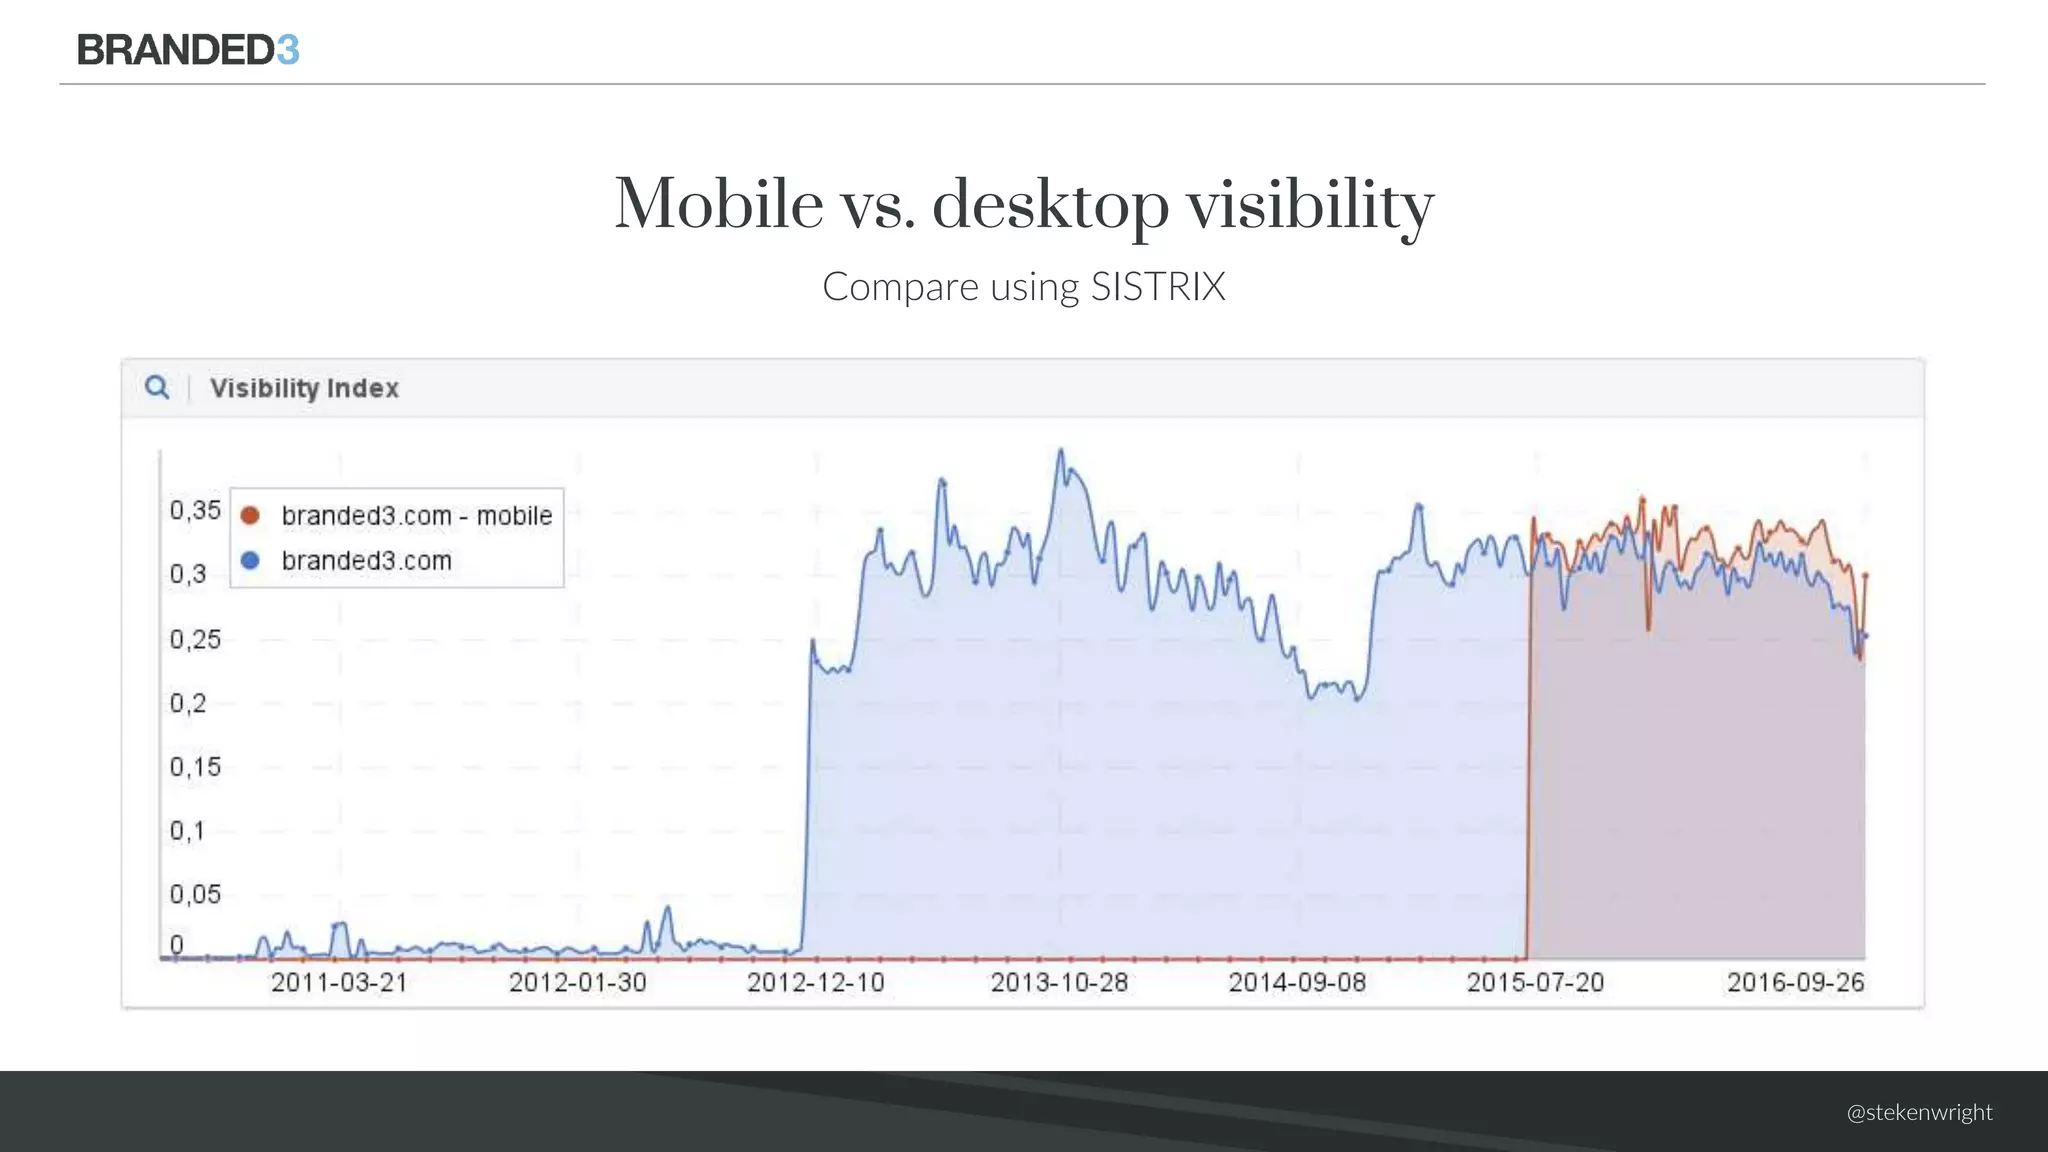
@stekenwright
Second-screen
search
Stephen Kenwright @stekenwright
@stekenwright
“I want to be buried with a mobile phone,
just in case I’m not dead.”
Amanda Holden
Tom Dymond/SYCO/THAMES TV/PA Wire
@stekenwright
TV…not PC
@stekenwright
Percentage of search engine users searching on mobile
March 2016
Google
50%
Bing
26%
Source: Ofcom
@stekenwright
39.3
21.3
13.0
35.2
18.7
11.7
19.5
5.6
2.8
0.0
5.0
10.0
15.0
20.0
25.0
30.0
35.0
40.0
45.0
Google Bing Yahoo!
Total audience Desktop audience Mobile audience
Audience of search engines (millions)
March 2016
Source: comScore
@stekenwright
A (brief) history of Google and mobile
Apple launches
the iPhone
2007
2010
Responsive Web Design
Google launches
1998
Google launches
its first Android
2009
2015
Mobile search
overtakes desktop
Google pays $1bn to be
iPhone search default
2014
@stekenwright
The iPhone predates Responsive Web Design
by at least 3 years
@stekenwright
“Get your content to go anywhere,
because it’s going to go everywhere.”
Brad Frost
Don Clark / Brand New
@stekenwright
Google, Apple, Adobe and Microsoft
collaborating on variable fonts
FastCo Design / Erik van Blokland
@stekenwright
Use Resizer to see your content on different screen sizes
design.google.com/resizer
@stekenwright
@stekenwright
90% of users start a task on one device
and complete it on another
Source: Google / LukeW
@stekenwright
Mobile app
50%
Mobile browser
7%
Tablet app
9%
Tablet browser
2%
Desktop
32%
Share of total digital time spent
July 2016
Source: comScore
@stekenwright
70.0
61.2
63.2
47.9
40.2
79.0
68.9
60.4
52.2
48.7
0.0
10.0
20.0
30.0
40.0
50.0
60.0
70.0
80.0
90.0
18-24 25-34 35-44 45-54 55+
Male Female
Average time online on a smartphone
Hours in March 2016
Source: Ofcom
@stekenwright
29.3
46.3
44.3
38.0
31.5
25.6
30.4
35.5 34.2
28.4
0.0
10.0
20.0
30.0
40.0
50.0
60.0
70.0
80.0
90.0
15-24 25-34 35-44 45-54 55+
Male Female
Average time online on a laptop/desktop
Hours in March 2016
Source: Ofcom
@stekenwright
Proportion of UK adults with a smartphone
Q1 2014
61%
Q1 2016
71%
Source: Ofcom
@stekenwright
Number of 4G subscriptions
Q4 2013
2.7m
Source: Ofcom
Q4 2014
23.6m
Q4 2015
39.5m
@stekenwright
A (brief) history of Google and site speed
2010
Page speed becomes
desktop ranking factor
Google launches
1998
2016-17
Mobile page-speed
part of mobile-friendly
5G
expected in UK
2020
4G
available in UK
2013
PageSpeed
Insights
2011
AMP
2016
@stekenwrightSource: BuiltWith
AMP adoption
@stekenwright
Mobile-friendly?
Or AMP?
@stekenwright
Both at home and
outside
66%
Mainly at home
16%
Only at home
8%
Only out of home
1%
Mainly out of home
9%
Where do you use the internet on your phone?
Source: Ofcom
@stekenwright
At home
68%
At work
9%
On the go
17%
In store
2%
Other
4%
Where are you when you search on your mobile?
Source: Think with Google
@stekenwright
3%
2%
7%
13%
17%
19%
18%
22%
0%
5%
10%
15%
20%
25%
Midnight - 3am 3 - 6am 6 - 9am 9am - Noon Noon - 3pm 3 - 6pm 6 - 8pm 8pm - Midnight
When do mobile searches occur?
Source: Think with Google
@stekenwright
36.1% used their smartphone while watching TV
Source: comScore
@stekenwright
8.6% research products or services advertised
on TV programme
Source: comScore
@stekenwrightSource: Think with Google
Still looking for
information…not a
checkout process.
@stekenwright
@stekenwright
Mobile
48%
Desktop
44%
Tablet
8%
Device split for a spread betting site
@stekenwright
Conversion rate
Lead gen website
Mobile
6.79%
Desktop
4.30%
Tablet
4.57%
@stekenwright
24.46%
21.55%
11.49%
7.80%
6.27%
3.29%
2.63% 2.42%
1.49% 1.08%
0.00%
5.00%
10.00%
15.00%
20.00%
25.00%
30.00%
1 2 3 4 5 6 7 8 9 10
Mobile click through rate
Industry average: September 2016
@stekenwright
1 2 3 4 5 6 7 8 9 10
Average 24.46% 21.55% 11.49% 7.80% 6.27% 3.29% 2.63% 2.42% 1.49% 1.08%
Finance 20.32% 18.56% 8.86% 6.59% 4.91% 2.21% 1.92% 1.48% 1.33% 0.94%
0.00%
5.00%
10.00%
15.00%
20.00%
25.00%
30.00%
Mobile click through rate in finance
vs. average mobile CTR
@stekenwright
1 2 3 4 5 6 7 8 9 10
Average 24.46% 21.55% 11.49% 7.80% 6.27% 3.29% 2.63% 2.42% 1.49% 1.08%
iGaming 21.44% 7.48% 6.74% 4.03% 3.72% 2.52% 1.69% 1.70% 1.05% 1.13%
0.00%
5.00%
10.00%
15.00%
20.00%
25.00%
30.00%
Mobile click through rate in iGaming
vs. average mobile CTR
@stekenwright
@stekenwright
1 2 3 4 5 6 7 8 9 10
Average 24.46% 21.55% 11.49% 7.80% 6.27% 3.29% 2.63% 2.42% 1.49% 1.08%
Travel 21.13% 13.45% 10.30% 5.62% 4.36% 3.19% 2.03% 1.59% 1.56% 1.46%
0.00%
5.00%
10.00%
15.00%
20.00%
25.00%
30.00%
Mobile click through rate in travel
vs. average mobile CTR
@stekenwright
More
branded3.com/blog/mobile-ctr
@stekenwright
1 2 3 4 5 6 7 8 9 10
September 24.46% 21.55% 11.49% 7.80% 6.27% 3.29% 2.63% 2.42% 1.49% 1.08%
April 30.40% 20.03% 11.81% 9.25% 5.37% 3.86% 3.03% 1.74% 1.47% 1.08%
0.00%
5.00%
10.00%
15.00%
20.00%
25.00%
30.00%
35.00%
Mobile click through rate
Before/after May 2016 mobile-friendly update: September vs. April 2016
@stekenwrightSource: Merkle
Traffic from 4th text ad
June/July 2016
@stekenwright
85% of all pages in the mobile search results
meet mobile-friendly criteria
Source: Google
@stekenwright
Mobile-friendly
63%
Not mobile-
friendly
37%
April 17th 2015
Percentage of mobile-friendly URLs in top 10 results
Mobile-friendly
64%
Not mobile-
friendly
36%
May 18th 2015
source: Stone Temple
@stekenwright
Traffic trends
Client example
Desktop Mobile Tablet Linear (Desktop) Linear (Mobile) Linear (Tablet)
@stekenwright
Mobile rate of growth
Client example
0.0%
2.0%
4.0%
6.0%
8.0%
10.0%
12.0%
14.0%
16.0%
18.0%
20.0%
Feb-13
Mar-13
Apr-13
May-13
Jun-13
Jul-13
Aug-13
Sep-13
Oct-13
Nov-13
Dec-13
Jan-14
Feb-14
Mar-14
Apr-14
May-14
Jun-14
Jul-14
Aug-14
Sep-14
Oct-14
Nov-14
Dec-14
Jan-15
Feb-15
Mar-15
Apr-15
May-15
Jun-15
Jul-15
Aug-15
Sep-15
Oct-15
Nov-15
Dec-15
Jan-16
Feb-16
Mar-16
Apr-16
May-16
Jun-16
Jul-16
Aug-16
Percent of mobile traffic from Google organic Percentage of mobile traffic excluding Google organic
@stekenwright
Mobile
40%
Tablet
23%
Desktop
37%
Search volume by device
Search volume vs. actual traffic
Client example
Mobile
14%
Tablet
36%
Desktop
50%
Organic data sources
@stekenwright
Ranking position
Client example: mobile vs. desktop
-9000
-8000
-7000
-6000
-5000
-4000
-3000
-2000
-1000
0
1000
@stekenwright
Mobile vs. desktop visibility
Compare using SISTRIX

Second screen search: how mobile SEO became the only SEO

Editor's Notes

  • #4 TV…not PC
  • #5 Yahoo! and Bing used by 78% as many people as Google
  • #7 Yahoo! and Bing used by 78% as many people as Google
  • #8 Mobile phones couldn’t use the web *at all* until a year after Google launched. Apple products are half of Google’s mobile revenue
  • #17 UK population 64.1m
  • #18 77% of mobile searches are conducted in a place where there’s probably a computer
  • #23 77% of mobile searches are conducted in a place where there’s probably a computer
  • #24 36% use their smartphone while watching TV, 8.6% researched products advertised on TV
  • #27 Mobile: 114,050 Desktop: 104,595 Tablet: 19,702
  • #28 20k conversions over the last year
  • #36 Top 10 results for 15,235 search queries
  • #37 Although mobile traffic appears to be increasing for all traffic sources, this is not the case with Google organic only traffic. This is increasing at a much slower rate. Desktop traffic in Google organic is remaining relatively level compared to all other sources where desktop is declining.
  • #39 1,000 search terms 40% (496,000) mobile Desktop (455,000)
  • #42 24% of over 55s only use desktop 13% of 18-24s don’t use desktop
  • #43 24% of over 55s only use desktop 13% of 18-24s don’t use desktop