Download as PDF, PPTX

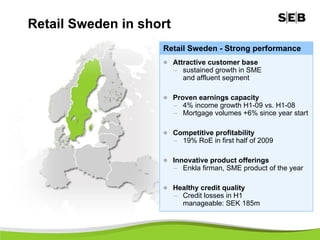
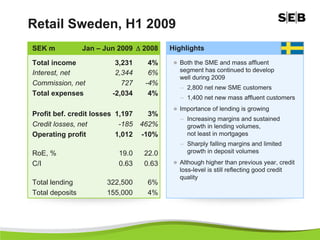
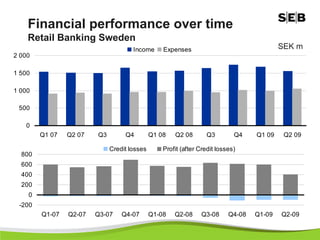


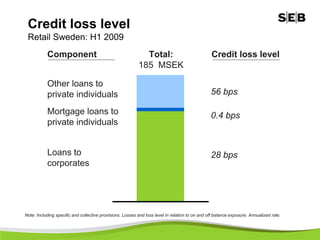


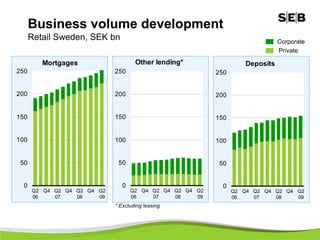

Mats Torstendahl is the Head of Retail Banking at SEB, a major bank in Sweden and the Baltic region. In the first half of 2009, SEB's Retail Banking division in Sweden performed strongly, with 4% income growth and a 19% return on equity. However, credit losses were higher year-over-year at SEK 185 million. Going forward, SEB is well positioned to support customers and grow in core areas like serving small- and medium-sized enterprises, while improving the customer experience.


![[ARCHIVE] Infographic of the Aviva Real Retirement Report Summer 2012](https://cdn.slidesharecdn.com/ss_thumbnails/rrrsummer2012infographic-120712082223-phpapp02-thumbnail.jpg?width=640&height=640&fit=bounds)