Download as PDF, PPTX

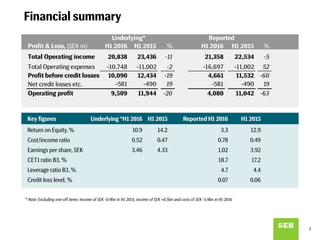
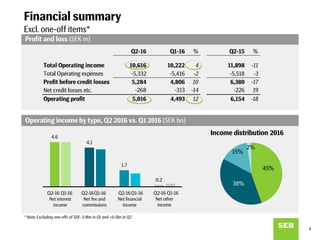
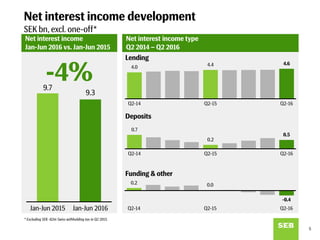
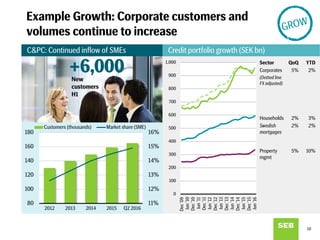

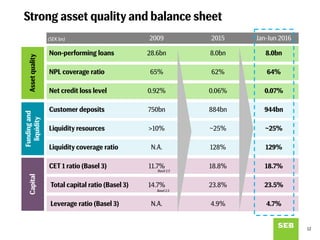


The document presents SEB's financial performance for the first half of 2016, highlighting a decrease in total operating income and profit before credit losses compared to the previous year due to increased market uncertainty. Despite the challenges, SEB maintained a strong capital position and asset quality, reporting a CET1 ratio of 18.7% and a leverage ratio of 4.7%. The bank also noted higher customer demand for risk management services amid a volatile environment.


