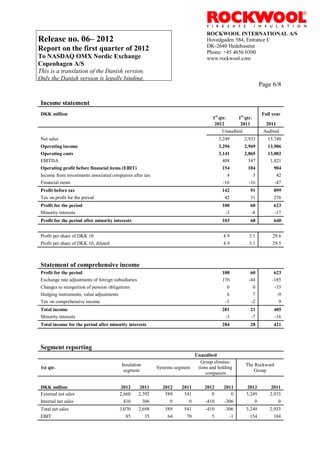
- Rockwool International A/S reported financial results for the first quarter of 2012, with net sales increasing 11% compared to the same period in 2011.
- Earnings before interest and tax (EBIT) increased 48% to DKK 154 million for the quarter, compared to DKK 104 million in 2011.
- The company expects full year 2012 net sales to increase 5% at current exchange rates and net income to be between DKK 650-700 million.
The Chinese version of the presentation, delivered on Monday 7th December 2009 to attendees to Wai Yin Chinese Women Society's Education Training and Employment Unit Award Ceremony, held at Glamorous Restaurant in Manchester.
Strategic plans are prepared at different levels using different approaches, but the ones mentioned below are 5 important elements of a good strategic plan.
Результат исследования содержит динамику и структуру рынка обойных клеев за период 2013 - первое полугодие 2015 гг. Также, в отчете можно увидеть доли основных операторов рынка, динамику структуры рынка по производителям, сегментацию по торговым маркам.
https://aimarketing.info/ru/services/marketing-analytics
Luc Bertrand is een man met visie. Op ondernemerschap. Op investeren. Op participeren. Op leidinggeven. Op ons maatschappelijk model. Op duurzaamheid. Op de toekomst. Hij heeft er duidelijke ideeën over, een mening, een langetermijnvisie, die hij met ons gedeeld heeft.
http://www.vkw.be
Услуги контакт-центра:
Сервисы горячей линии
Услуги диагностики
Услуги по поиску потенциальных клиентов (лидогенерация)
Работа с базами
Управление клиентским опытом (CEM)
https://aimarketing.info/uk/
Исследование может быть интересно компаниям, которые работают в индустрии энергоэффективных решений. Отчет дает понимание общих тенденций экономики, строительного сектора, рынков: теплоизоляции, теплотехники, оконных конструкций.
https://aimarketing.info/ru/industries/energy-efficiency
Исследование может быть интересно компаниям, которые работают в индустрии энергоэффективных решений. Отчет дает понимание общих тенденций экономики, строительного сектора, рынков: теплоизоляции, теплотехники, оконных конструкций.
https://aimarketing.info/ru/industries
Агентство Индустриального Маркетинга подготовило отчет по мониторингу рынка битумных кровельных материалов за первое полугодие 2015 года.
Структура отчета:
I. Мастики битумные
II. Праймеры битумные
- динамика показателей объема импорта, кг
- структура импорта битумной мастики по брендам, кг
- динамика показателей объема експорта, кг
- структура реэкспорта битумной мастики по брендам, кг
https://aimarketing.info/ru/services/marketing-analytics
По итогам сотрудничества компания Galleria Porcellanato дала отзыв о компании AIM.
По заказу компании Galleria Porcellanato Агентство Индустриального Маркетинга проводило диагностику индустрии дизайна и архитектуры.
https://aimarketing.info/ru/services/marketing-analytics
Чешская компания "Агра групп" дала отзыв о сотрудничестве с исследовательской компанией Агентство Индустриального Маркетинга по итогам проекта по поиску потенциальных партнеров в Украине.
https://aimarketing.info
Компания Agency of Industrial Marketing проводит исследование рынка масел. Представляем вам эту демо-версию презентации для понимания содержания отчета.
Структура и содержание отчета могут меняться под нужды Заказчика
Отчет может предоставляться ежемесячно, ежеквартально до 15 числа месяца следующего за отчетным.
Для получения детальной информации вы можете связаться с нами по телефону
+380 44 290-94-35 или отправив письмо на email: info@aimarketing.info
https://aimarketing.info/ru/services/market-research
Исследование включает рынок газовых, твердотопливных и электрических бытовых котлов Украины.
В исследовании использованы данные производства, импорта и экспорта.
Период исследования: 1 квартал 2015 года.
https://aimarketing.info/ru/services/market-research
В отчете представлены реальные данные импорта за ноябрь 2014г. Данные за другие периоды условны.
https://aimarketing.info/ru/services/marketing-analytics
ВД краски и штукатурки, 2013-2014 гг.
Примечание: торговые марки размещены не в порядке увеличения/уменьшения доли на рынке
https://aimarketing.info/ru/services/marketing-analytics
Исследование завершено 30.06.2015.
Тип исследования: кабинетное.
Период исследования: 2013-2015 гг.
В качестве базовых показателей взяты данные за 2013 год, до начала оккупации Россией Крыма и восточных регионов Украины.
https://aimarketing.info/ru/services/marketing-analytics
how can i use my minded pi coins I need some funds.DOT TECH
If you are interested in selling your pi coins, i have a verified pi merchant, who buys pi coins and resell them to exchanges looking forward to hold till mainnet launch.
Because the core team has announced that pi network will not be doing any pre-sale. The only way exchanges like huobi, bitmart and hotbit can get pi is by buying from miners.
Now a merchant stands in between these exchanges and the miners. As a link to make transactions smooth. Because right now in the enclosed mainnet you can't sell pi coins your self. You need the help of a merchant,
i will leave the telegram contact of my personal pi merchant below. 👇 I and my friends has traded more than 3000pi coins with him successfully.
@Pi_vendor_247
how to sell pi coins in South Korea profitably.DOT TECH
Yes. You can sell your pi network coins in South Korea or any other country, by finding a verified pi merchant
What is a verified pi merchant?
Since pi network is not launched yet on any exchange, the only way you can sell pi coins is by selling to a verified pi merchant, and this is because pi network is not launched yet on any exchange and no pre-sale or ico offerings Is done on pi.
Since there is no pre-sale, the only way exchanges can get pi is by buying from miners. So a pi merchant facilitates these transactions by acting as a bridge for both transactions.
How can i find a pi vendor/merchant?
Well for those who haven't traded with a pi merchant or who don't already have one. I will leave the telegram id of my personal pi merchant who i trade pi with.
Tele gram: @Pi_vendor_247
#pi #sell #nigeria #pinetwork #picoins #sellpi #Nigerian #tradepi #pinetworkcoins #sellmypi
The European Unemployment Puzzle: implications from population agingGRAPE
We study the link between the evolving age structure of the working population and unemployment. We build a large new Keynesian OLG model with a realistic age structure, labor market frictions, sticky prices, and aggregate shocks. Once calibrated to the European economy, we quantify the extent to which demographic changes over the last three decades have contributed to the decline of the unemployment rate. Our findings yield important implications for the future evolution of unemployment given the anticipated further aging of the working population in Europe. We also quantify the implications for optimal monetary policy: lowering inflation volatility becomes less costly in terms of GDP and unemployment volatility, which hints that optimal monetary policy may be more hawkish in an aging society. Finally, our results also propose a partial reversal of the European-US unemployment puzzle due to the fact that the share of young workers is expected to remain robust in the US.
how to sell pi coins on Bitmart crypto exchangeDOT TECH
Yes. Pi network coins can be exchanged but not on bitmart exchange. Because pi network is still in the enclosed mainnet. The only way pioneers are able to trade pi coins is by reselling the pi coins to pi verified merchants.
A verified merchant is someone who buys pi network coins and resell it to exchanges looking forward to hold till mainnet launch.
I will leave the telegram contact of my personal pi merchant to trade with.
@Pi_vendor_247
Empowering the Unbanked: The Vital Role of NBFCs in Promoting Financial Inclu...Vighnesh Shashtri
In India, financial inclusion remains a critical challenge, with a significant portion of the population still unbanked. Non-Banking Financial Companies (NBFCs) have emerged as key players in bridging this gap by providing financial services to those often overlooked by traditional banking institutions. This article delves into how NBFCs are fostering financial inclusion and empowering the unbanked.
Poonawalla Fincorp and IndusInd Bank Introduce New Co-Branded Credit Cardnickysharmasucks
The unveiling of the IndusInd Bank Poonawalla Fincorp eLITE RuPay Platinum Credit Card marks a notable milestone in the Indian financial landscape, showcasing a successful partnership between two leading institutions, Poonawalla Fincorp and IndusInd Bank. This co-branded credit card not only offers users a plethora of benefits but also reflects a commitment to innovation and adaptation. With a focus on providing value-driven and customer-centric solutions, this launch represents more than just a new product—it signifies a step towards redefining the banking experience for millions. Promising convenience, rewards, and a touch of luxury in everyday financial transactions, this collaboration aims to cater to the evolving needs of customers and set new standards in the industry.
Exploring Abhay Bhutada’s Views After Poonawalla Fincorp’s Collaboration With...beulahfernandes8
The financial landscape in India has witnessed a significant development with the recent collaboration between Poonawalla Fincorp and IndusInd Bank.
The launch of the co-branded credit card, the IndusInd Bank Poonawalla Fincorp eLITE RuPay Platinum Credit Card, marks a major milestone for both entities.
This strategic move aims to redefine and elevate the banking experience for customers.
What price will pi network be listed on exchangesDOT TECH
The rate at which pi will be listed is practically unknown. But due to speculations surrounding it the predicted rate is tends to be from 30$ — 50$.
So if you are interested in selling your pi network coins at a high rate tho. Or you can't wait till the mainnet launch in 2026. You can easily trade your pi coins with a merchant.
A merchant is someone who buys pi coins from miners and resell them to Investors looking forward to hold massive quantities till mainnet launch.
I will leave the telegram contact of my personal pi vendor to trade with.
@Pi_vendor_247
Currently pi network is not tradable on binance or any other exchange because we are still in the enclosed mainnet.
Right now the only way to sell pi coins is by trading with a verified merchant.
What is a pi merchant?
A pi merchant is someone verified by pi network team and allowed to barter pi coins for goods and services.
Since pi network is not doing any pre-sale The only way exchanges like binance/huobi or crypto whales can get pi is by buying from miners. And a merchant stands in between the exchanges and the miners.
I will leave the telegram contact of my personal pi merchant. I and my friends has traded more than 6000pi coins successfully
Tele-gram
@Pi_vendor_247
BYD SWOT Analysis and In-Depth Insights 2024.pptxmikemetalprod
Indepth analysis of the BYD 2024
BYD (Build Your Dreams) is a Chinese automaker and battery manufacturer that has snowballed over the past two decades to become a significant player in electric vehicles and global clean energy technology.
This SWOT analysis examines BYD's strengths, weaknesses, opportunities, and threats as it competes in the fast-changing automotive and energy storage industries.
Founded in 1995 and headquartered in Shenzhen, BYD started as a battery company before expanding into automobiles in the early 2000s.
Initially manufacturing gasoline-powered vehicles, BYD focused on plug-in hybrid and fully electric vehicles, leveraging its expertise in battery technology.
Today, BYD is the world’s largest electric vehicle manufacturer, delivering over 1.2 million electric cars globally. The company also produces electric buses, trucks, forklifts, and rail transit.
On the energy side, BYD is a major supplier of rechargeable batteries for cell phones, laptops, electric vehicles, and energy storage systems.
The Evolution of Non-Banking Financial Companies (NBFCs) in India: Challenges...beulahfernandes8
Role in Financial System
NBFCs are critical in bridging the financial inclusion gap.
They provide specialized financial services that cater to segments often neglected by traditional banks.
Economic Impact
NBFCs contribute significantly to India's GDP.
They support sectors like micro, small, and medium enterprises (MSMEs), housing finance, and personal loans.
USDA Loans in California: A Comprehensive Overview.pptxmarketing367770
USDA Loans in California: A Comprehensive Overview
If you're dreaming of owning a home in California's rural or suburban areas, a USDA loan might be the perfect solution. The U.S. Department of Agriculture (USDA) offers these loans to help low-to-moderate-income individuals and families achieve homeownership.
Key Features of USDA Loans:
Zero Down Payment: USDA loans require no down payment, making homeownership more accessible.
Competitive Interest Rates: These loans often come with lower interest rates compared to conventional loans.
Flexible Credit Requirements: USDA loans have more lenient credit score requirements, helping those with less-than-perfect credit.
Guaranteed Loan Program: The USDA guarantees a portion of the loan, reducing risk for lenders and expanding borrowing options.
Eligibility Criteria:
Location: The property must be located in a USDA-designated rural or suburban area. Many areas in California qualify.
Income Limits: Applicants must meet income guidelines, which vary by region and household size.
Primary Residence: The home must be used as the borrower's primary residence.
Application Process:
Find a USDA-Approved Lender: Not all lenders offer USDA loans, so it's essential to choose one approved by the USDA.
Pre-Qualification: Determine your eligibility and the amount you can borrow.
Property Search: Look for properties in eligible rural or suburban areas.
Loan Application: Submit your application, including financial and personal information.
Processing and Approval: The lender and USDA will review your application. If approved, you can proceed to closing.
USDA loans are an excellent option for those looking to buy a home in California's rural and suburban areas. With no down payment and flexible requirements, these loans make homeownership more attainable for many families. Explore your eligibility today and take the first step toward owning your dream home.
1. ROCKWOOL INTERNATIONAL A/S
Release no. 06– 2012 Hovedgaden 584, Entrance C
DK-2640 Hedehusene
Report on the first quarter of 2012 Phone: +45 4656 0300
To NASDAQ OMX Nordic Exchange www.rockwool.com
Copenhagen A/S
This is a translation of the Danish version.
Only the Danish version is legally binding.
Page 1/8
22 May 2012
Report on the first quarter of 2012
for Rockwool International A/S
Today the Board of Directors of Rockwool International A/S has approved the
following report on the first quarter of 2012.
Highlights
Sales in the first quarter of 2012 at actual exchange rates increased by 11%
compared to the same period in 2011.
EBIT in the first quarter of 2012 amounts to DKK 154 million which is an
increase of DKK 50 million, 48% above the same period in 2011.
The Group still expects net sales at current exchange rates to increase by 5%
for the full year 2012.
The Group expects a result after minority interests between DKK 650 and
700 million.
Capital expenditure excluding acquisitions is now expected to be DKK 1,300
million.
Further information: Gilles Maria, Chief Financial Officer
2. ROCKWOOL INTERNATIONAL A/S
Release no. 06– 2012 Hovedgaden 584, Entrance C
DK-2640 Hedehusene
Report on the first quarter of 2012 Phone: +45 4656 0300
To NASDAQ OMX Nordic Exchange www.rockwool.com
Copenhagen A/S
This is a translation of the Danish version.
Only the Danish version is legally binding.
Page 2/8
Main figures / key figures for the Group
DKK million Full year
1st qtr. 1st qtr.
2012 2011 2011
Unaudited Audited
Income statement items in DKK million
Net sales 3,249 2,933 13,748
EBITDA 408 347 1,821
Depreciation, amortisation and write-downs 254 243 917
EBIT 154 104 904
Financial items -16 -16 -47
Profit before tax 142 91 899
Profit for the period after minority interests 103 68 640
Balance sheet items in DKK million
Non-current assets 9,544 8,997 9,377
Current assets 3,562 3,354 3,301
Total assets 13,106 12,351 12,678
Equity 8,922 8,800 8,635
Non-current liabilities 1,426 1,276 1,368
Current liabilities 2,758 2,275 2,675
Other items in DKK million
Cash flow from operating activities 51 -25 1,527
Investments and acquisitions 260 280 1,200
Free cash flow -209 -305 327
Net interest-bearing debt 760 676 550
Number of employees
Number of employees at end of period 9,628 8,924 9,368
Ratios
Profit ratio (%) 5 4 7
Earnings per share of DKK 10 4.9 3.1 29.6
Earnings per share of DKK 10, diluted 4.9 3.1 29.5
Cash earnings per share of DKK 10 2 -1.2 71
Book value per share of DKK 10 406 391 392
Return on invested capital (%) 2 1 10
Return on equity (%) 1 1 7
Equity ratio (%) 68 70 68
Financial gearing 0.09 0.08 0.06
The ratios have been calculated in accordance with recommendations issued by the Danish Society of Financial
Analysts (2010 edition).
3. ROCKWOOL INTERNATIONAL A/S
Release no. 06– 2012 Hovedgaden 584, Entrance C
DK-2640 Hedehusene
Report on the first quarter of 2012 Phone: +45 4656 0300
To NASDAQ OMX Nordic Exchange www.rockwool.com
Copenhagen A/S
This is a translation of the Danish version.
Only the Danish version is legally binding.
Page 3/8
Management report for the period from 1 January to 31 March 2012
Income statement
The Rockwool Group generated sales in the first quarter of 2012 of DKK 3,249 million corre-
sponding to an increase of 11% compared to same period last year.
External sales in the Insulation Segment increased by 11% to DKK 2,660 million, and Sys-
tems Segment’s external sales increased by 9% to DKK 589 million.
In the Insulation segment, the first quarter of 2012 benefited from good market conditions in
the main European markets, driven by Poland, France and Germany. The sales increase in
Russia is levelling out compared to last year although still showing an increase compared to
same quarter last year. Sales in North America have continued their strong development seen
throughout last year. In Asia, and especially in China, demand for non-combustible insulation
material is still very high and our nice sales development is limited by available production
capacity.
Sales prices have continued to increase during first quarter of 2012 however with large differ-
ences between markets. The inflation on oil related raw materials was still high for this peri-
od. However, lower demand on coking coal triggered a decrease in the price of foundry coke
from which the Group should get more benefit in the coming quarters.
EBITDA for the Group reached DKK 408 million resulting in an EBITDA ratio of 13% for
the first quarter of 2012 which is an improvement of 1% point compared to the same period
last year.
EBIT was DKK 154 million – an increase of DKK 50 million compared to same period last
year. Insulation segment EBIT for the first quarter reached DKK 85 million which is an in-
crease of 143% compared to the first quarter of last year. Systems Segment generated an
EBIT of DKK 64 million which is 9% below the EBIT for the first quarter of 2011.
Net financial costs ended up at DKK 16 million which is on the same level as last year.
Profit after minority interests for the first quarter of 2012 amounted to DKK 103 million
which is DKK 35 million better than last year.
Cash flow
Cash flow from operations for the first quarter of 2012 is DKK 51 million which is DKK 76
million above last year.
4. ROCKWOOL INTERNATIONAL A/S
Release no. 06– 2012 Hovedgaden 584, Entrance C
DK-2640 Hedehusene
Report on the first quarter of 2012 Phone: +45 4656 0300
To NASDAQ OMX Nordic Exchange www.rockwool.com
Copenhagen A/S
This is a translation of the Danish version.
Only the Danish version is legally binding.
Page 4/8
Working capital development has had a negative effect on cash flow of DKK 247 million in
the first quarter of 2012 which is primarily due to increase of net sales resulting in higher
debtors and to seasonal stocks.
Capital expenditure in the first quarter of 2012 was DKK 260 million which is a decrease of
DKK 20 million compared to the same period of 2011.
Balance sheet
Total assets end of the first quarter of 2012 amounted to DKK 13,106 million. The equity ra-
tio at the end of the period was 68%.
Expectations for 2012
In Europe, market conditions are expected to be more difficult in the coming quarters as a
consequence of the on-going Euro crisis and the low confidence level in most of the countries.
The Russian insulation market will most likely continue to grow at a reasonable pace despite a
slowdown observed in the first quarter. The very positive sales development in North Ameri-
ca is expected to continue, and recent improvement on market conditions should support it
further. Demand in Asia is expected to continue and the Group organises supplies to be able
to satisfy it. Overall, the Group confirms it expectations for a net sales increase at current ex-
change rates by 5% for the full year 2012.
Although European market conditions are seen less favourable, the Group is still aiming to
continue to increase sales price. The slowdown of the world economy should reduce the infla-
tionary pressure seen over the last quarters, and the Group expects to benefit from this in com-
ing quarters helping margins to recover. The Group now expects a result after minority inter-
ests for the year 2012 between DKK 650 and 700 million.
Capital expenditure excluding acquisitions is expected to be DKK 1,300 million, a decrease of
DKK 100 million compared to previous expectation.
Disclaimer
The statements on the future in this report, including expected sales and earnings, are associ-
ated with risks and uncertainties and may be affected by factors influencing the activities of
the group, e.g. the global economic environment, including interest and exchange rate devel-
opments, the raw material situation, production and distribution-related issues, breach of con-
tract or unexpected termination of contract, price reductions due to market-driven price reduc-
tions, market acceptance of new products, launches of competitive products and other unfore-
seen factors.
5. ROCKWOOL INTERNATIONAL A/S
Release no. 06– 2012 Hovedgaden 584, Entrance C
DK-2640 Hedehusene
Report on the first quarter of 2012 Phone: +45 4656 0300
To NASDAQ OMX Nordic Exchange www.rockwool.com
Copenhagen A/S
This is a translation of the Danish version.
Only the Danish version is legally binding.
Page 5/8
Management statement
The Board of Directors and Group Management have today approved this interim report for
the first quarter of 2012.
This interim report, which has not been audited or reviewed by the Group’s auditor, has been
prepared in accordance with IAS 34 Interim Financial Reporting, as approved by the EU and
additional Danish requirements for financial reporting by listed companies.
We believe that the accounting policies applied – which are unchanged from those applied in
the annual report for 2011 – are appropriate and that the accounting estimates made are rea-
sonable. In our opinion this interim report presents a true and fair view of the Group’s assets,
liabilities and financial position on 31 March 2012 and of earnings and cash flows during the
period.
Furthermore we believe that the management report gives a true and fair statement of the de-
velopment of the Group’s activities and financial situation, the result of the period and of the
Group’s financial position as a whole as well as a description of the most important risks and
uncertainties which the Group is facing.
22 May 2012
Group Management
Eelco van Heel Gilles Maria
Board of Directors
Tom Kähler Steen Riisgaard Carsten Bjerg
Heinz-Jürgen Bertram Claus Bugge Garn Bjørn Høi Jensen
Thomas Kähler Dorthe Lybye Connie Enghus Theisen
6. ROCKWOOL INTERNATIONAL A/S
Release no. 06– 2012 Hovedgaden 584, Entrance C
DK-2640 Hedehusene
Report on the first quarter of 2012 Phone: +45 4656 0300
To NASDAQ OMX Nordic Exchange www.rockwool.com
Copenhagen A/S
This is a translation of the Danish version.
Only the Danish version is legally binding.
Page 6/8
Income statement
DKK million Full year
1st qtr. 1st qtr.
2012 2011 2011
Unaudited Audited
Net sales 3,249 2,933 13,748
Operating income 3,294 2,969 13,906
Operating costs 3,141 2,865 13,002
EBITDA 408 347 1,821
Operating profit before financial items (EBIT) 154 104 904
Income from investments associated companies after tax 4 3 42
Financial items -16 -16 -47
Profit before tax 142 91 899
Tax on profit for the period 42 31 276
Profit for the period 100 60 623
Minority interests -3 -8 -17
Profit for the period after minority interests 103 68 640
Profit per share of DKK 10 4.9 3.1 29.6
Profit per share of DKK 10, diluted 4.9 3.1 29.5
Statement of comprehensive income
Profit for the period 100 60 623
Exchange rate adjustments of foreign subsidiaries 176 -44 -185
Changes to recognition of pension obligations 0 0 -33
Hedging instruments, value adjustments 6 7 -9
Tax on comprehensive income -1 -2 9
Total income 281 21 405
Minority interests -3 -7 -16
Total income for the period after minority interests 284 28 421
Segment reporting
Unaudited
Group elimina-
Insulation The Rockwool
1st qtr. Systems segment tions and holding
segment Group
companies
DKK million 2012 2011 2012 2011 2012 2011 2012 2011
External net sales 2,660 2,392 589 541 0 0 3,249 2,933
Internal net sales 410 306 0 0 -410 -306 0 0
Total net sales 3,070 2,698 589 541 -410 -306 3,249 2,933
EBIT 85 35 64 70 5 -1 154 104
7. ROCKWOOL INTERNATIONAL A/S
Release no. 06– 2012 Hovedgaden 584, Entrance C
DK-2640 Hedehusene
Report on the first quarter of 2012 Phone: +45 4656 0300
To NASDAQ OMX Nordic Exchange www.rockwool.com
Copenhagen A/S
This is a translation of the Danish version.
Only the Danish version is legally binding.
Page 7/8
Cash flow statement
DKK million 1st qtr. 1st qtr. Full year
2012 2011 2011
Unaudited Audited
Operating profit before financial items 154 104 904
Adjustments for depreciation, amortisation and write-downs 254 243 917
Other adjustments -19 18 41
Change in net working capital -247 -339 -47
Cash flow from operations before financial items and tax 142 26 1,815
Cash flow from operating activities 51 -25 1,527
Cash flow from investing activities -260 -280 -1,200
Cash flow from operating and investing activities (free cash flow) -209 -305 327
Cash flow from financing activities -60 -64 -514
Change in cash available -269 -369 -187
Cash available – beginning of period -128 132 132
Business combinations 0 0 -24
Exchange rate adjustments 1 11 -49
Cash available – end of period -396 -226 -128
Unutilised, committed credit facilities 3,236 3,505 3,450
Balance sheet
DKK million 1st qtr. 1st qtr. Full year
2012 2011 2011
Assets Unaudited Audited
Intangible assets 549 447 559
Tangible assets 8,287 7,991 8,102
Other financial assets 393 337 401
Deferred tax assets 315 222 315
Total non-current assets 9,544 8,997 9,377
Inventories 1,277 1,182 1,110
Receivables 1,943 1,925 1,844
Cash 342 247 347
Total current assets 3,562 3,354 3,301
Total assets 13,106 12,351 12,678
Equity and liabilities
Share capital 220 220 220
Hedging -14 -7 -19
Foreign currency translation -178 -214 -354
Retained earnings 8,885 8,596 8,776
Minority interests 9 205 12
Total equity 8,922 8,800 8,635
Non-current liabilities 1,426 1,276 1,368
Current liabilities 2,758 2,275 2,675
Total liabilities 4,184 3,551 4,043
Total equity and liabilities 13,106 12,351 12,678
8. ROCKWOOL INTERNATIONAL A/S
Release no. 06– 2012 Hovedgaden 584, Entrance C
DK-2640 Hedehusene
Report on the first quarter of 2012 Phone: +45 4656 0300
To NASDAQ OMX Nordic Exchange www.rockwool.com
Copenhagen A/S
This is a translation of the Danish version.
Only the Danish version is legally binding.
Page 8/8
Statement of equity
Unaudited
Foreign
Share Retained Minority
DKK million Hedging currency Total
capital earnings interests
translation
Equity 1/1 2012 220 -19 -354 8,776 12 8,635
Profit for the period 103 -3 100
Exchange rate adjustments of foreign subsidiaries 176 0 176
Hedging instruments, value adjustments 6 6
Tax on hedging instruments, value adjustments -1 -1
Total income 5 176 103 -3 281
Sale and purchase of own shares 0
Expensed value of options issued 6 6
Dividend paid to the shareholders 0
Addition/disposal of minority interests 0
st
Equity 1 qtr. 2012 220 -14 -178 8,885 9 8,922
Equity 1/1 2011 220 -12 -169 8,524 212 8,775
Profit for the period 68 -8 60
Exchange rate adjustments of foreign subsidiaries -45 1 -44
Hedging instruments, value adjustments 7 7
Tax on hedging instruments, value adjustments -2 -2
Total income 5 -45 68 -7 21
Sale and purchase of own shares 0
Expensed value of options issued 4 4
Dividend paid to the shareholders 0
Addition/disposal of minority interests 0
st
Equity 1 qtr. 2011 220 -7 -214 8,596 205 8,800
1st qtr. 1st qtr. Full year
Main figures in EUR million: 2012 2011 2011
Unaudited Audited
Net sales 437 394 1,845
Depreciation, amortisation and write-downs 34 33 123
EBIT 21 14 122
Profit before tax 19 12 121
Profit for the period after minority interests 14 9 86
Total assets 1,762 1,658 1,705
Equity 1,199 1,181 1,162
Cash flow (from operating activities) 7 -3 205
Investments and acquisitions 35 38 161
Exchange rate 7.44 7.45 7.43