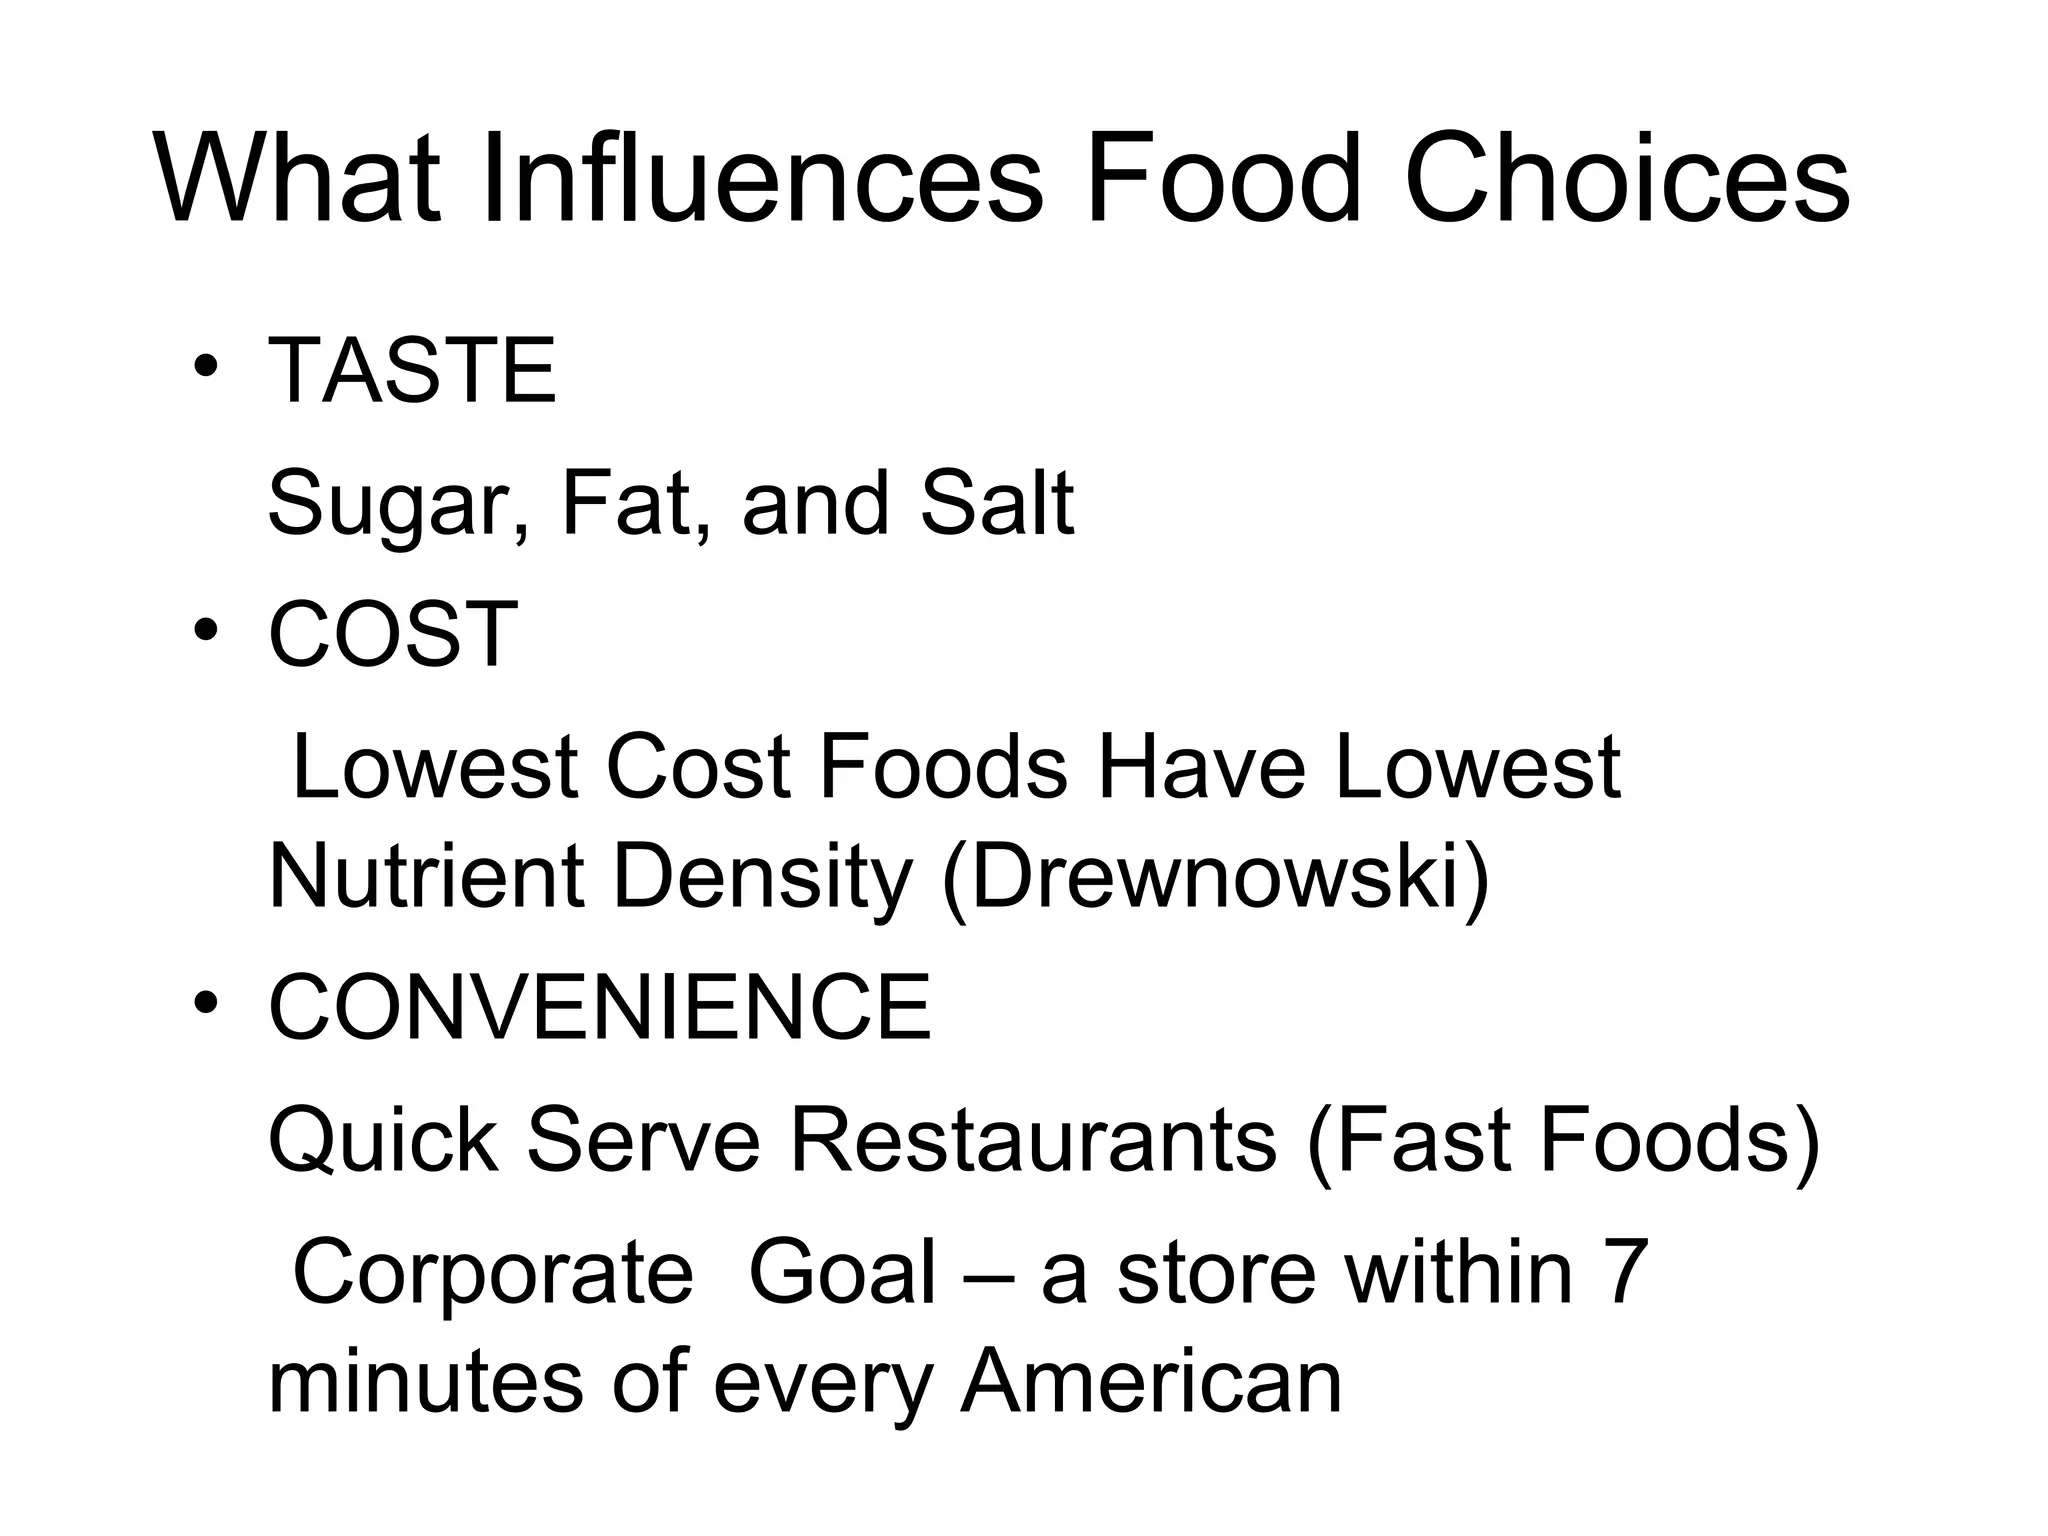
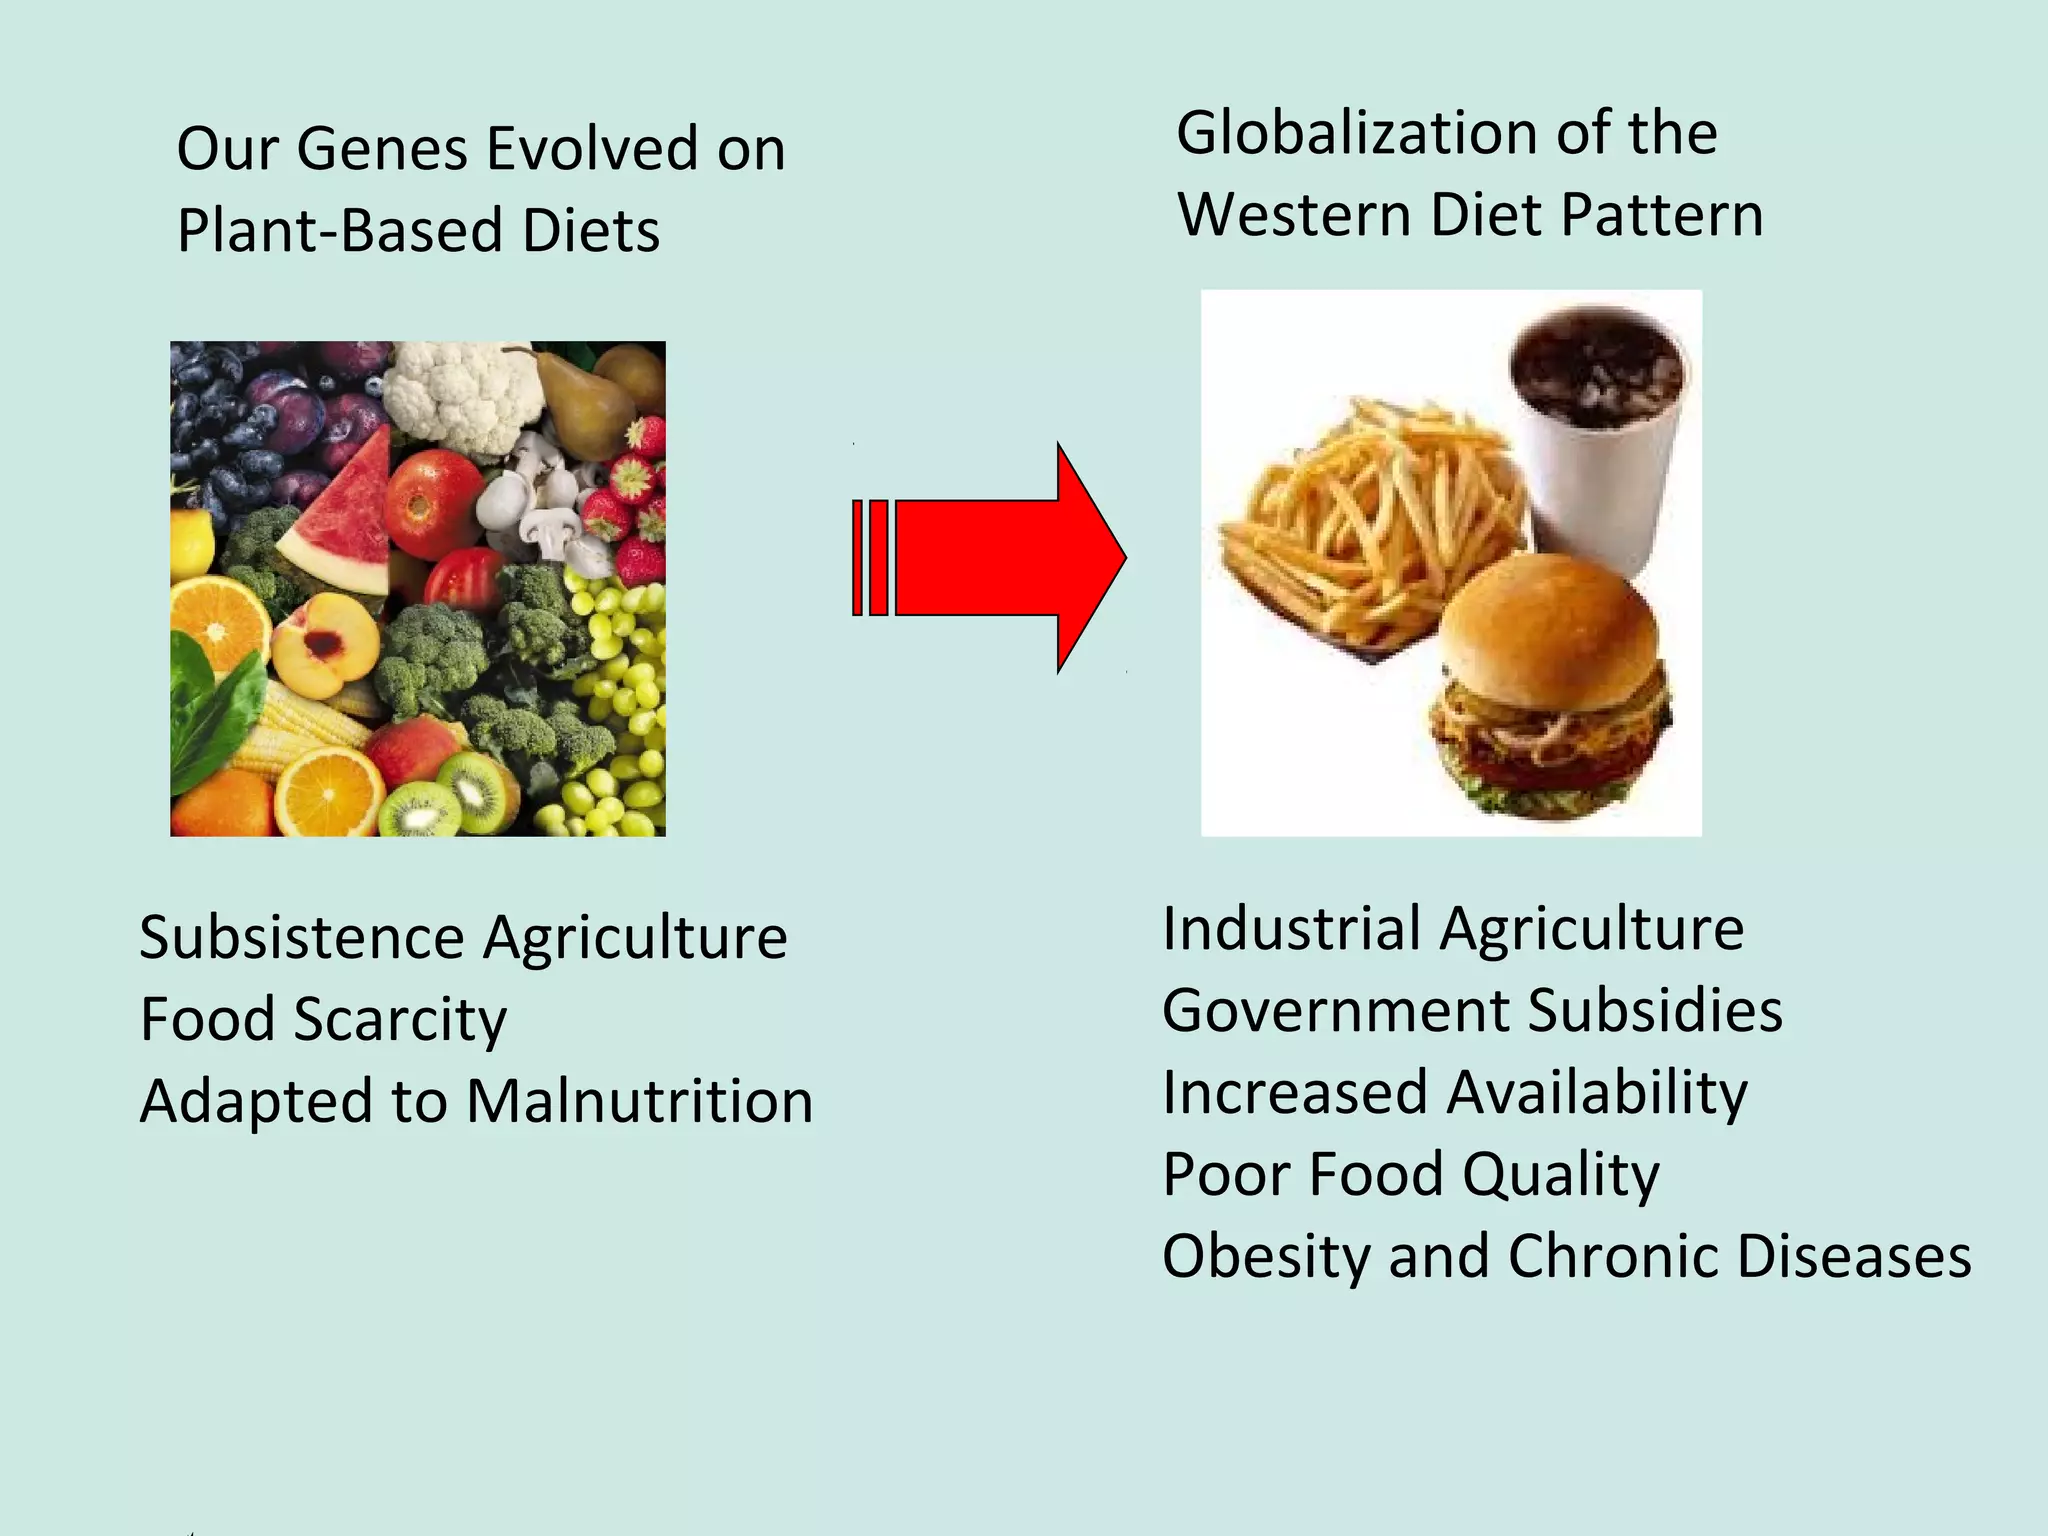
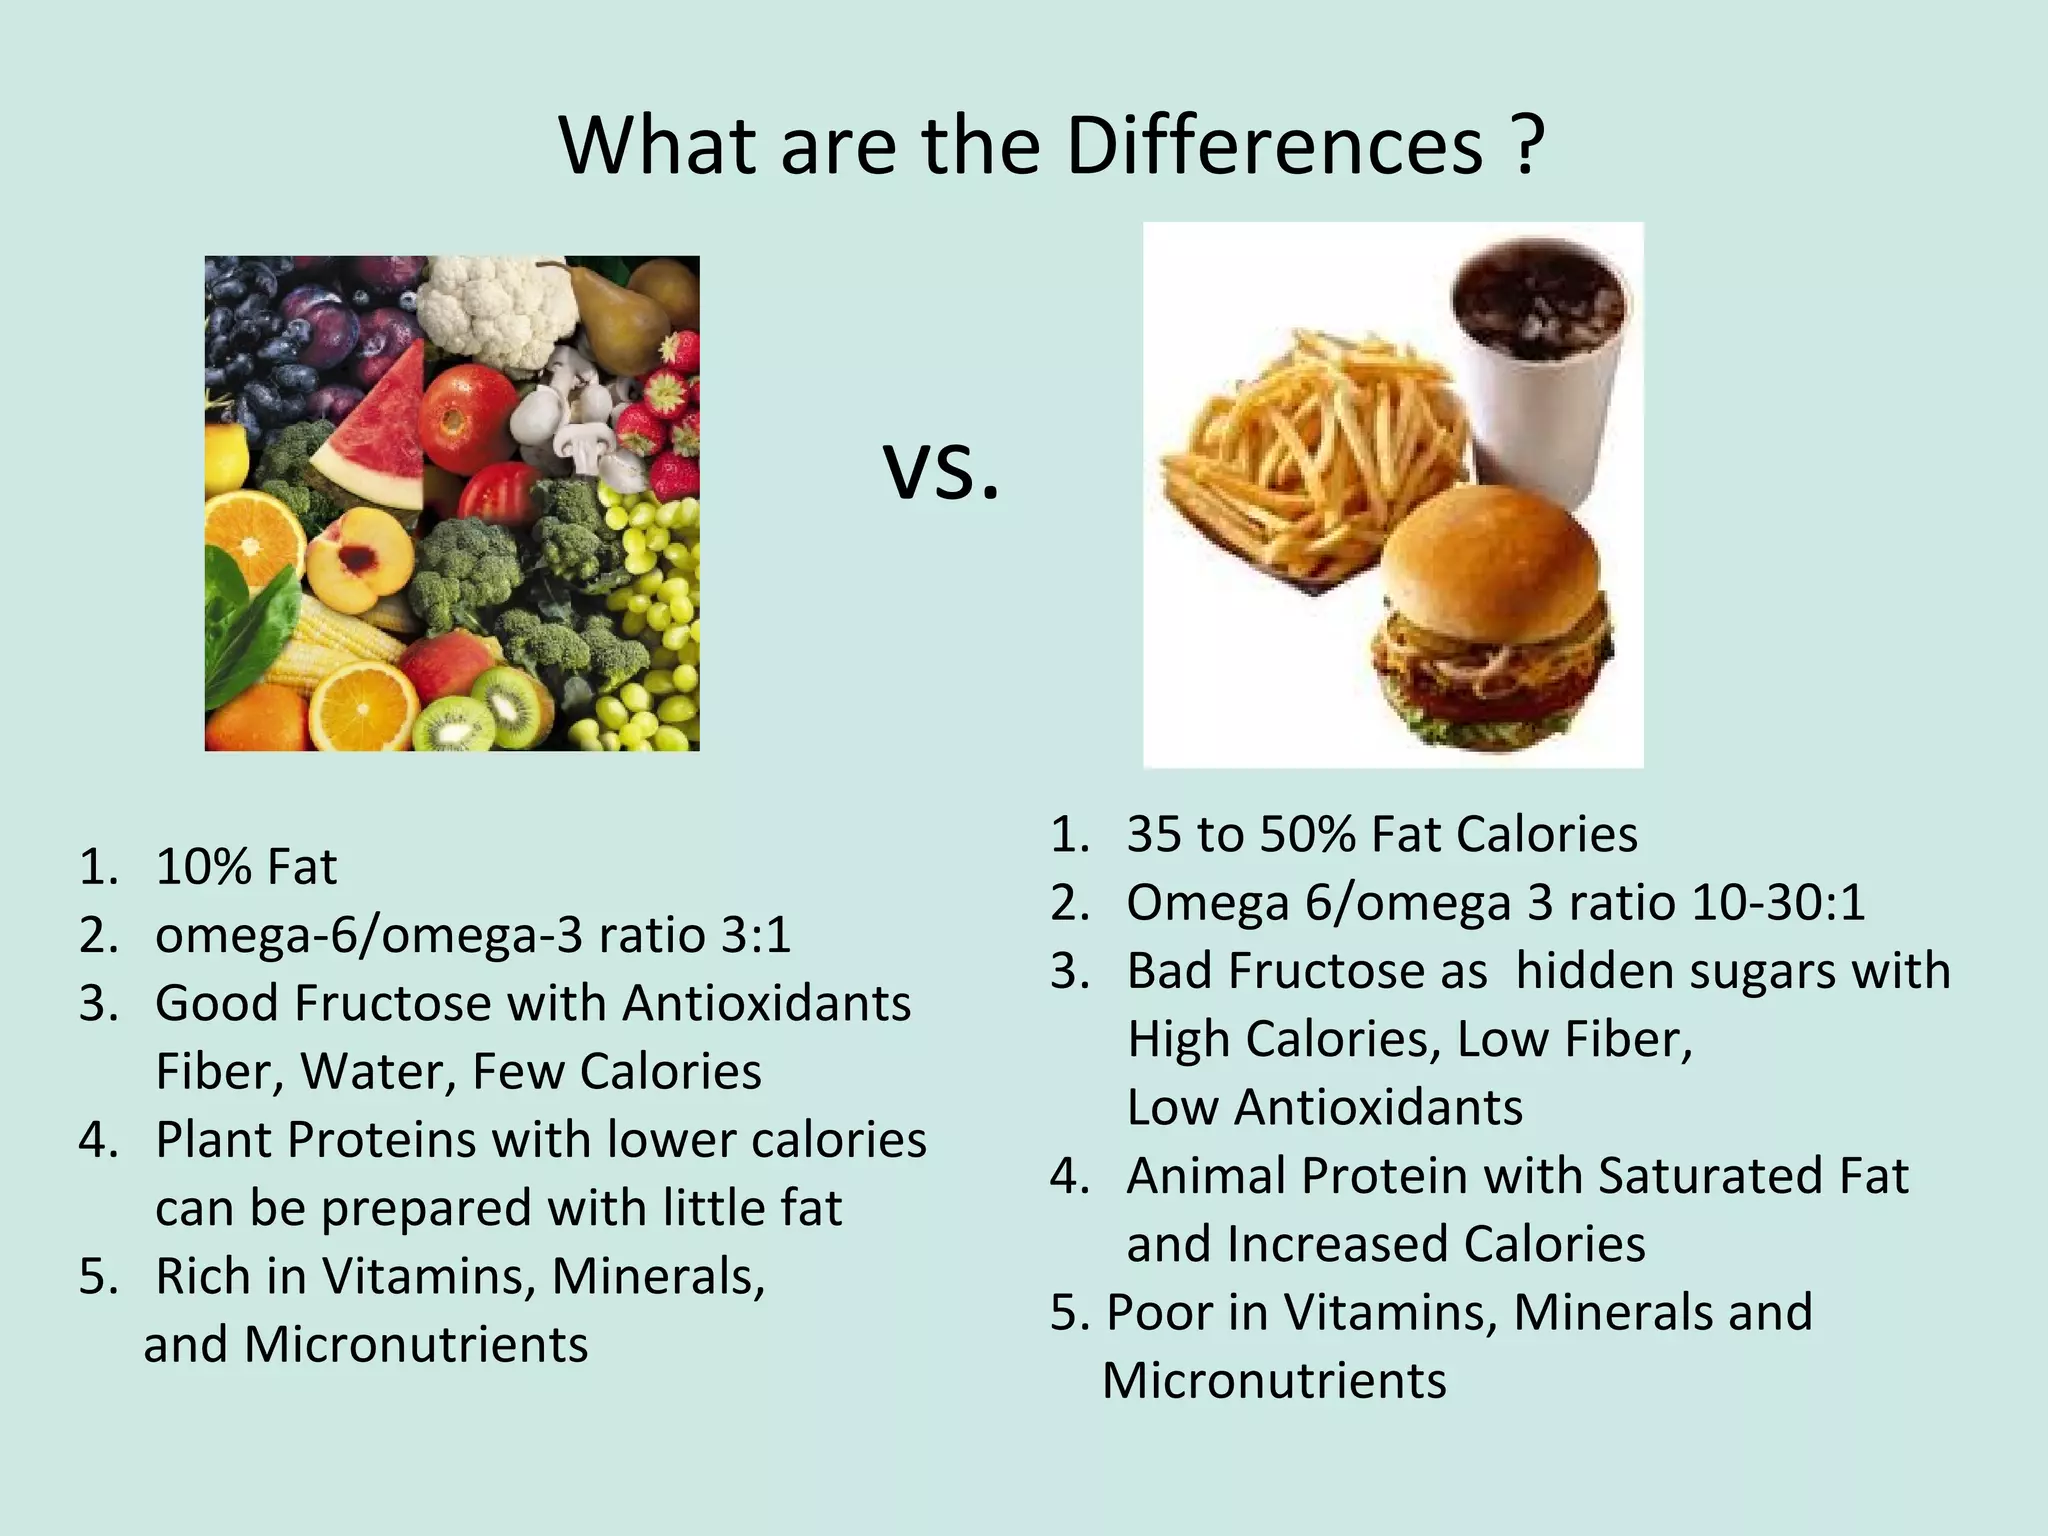
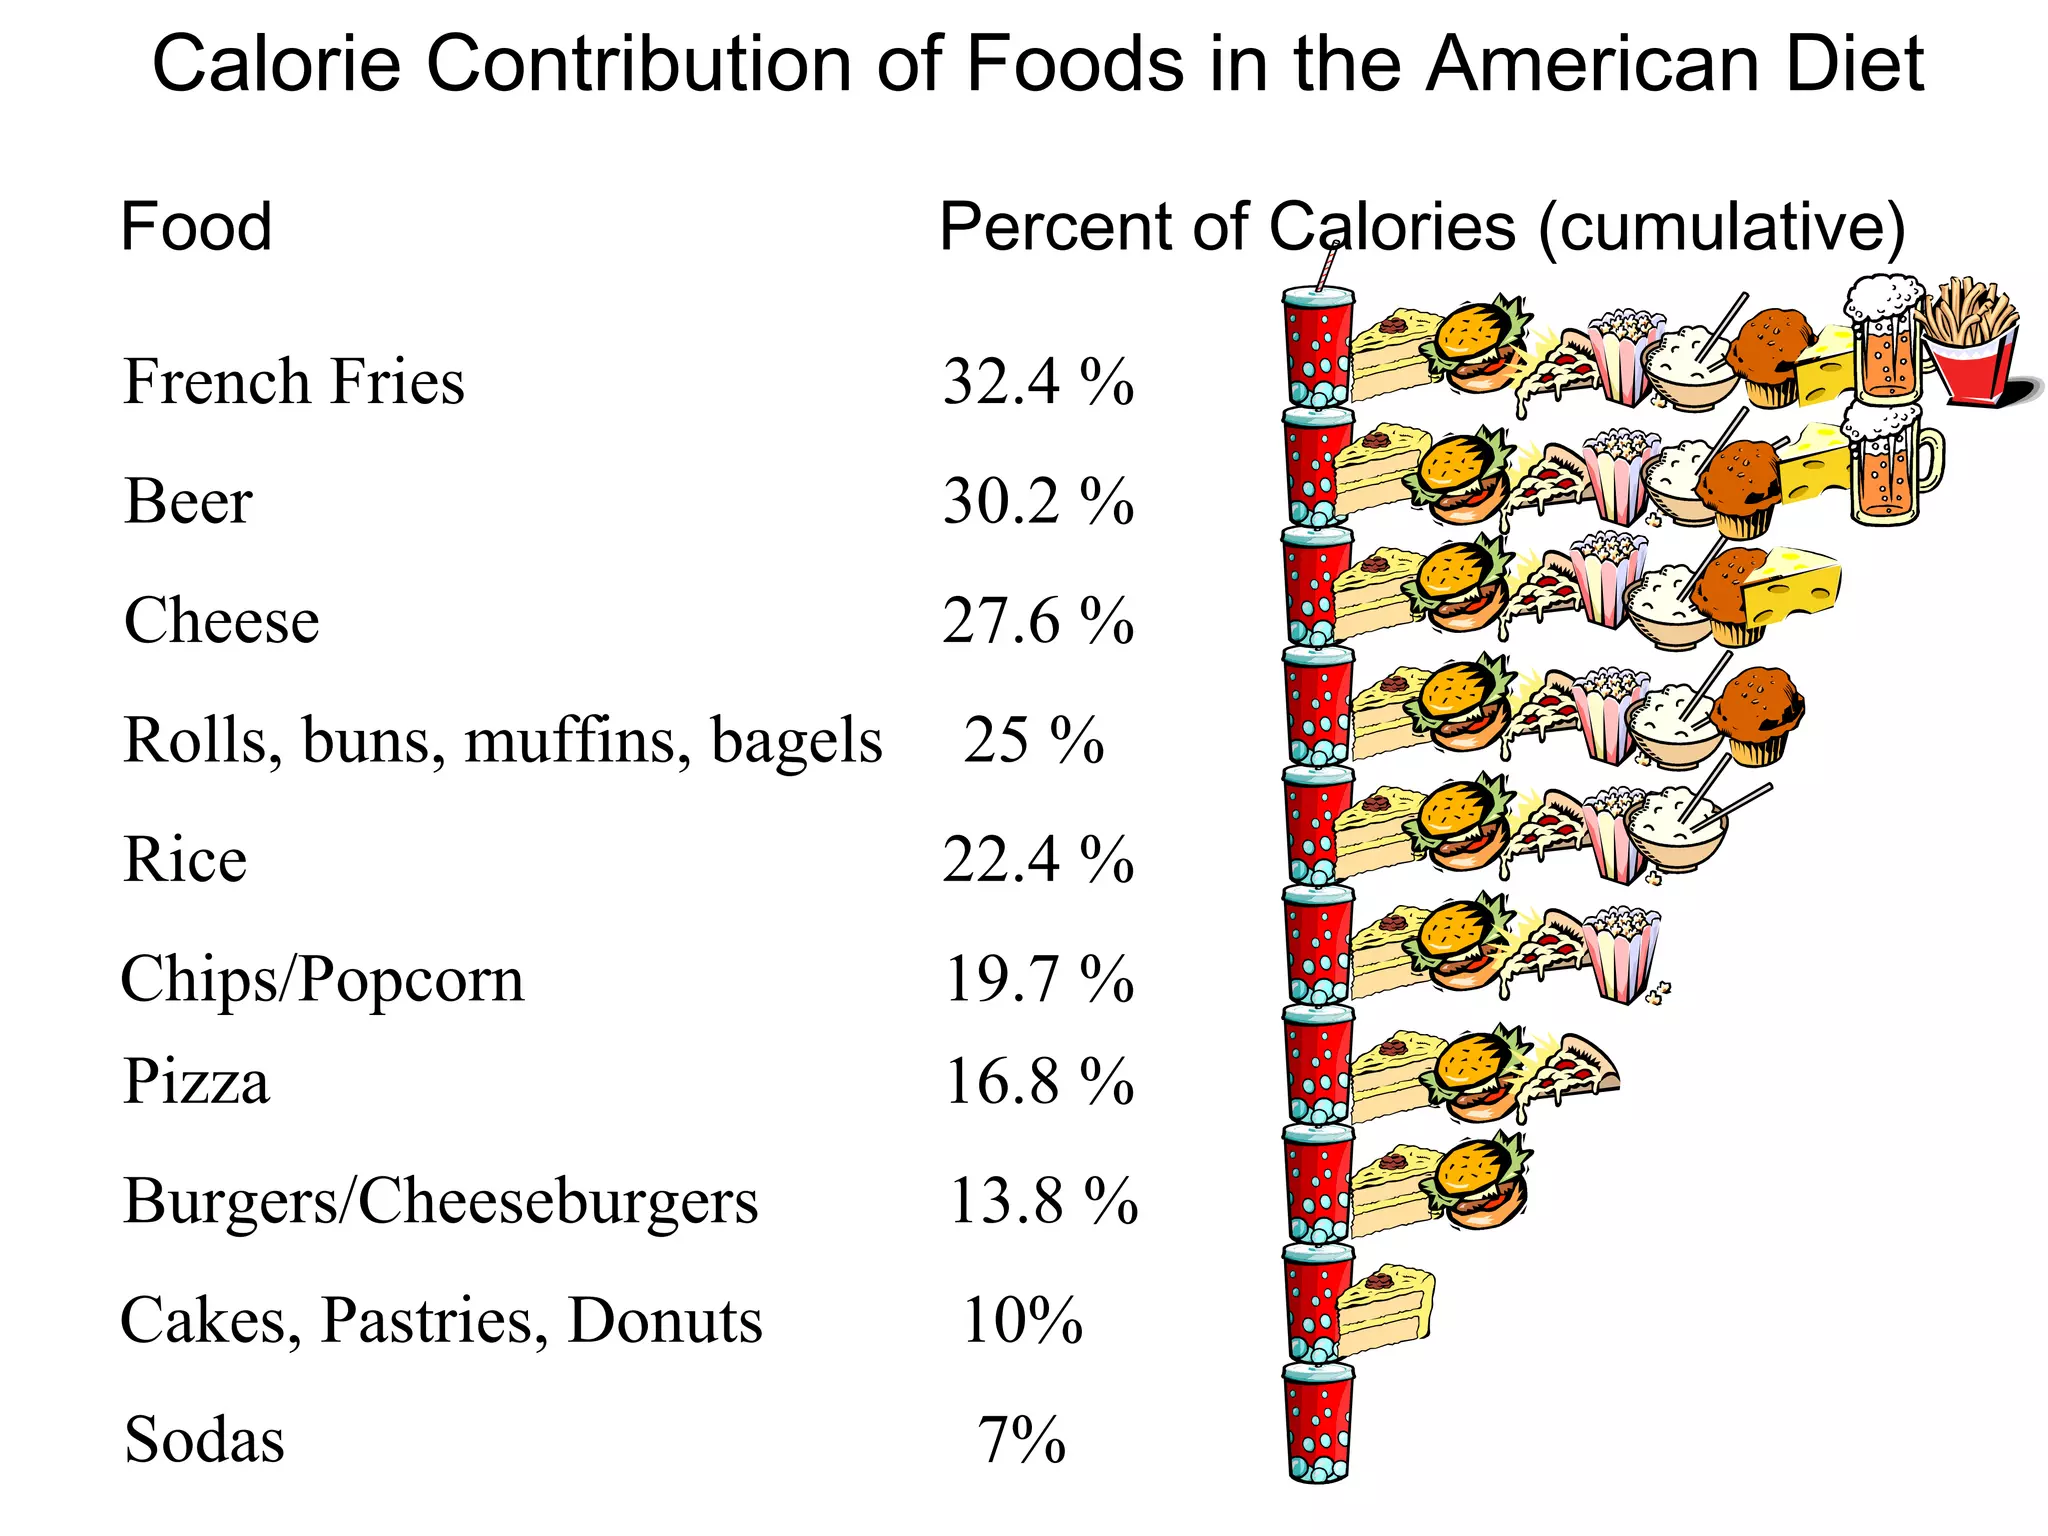
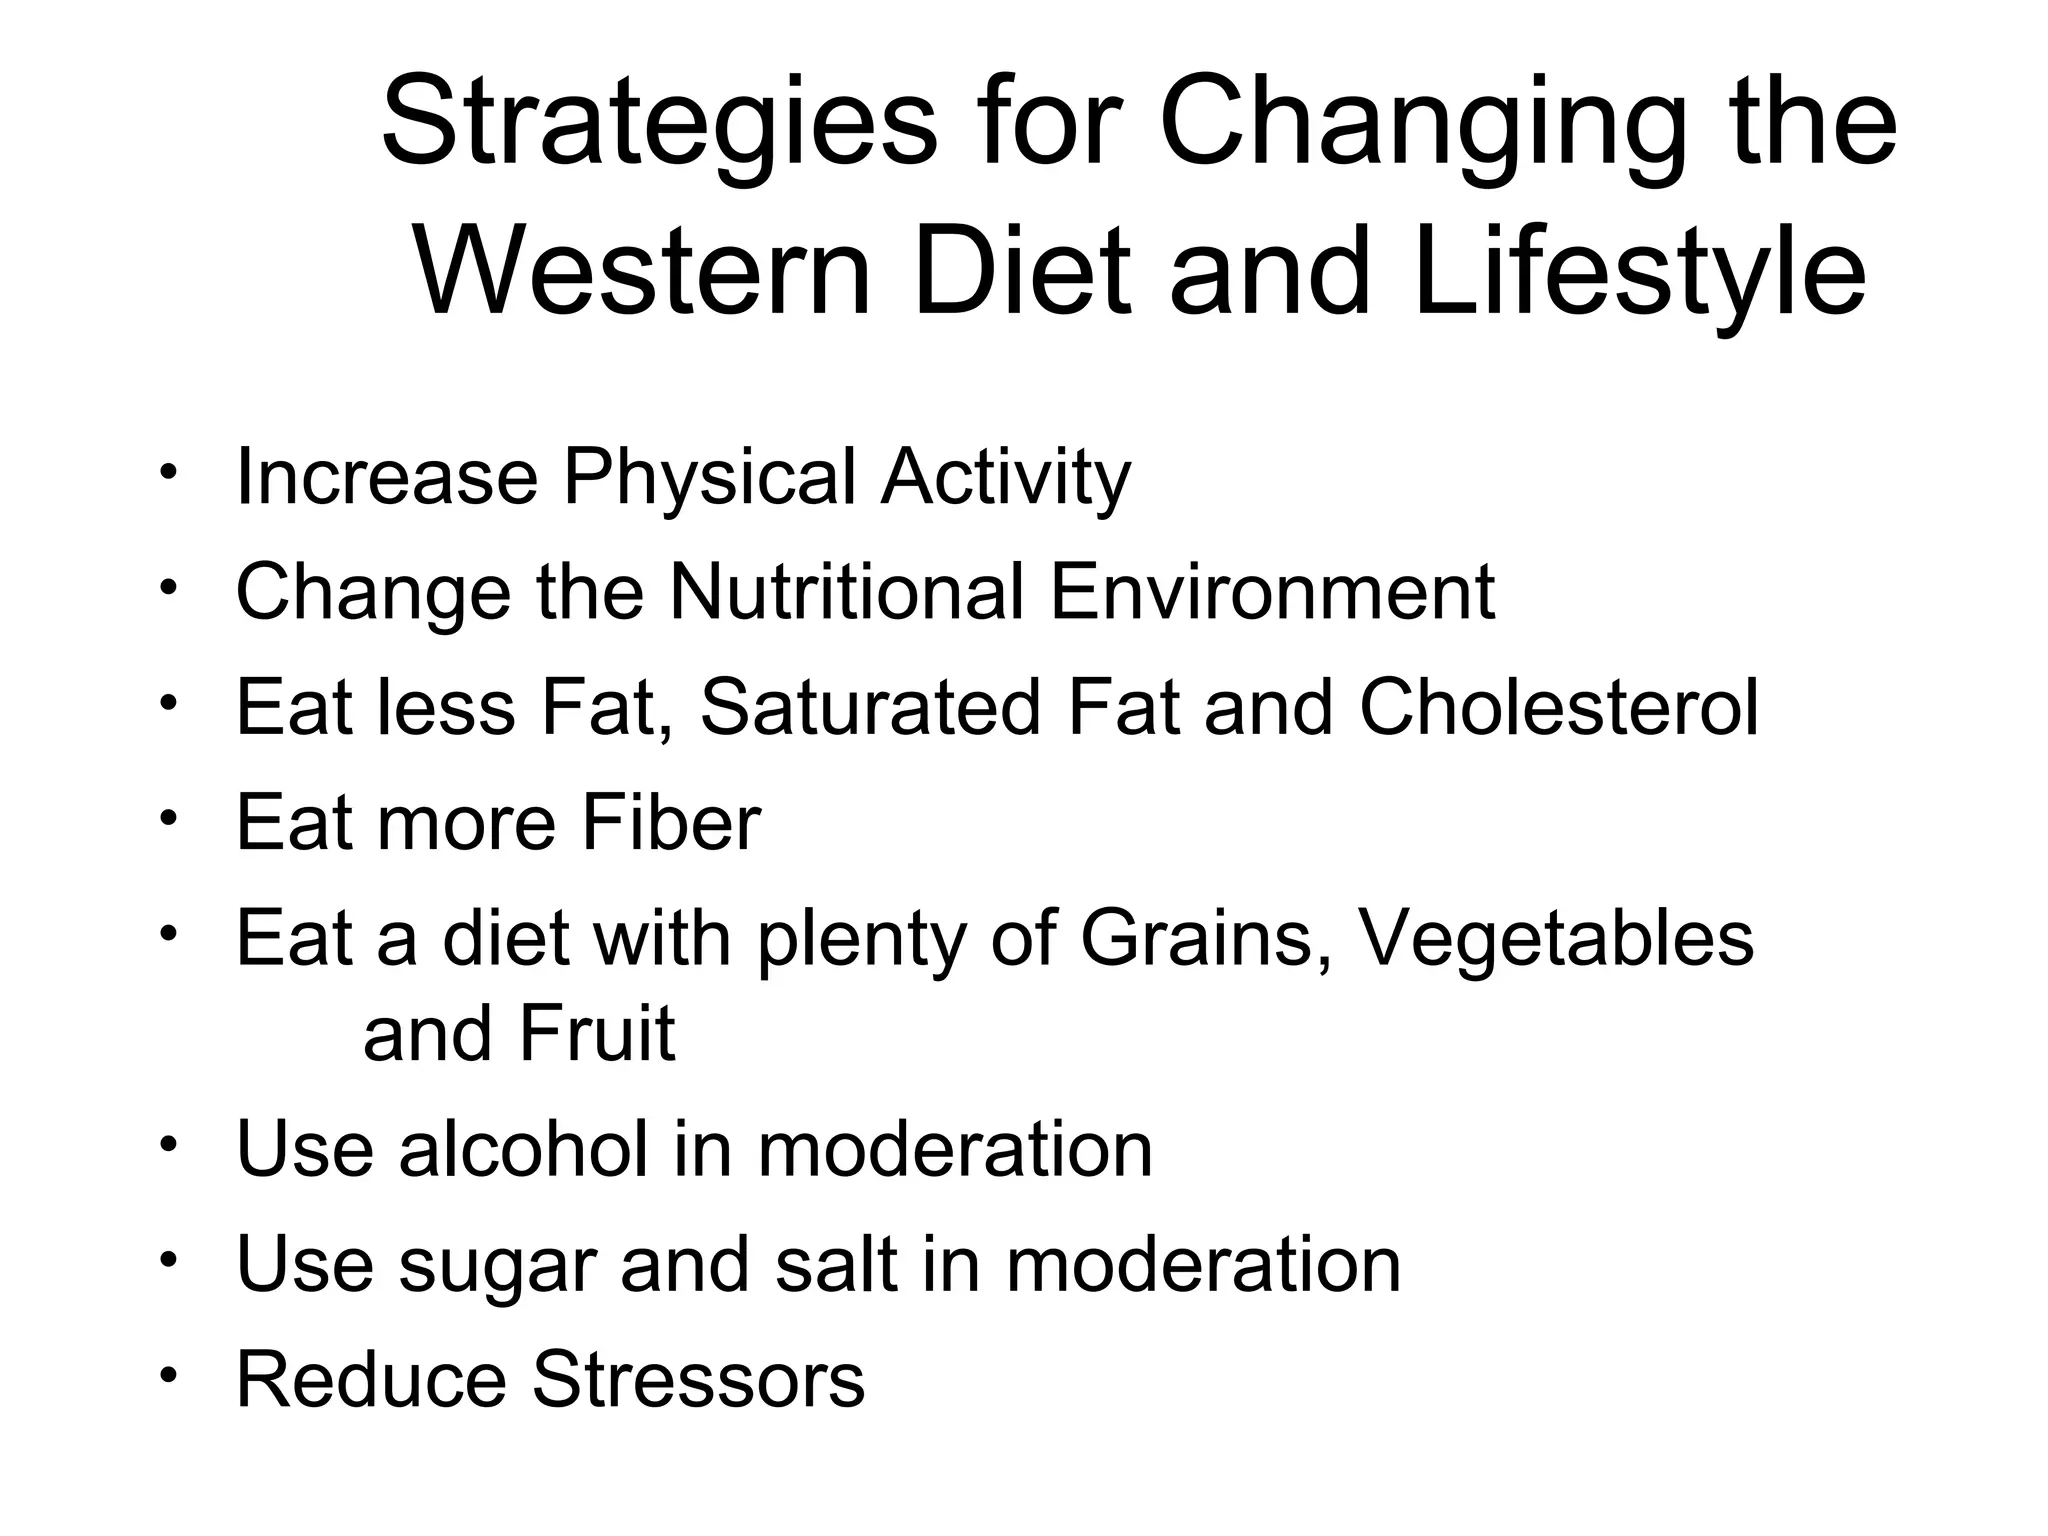
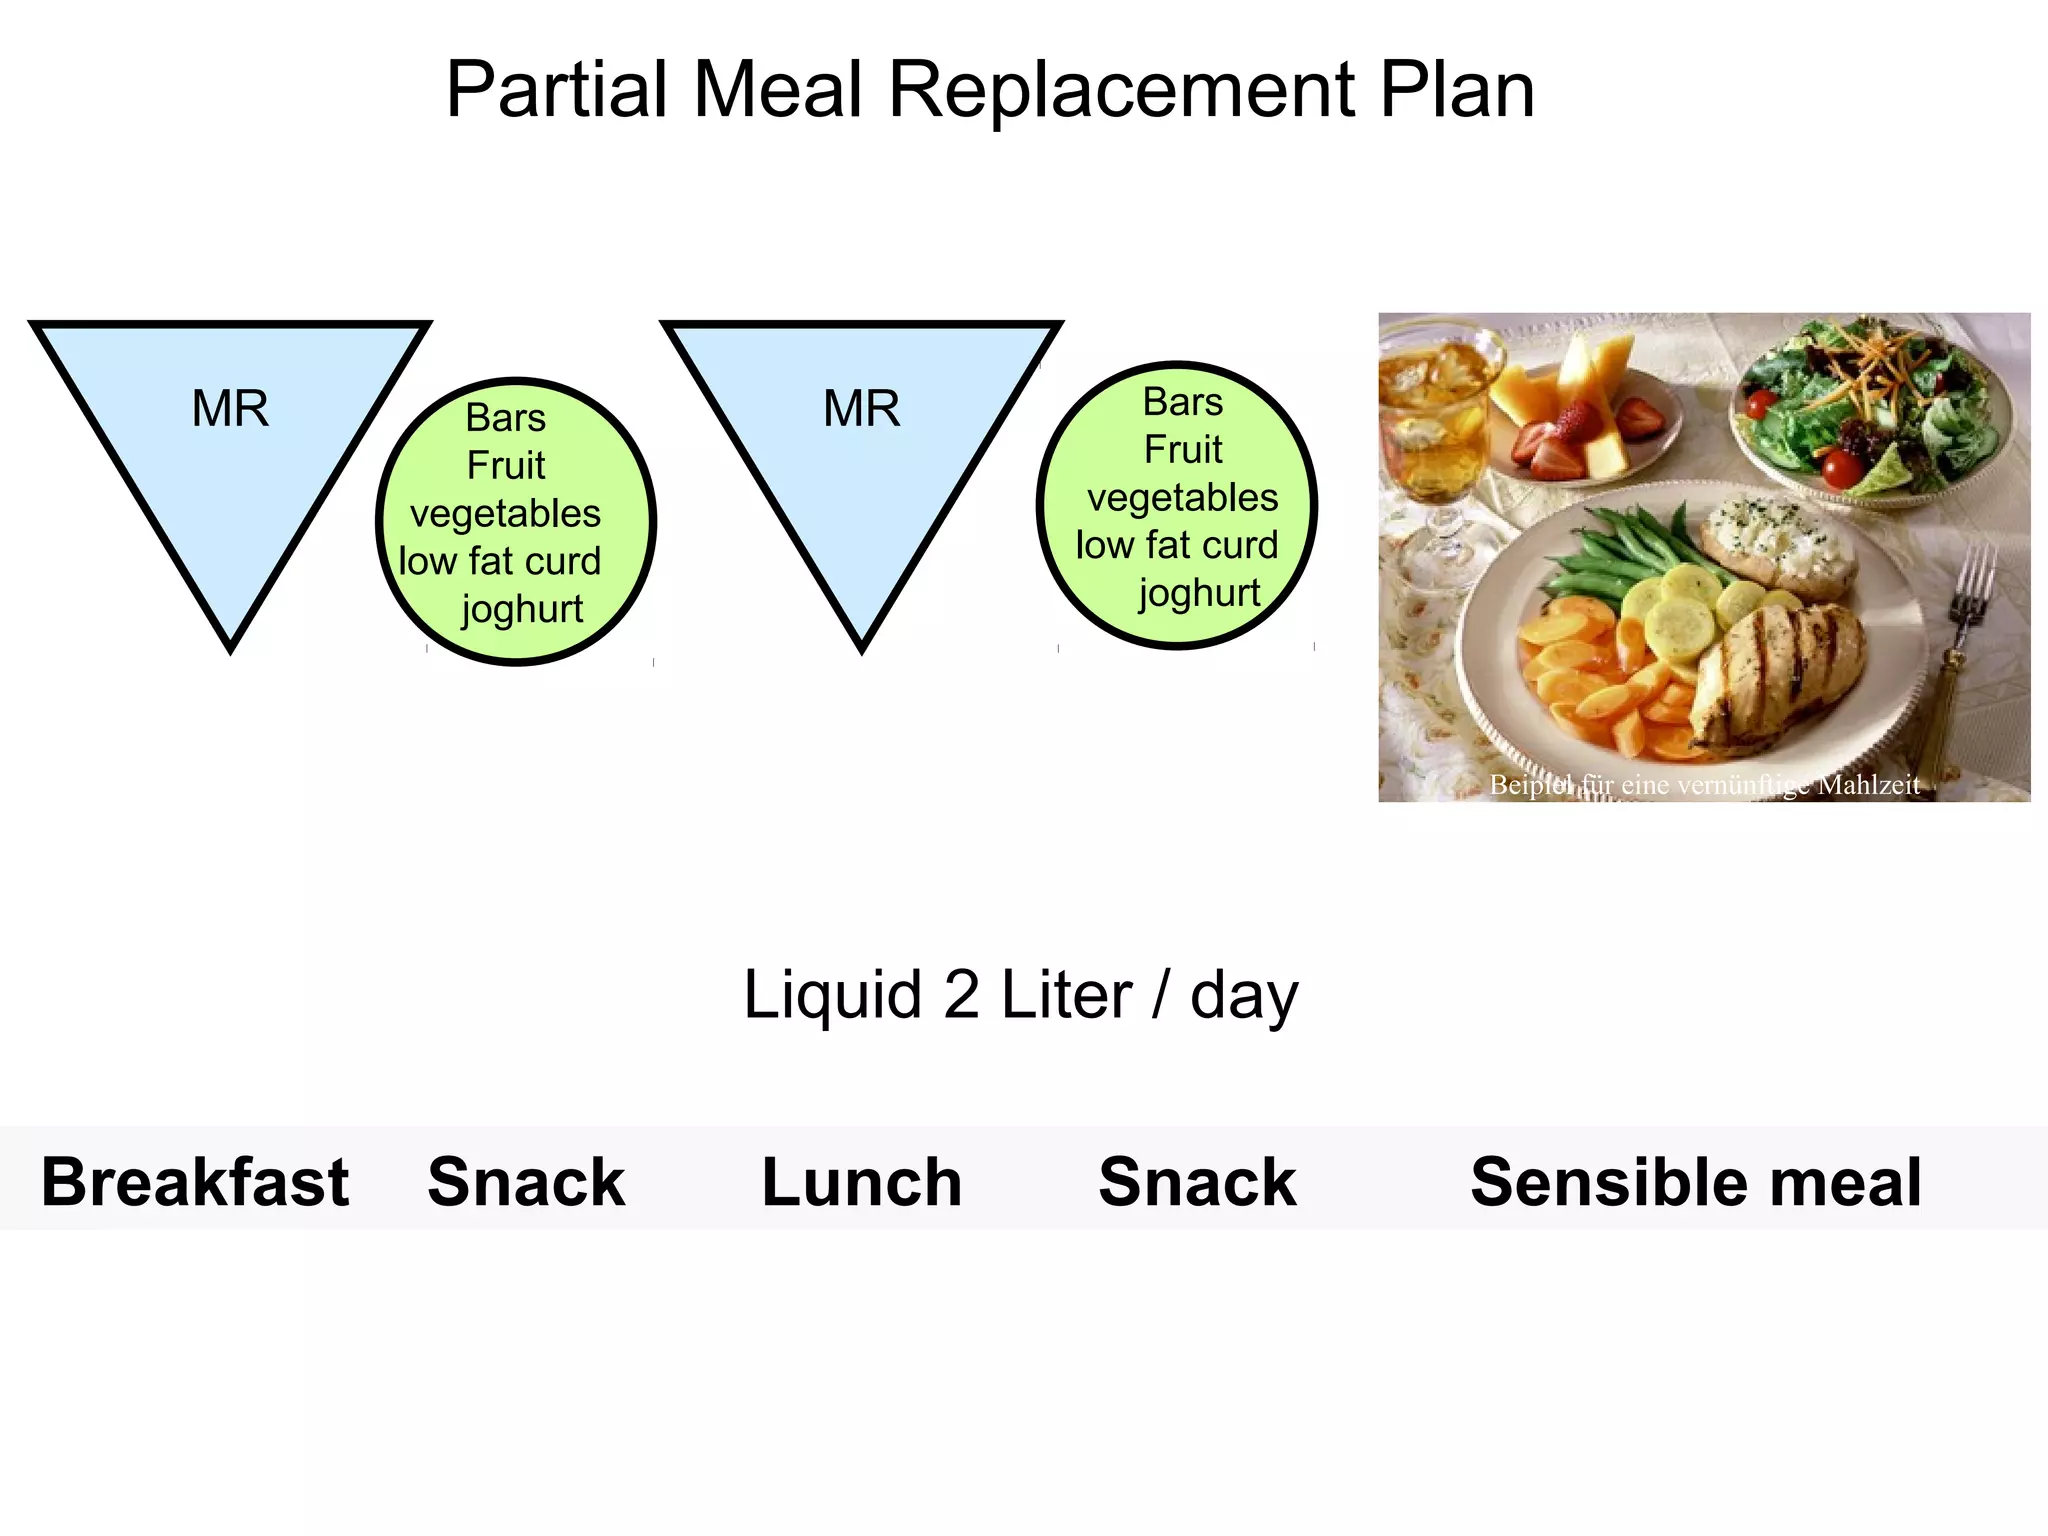
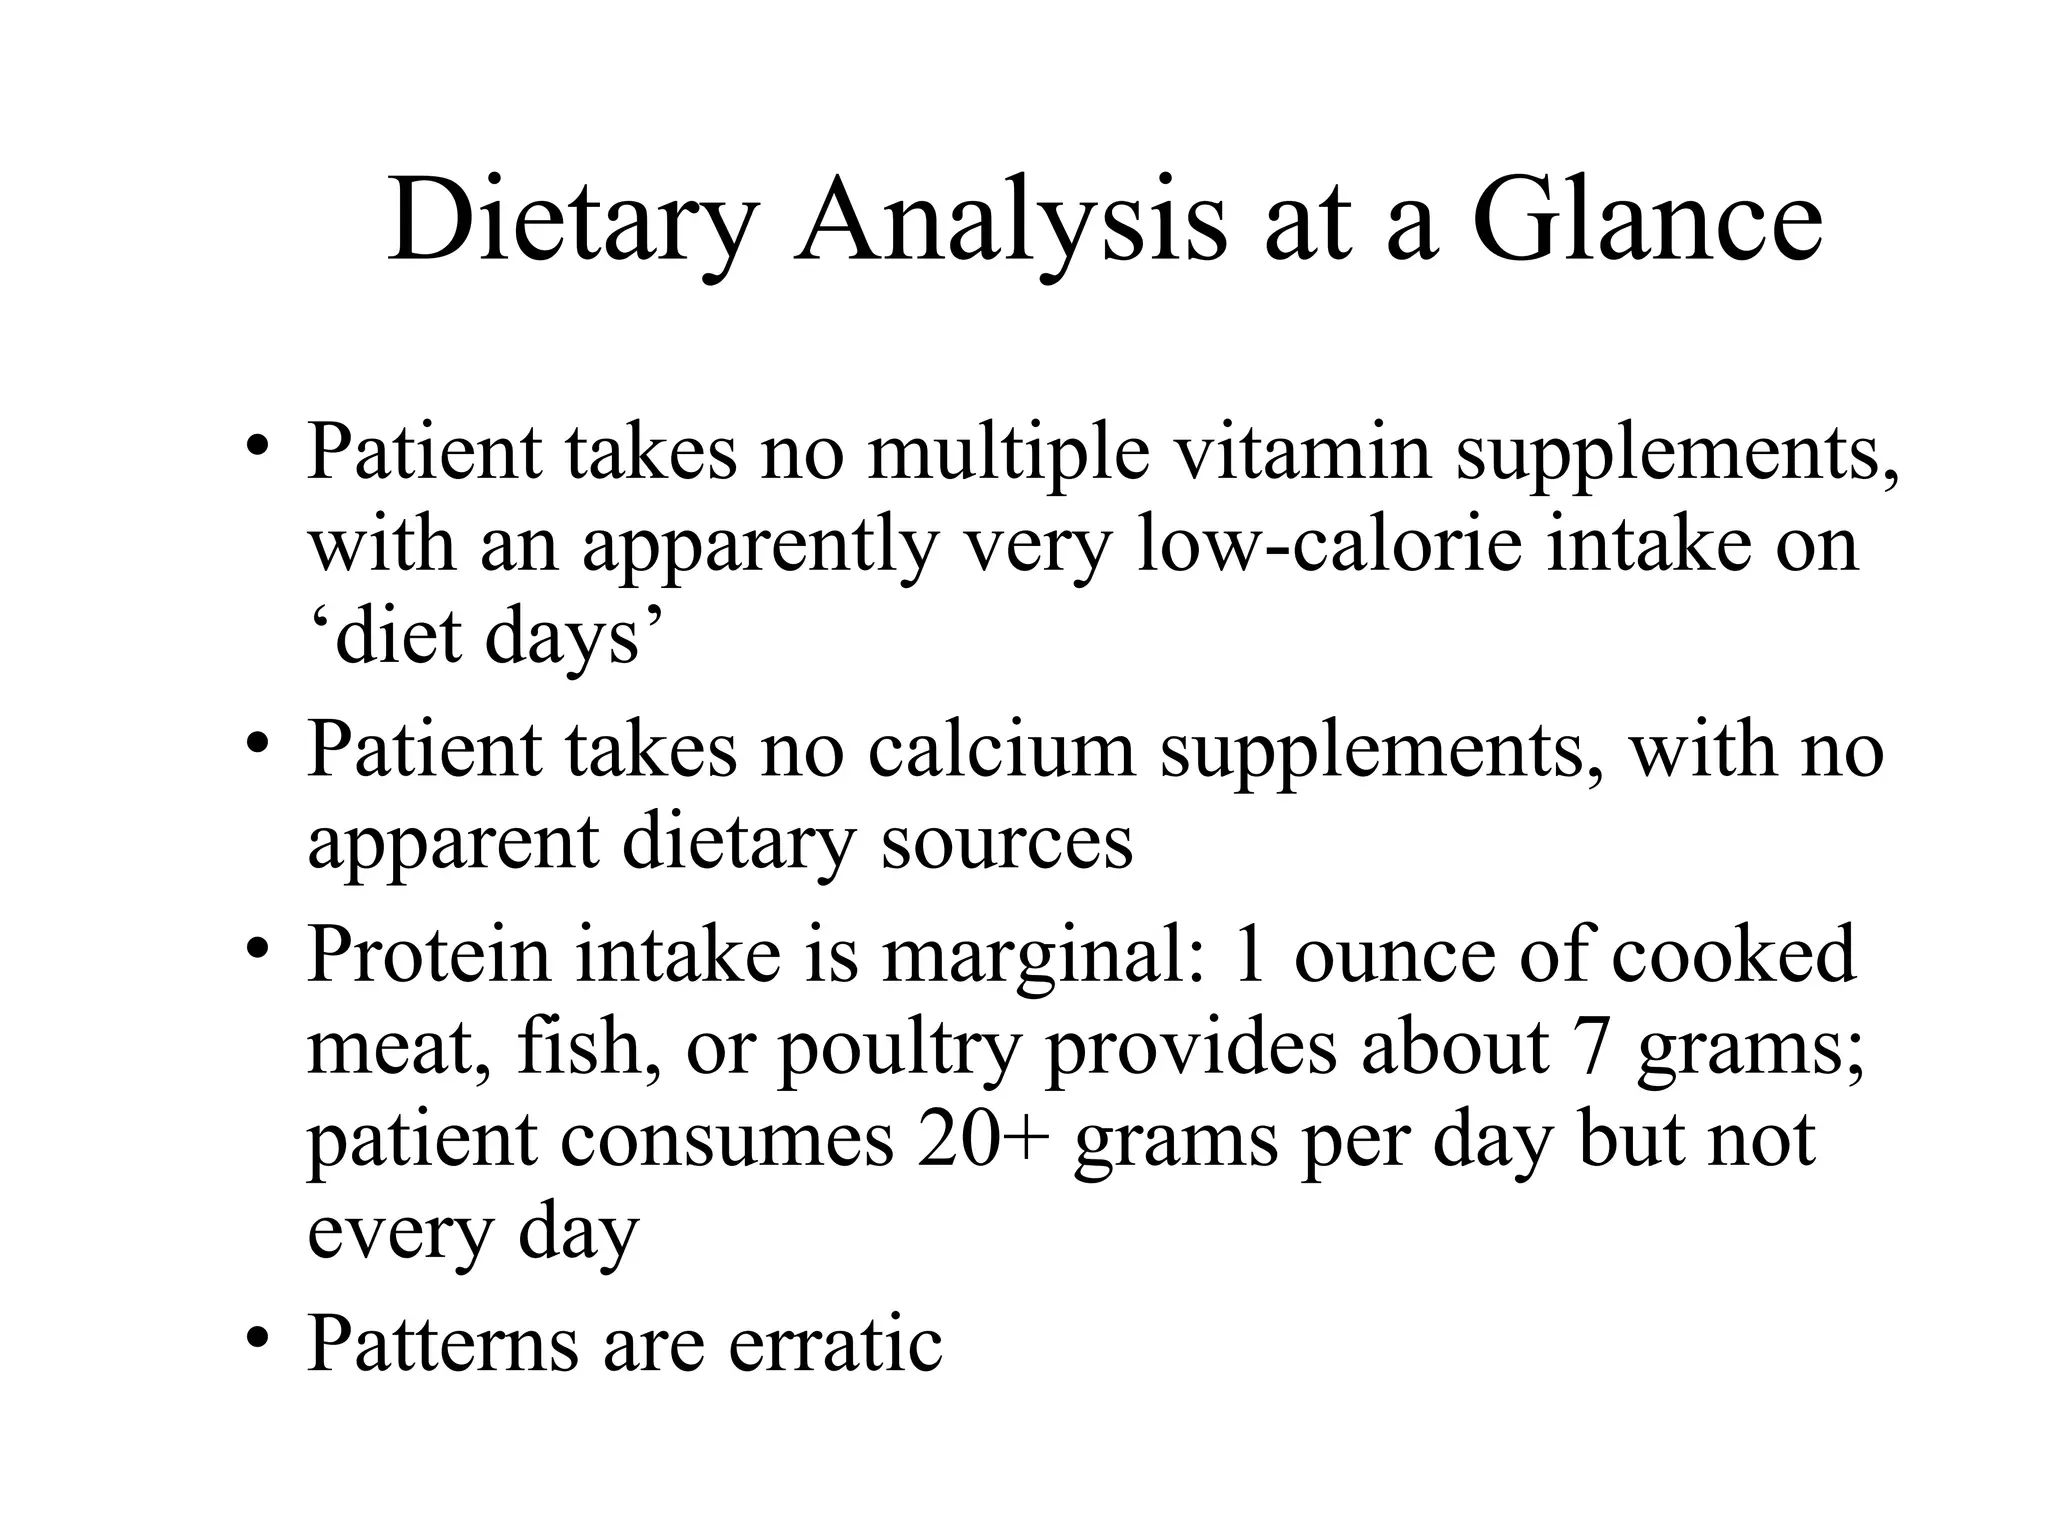
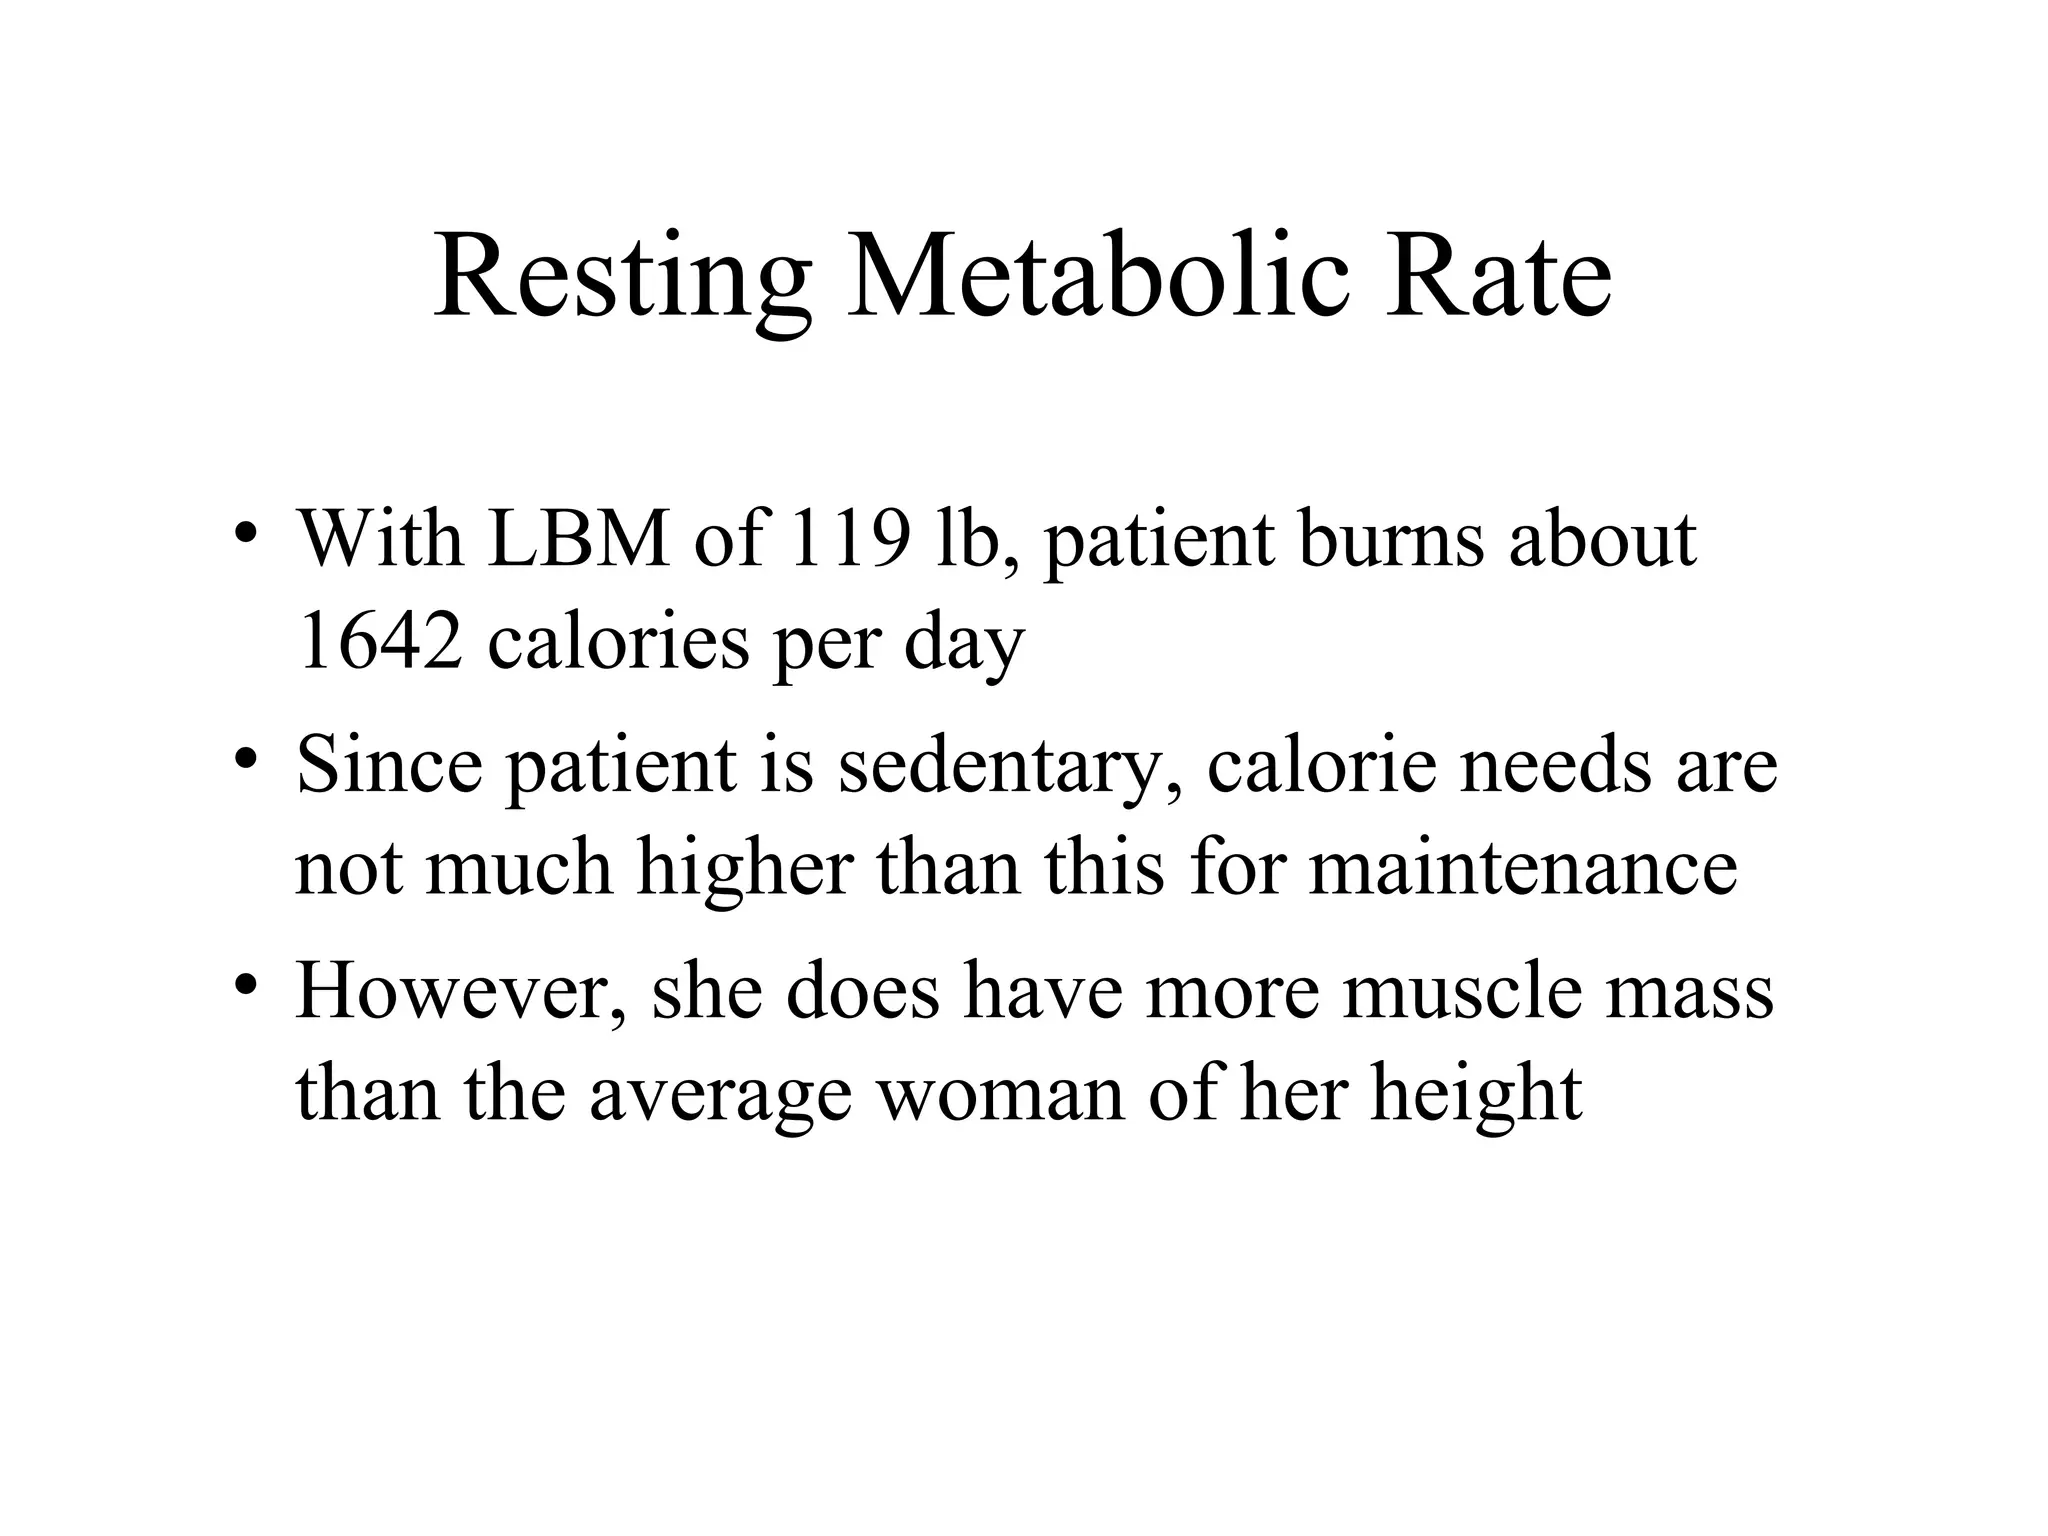
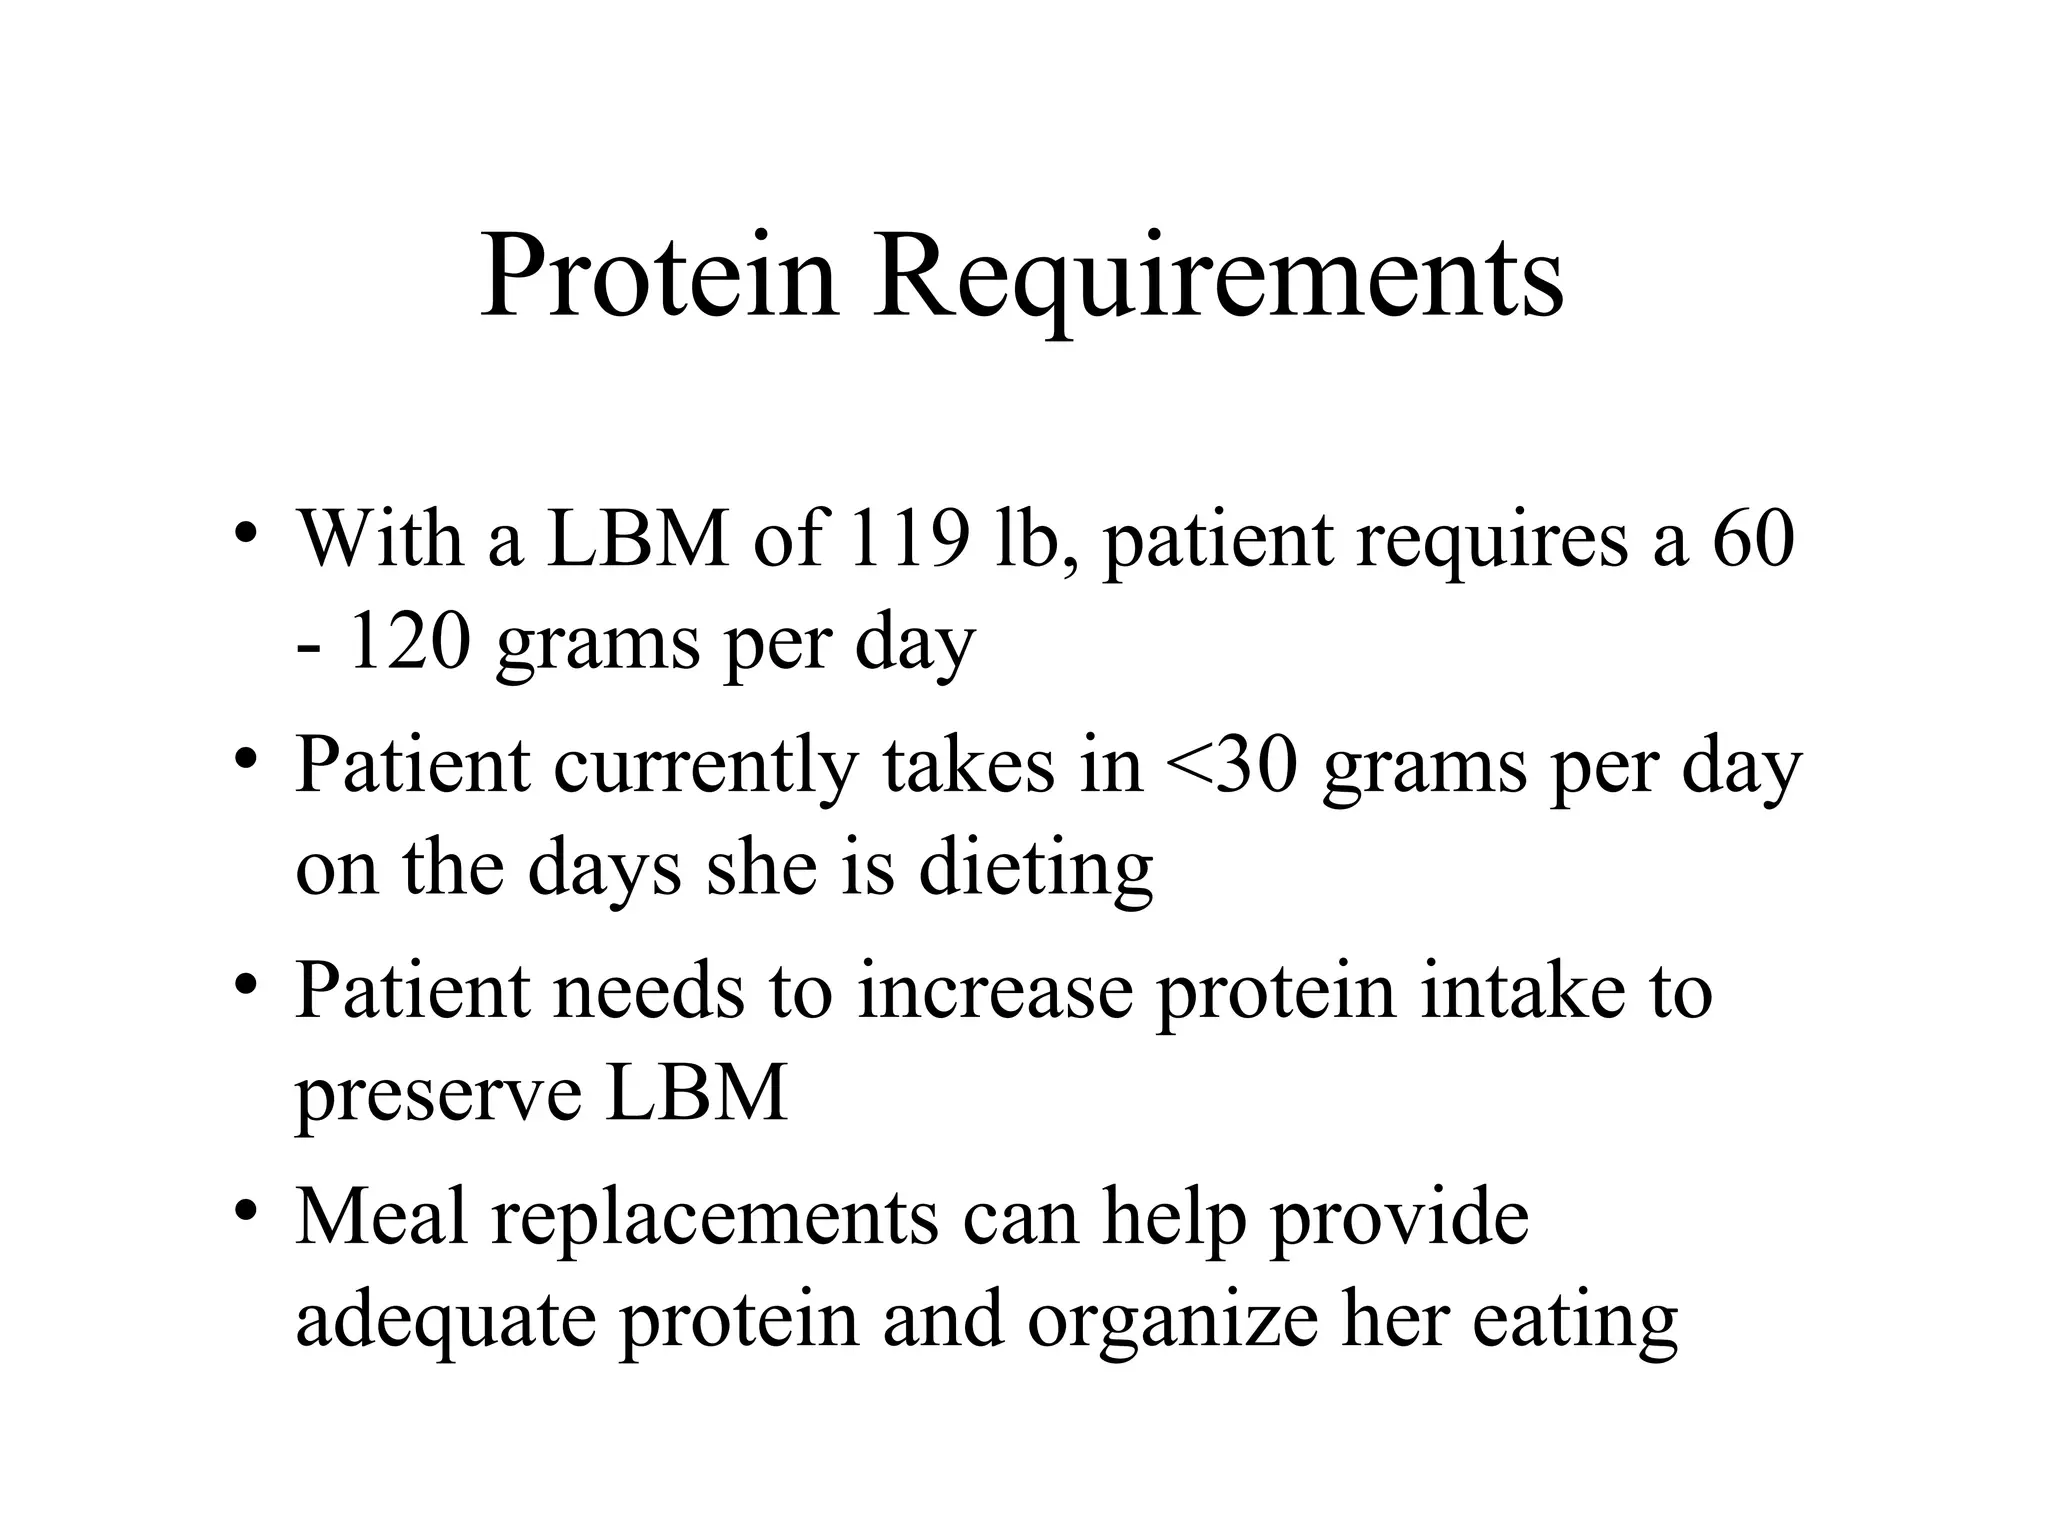
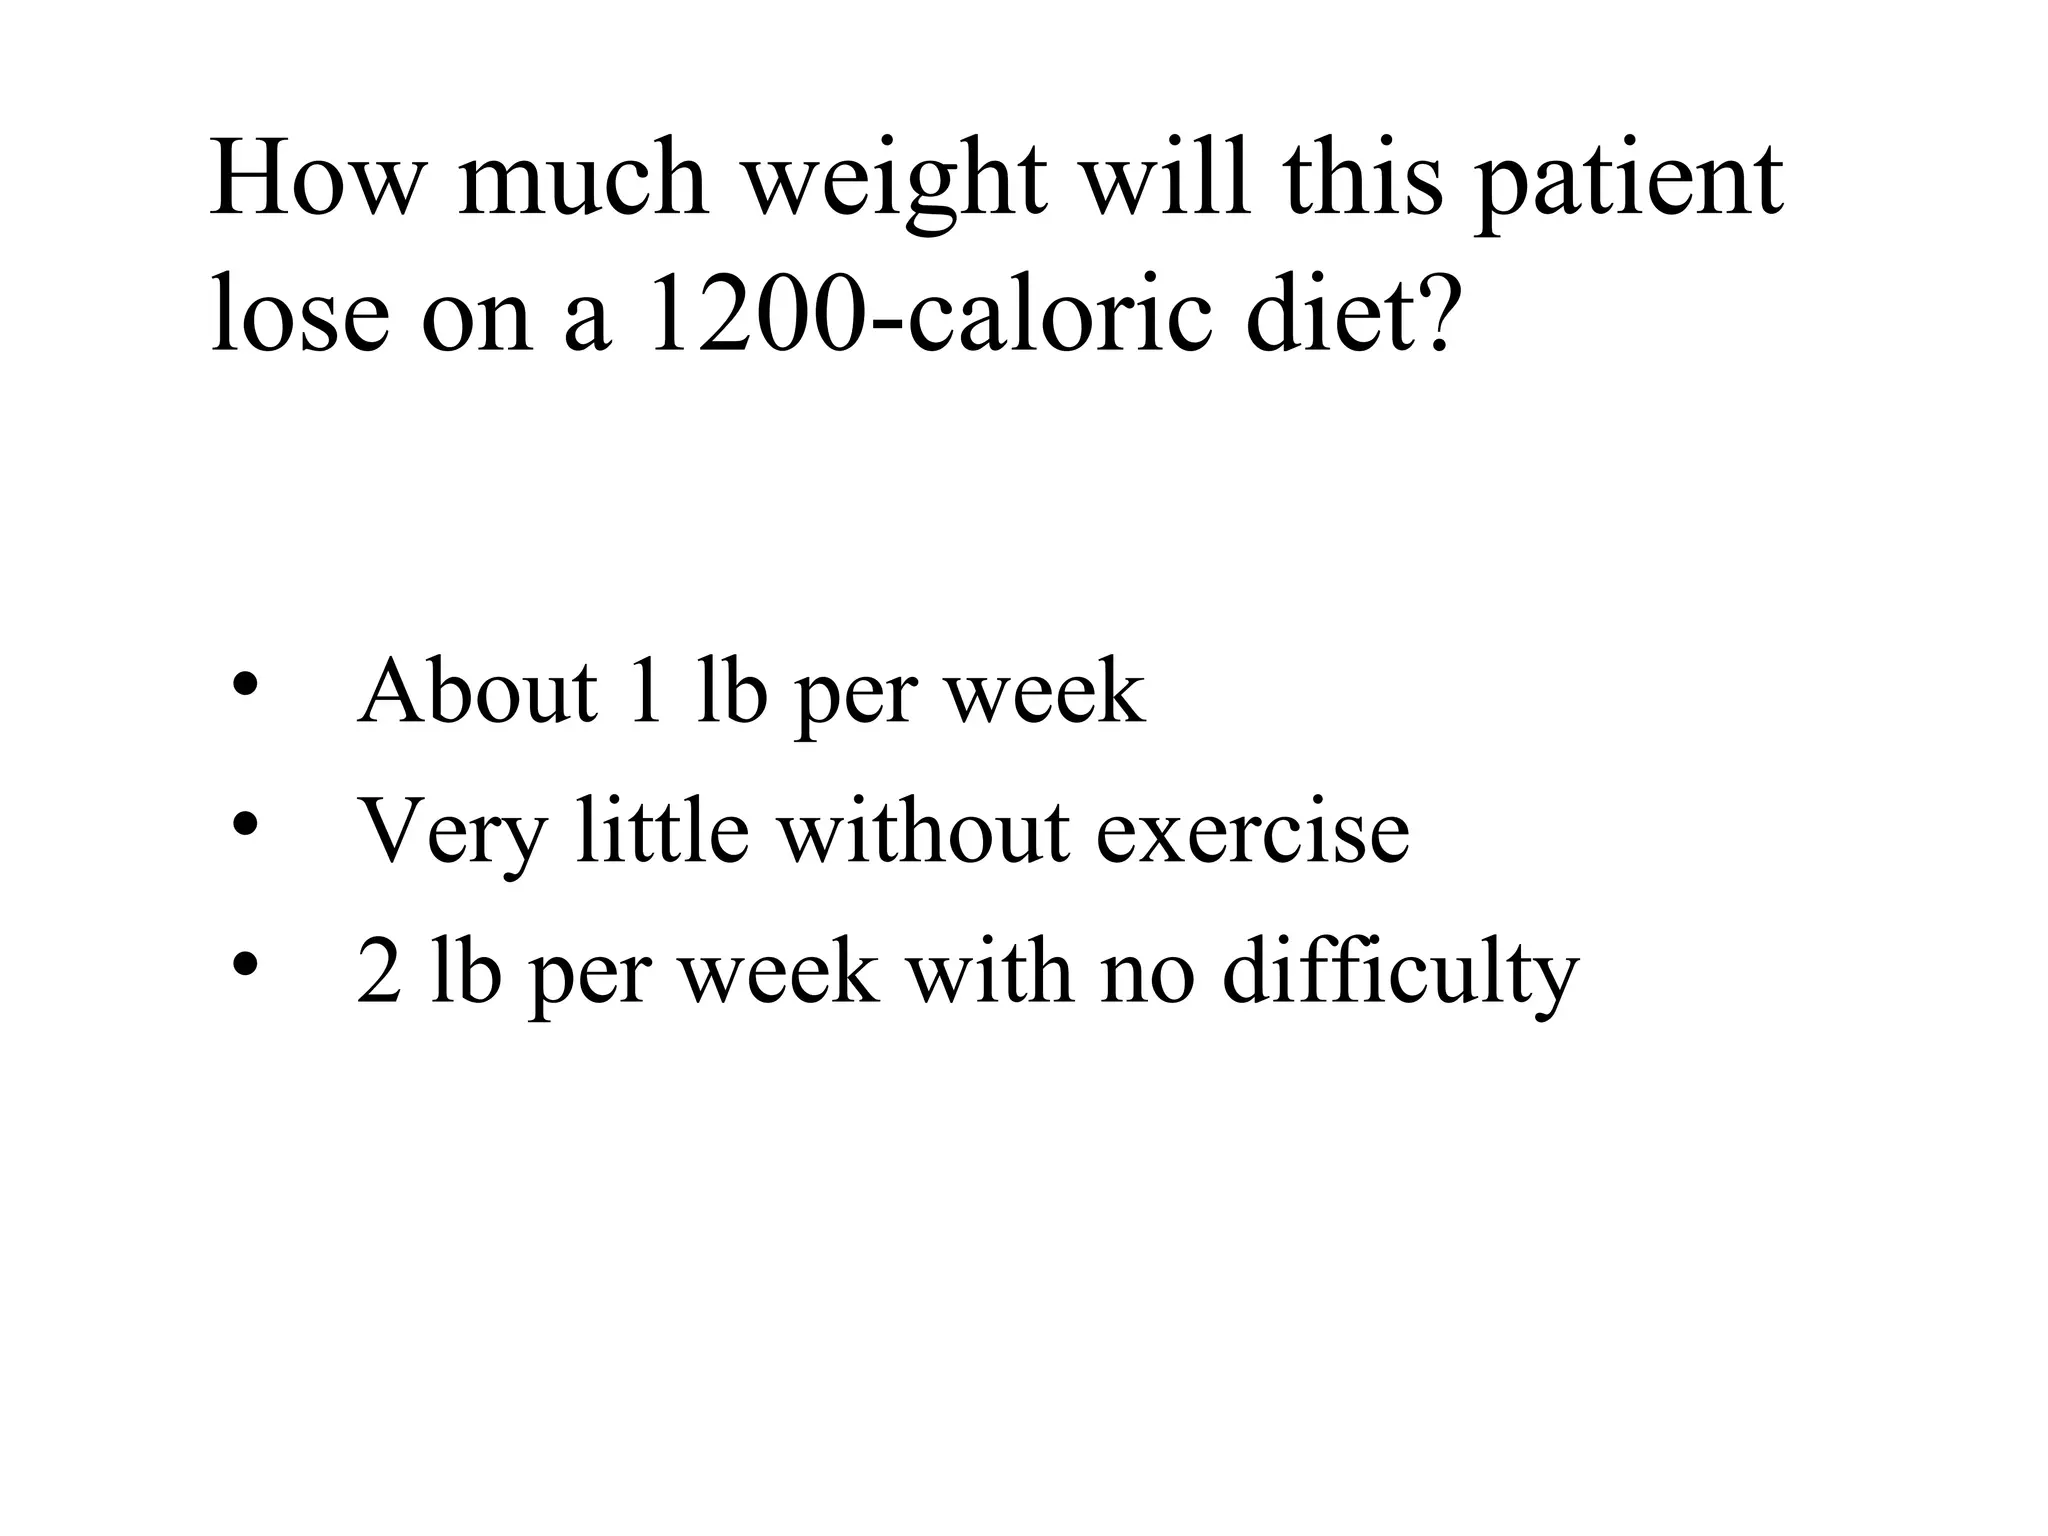
Book Paid Powai Call Girls Mumbai 𖠋 9930245274 𖠋Low Budget Full Independent H...
SCOPE School Dublin - David Heber
1. How to Assess a Patient’s Diet and
using LCD and VLCD for
Weight loss and Weight Management
David Heber, MD,PhD, FACP, FACN
Professor of Medicine and
Director, UCLA Center for Human Nutrition
2. Disclosures
Dr. David Heber has received book royalties
and travel reimbursement from Herbalife
International.
3. What Influences Food Choices
• TASTE
Sugar, Fat, and Salt
• COST
Lowest Cost Foods Have Lowest
Nutrient Density (Drewnowski)
• CONVENIENCE
Quick Serve Restaurants (Fast Foods)
Corporate Goal – a store within 7
minutes of every American
4. Our Genes Evolved on
Plant-Based Diets
Subsistence Agriculture
Food Scarcity
Adapted to Malnutrition
Globalization of the
Western Diet Pattern
Industrial Agriculture
Government Subsidies
Increased Availability
Poor Food Quality
Obesity and Chronic Diseases
5. What are the Differences ?
vs.
1. 10% Fat
2. omega-6/omega-3 ratio 3:1
3. Good Fructose with Antioxidants
Fiber, Water, Few Calories
4. Plant Proteins with lower calories
can be prepared with little fat
5. Rich in Vitamins, Minerals,
and Micronutrients
1. 35 to 50% Fat Calories
2. Omega 6/omega 3 ratio 10-30:1
3. Bad Fructose as hidden sugars with
High Calories, Low Fiber,
Low Antioxidants
4. Animal Protein with Saturated Fat
and Increased Calories
5. Poor in Vitamins, Minerals and
Micronutrients
7. Strategies for Changing the
Western Diet and Lifestyle
• Increase Physical Activity
• Change the Nutritional Environment
• Eat less Fat, Saturated Fat and Cholesterol
• Eat more Fiber
• Eat a diet with plenty of Grains, Vegetables
and Fruit
• Use alcohol in moderation
• Use sugar and salt in moderation
• Reduce Stressors
8.
9. Jennifer Anniston used this
diet to lose 18 lbs in just 1
month. She recommends
this exact diet to anyone
looking to lose body fat.
Stars such as Kim
Kardashian, Britney Spears,
and Jennifer Lopez are
known for their rapid
weight loss.
Women's Health magazine
uncovers the secret method
they used to lose up to 18
pounds of fat in 1 month.
13. Utility and Limitations of BMI
Permits population-based studies of trends in
obesity and is used for clinical guidelines.
Does not correlate well with fat mass in both over-
muscled (athletic) and under-muscled (sarcopenic)
patients.
Does not reveal differences in fat distribution
(visceral vs. subcutaneous).
Does not measure fat directly but correlates with
body fat over thousands of average patients.
At any given BMI, women have more fat than men.
14. Lean Body Mass is 70% Water and
Conducts Electromagnetic Energy,
but Fat Does Not
Magnetic Resonance Imaging (MRI)
15. EVEN IF YOU ARE THIN YOU CAN BE FAT
MRI reveals fat around the
Heart, Liver and Intestine in
Individuals with Normal
Waist Circumference
Of the women scanned
by Bell and his colleagues,
as many as 45 percent of
those with normal BMI
scores (20 to 25) actually
had excessive levels of
internal fat. Among men,
the percentage was nearly
60 percent.
16. Many of Us Lose Muscle with Age: InadequateMany of Us Lose Muscle with Age: Inadequate
Protein & ExerciseProtein & Exercise
Same Weight, Different Muscle MassSame Weight, Different Muscle Mass
21 year old Female
(BMI = 24.3 kg/m2
)
73 year old Female
(BMI = 24.5 kg/m2
)
17. Adapted from: Gallagher et al. Am J Clin Nutr 2000;72:694.
Body Mass Index (kg/m2
)
0
10
20
30
40
50
60
70
0 10 20 30 40 50 60
BodyFat(%)
Women
Men
18. Intra-Abdominal fat
Macrophage and the Innate Immune System
Pro-Inflammatory Cells Ingress Mediates the
Inflammatory State of Adipose Tissue
19. The Difference Between Muscle and Fat
Cells
Muscle Burns 30 kcal/kg
Fat Burns 6 kcal/kg
The Best Correlate of Resting Energy Expenditure is the Lean Body Mass
So When Muscle is Lost in Sarcopenic Obesity the Resting Metabolic Rate
Is Reduced and Weight Gain occurs without a large increase in food intake
21. Dynamics of protein turnover
Protein intake
100 g
gut Secreted GI
Proteins 70 g
Fecal loss
10 g
Body Protein
Turnover
250 g
Body protein stores 10,000 g
Muscle 50 g
Absorbed
160 g
Free amino acid
“pool” 100 g
Liver 25 g
Blood cells
28 g
Skin 2 g
Urinary loss 80 g
22. One Index of Protein Balance is
Nitrogen Balance
Assess balance at several
different protein intakes above
and below the estimated
requirement level to end up
with the RDA.
Nbalance = Nintake - Noutput
26. Dietary Reference Intakes (DRIDietary Reference Intakes (DRI))
Acceptable Range of Macronutrient Intake for ProteinAcceptable Range of Macronutrient Intake for Protein
Risk of
Inadequ
acy
Risk of Adverse
Affects
RDRD
AA
ULUL
acceptable
intake
Protein: 0.8 g/kg 2.5 g/kgProtein: 0.8 g/kg 2.5 g/kg
10% of kcal 35% of kcal10% of kcal 35% of kcal
27. Habitual protein intakes in the U.S.Habitual protein intakes in the U.S.
Adapted from Fulgoni, VL. Am J Clin Nutr 2008;87:1554S-1557SAdapted from Fulgoni, VL. Am J Clin Nutr 2008;87:1554S-1557S
Mean ± SDMean ± SD
28. Adapted from Fulgoni, VL. Am J Clin NutrAdapted from Fulgoni, VL. Am J Clin Nutr
2008;87:1554S-1557S2008;87:1554S-1557S
Lower
acceptable
macronutrient
distribution
Upper
acceptable
macronutrient
distribution
Error bars indicate 95th
percentile
Habitual protein intakes in the U.S.Habitual protein intakes in the U.S.
29. Daily patterns of protein intake in younger and olderDaily patterns of protein intake in younger and older
adultsadults
BkftBkft LunchLunch DinnerDinner SnackSnack TotalTotal
Protein intake (g/d)Protein intake (g/d)
YoungerYounger 11.111.1 25.425.4 43.043.0 8.88.8 88.388.3
OlderOlder 13.313.3 20.220.2 35.835.8 7.27.2 76.576.5
Protein intake (% of energy)Protein intake (% of energy)
YoungerYounger 11.811.8 16.116.1 18.818.8 7.57.5 14.814.8
OlderOlder 13.113.1 16.816.8 18.718.7 8.18.1 15.315.3
Energy intake (kcal/d)Energy intake (kcal/d)
YoungerYounger 377377 631631 914914 469469 23912391
OlderOlder 405405 479479 766766 355355 20052005
Adapted from Howarth, NC. Int J Obes 2007;31:675-684
30. Meal Patterns:Meal Patterns:
Breakfast
~10 g
protein
Lunch
~20 g
protein
Dinner
~60 g
protein
Unbalanced Protein Distribution
response range for
protein synthesis
(skeletal muscle)
31. Muscle Protein Balance
Balance
Time
Meal Meal Meal
Phillips. Nutrition ‘04
Protein accretion
Protein loss
Protein synthesisProtein synthesis
Protein breakdownProtein breakdown
35. Maintenance of Lean body mass with
higher protein intake
Time course changes for the ratio of loss of body fat compared with loss of lean body
mass (fat/lean) during weight loss for adult women consuming diets with a carbohydrate
(CHO)/protein ratio of 3.5 (CHO Group) or 1.4 (Protein Group).
Layman DK et al. J. Nutr. 133:411-417, 2003
fat as % of loss:
CHO = 68%
PRO = 80%
36. Bars
Fruit
vegetables
low fat curd
joghurt
Liquid 2 Liter / day
Breakfast Snack Lunch Snack Sensible meal
MR MR
Beipiel für eine vernünftige Mahlzeit
Bars
Fruit
vegetables
low fat curd
joghurt
Partial Meal Replacement Plan
37. Four-year weight losses in the Look AHEAD Study:
Factors associated with long-term success in
subjects with T2D
Wadden et al. Obesity (Silver Spring). 2011;19(10):1987-1998
DSE: Diabetes Support and Education group
ILI: Intensive Lifestyle Intervention group
Dietary intervention included the intensive use of MR and structured meal plans: The first 4
months 2 MR and 2 SR per day, the following months 5-12, 1 MR and 1 SR per day
38. Wadden TA et al. Obesity Spring) 2009;17(4):713-22
One-year weight losses in the Look AHEAD Study:
Factors associated with success
Percentage reduction in initial weight at 1 year based on quartile of meal
replacement products used. The numbers within each bar shows the mean number
of products used in that quartile.
39. Fruit & Vegetable Intake
0
1
2
3
4
5
6
baseline yr 1 yr 2
* * p<0.05
Numberof
servings/day
Ashley et al Obesity Research 9:S312-S320 (2001)
Control Control +
MR
40. •Provides fat and lean percentages
•Predicts Basal Metabolic Rate
•Can calculate protein needs based on
Lean Body Mass (0.5 - 1.0 gm/ pound LBM)
•Helps establish target weight
Bioelectrical Impedance Analysis
41. Body Composition Test Summary
Sex: Female Height: 64 inches
Age: 47 Weight: 165
TEST RESULTS
Percent Body Fat: 38 %
Fat Body Weight: 62.7 lbs
Lean Body Weight: 102.3 lbs
Basal Metabolic Rate 1412 kcal/day
42. Building the Diet
• Body composition analysis provides Resting
Metabolic Rate (RMR); good first estimate for
calories needed for weight loss
• Body composition determines lean body mass;
up to 1 gram of dietary protein/pound of LBM
• For most overweight women, 1200 calorie diet
with 75 gm protein per day good starting point;
1500 calories and 100 gm protein for men
• Build diet around protein, fruits, vegetables; add
whole grains as calories allow
43. Selecting a Meal Replacement
• Calories: 300 or fewer
• Protein: 15 grams or more
• Fat: 5 grams or fewer
• Vitamin and Mineral fortified drink or bar
• Fiber: at least 5 grams
• Vary flavors, textures (drinks, bars, meals
• Patients design and tailor their own shake
based on protein needs and tastes
44. Building the Diet:
Protein First
• If possible, determine lean body mass by
bioelectrical impedance; diet should supply up to 1
gram of lean protein per pound of lean body mass
• If LBM reading not available, most women will
need 75-100 grams of protein per day
• Aim for two meal replacements per day, providing
approximately 25 grams protein each to start
45. Customizing Protein Intake
• Lean Body Mass obtained from body
composition analysis
• Select protein level in closest increment of 25
grams
• Use flavored soy or soy/whey protein powder
as basis for shake
• Mix shake with milk or soy milk
• Customize with additional plain protein
powder for increased protein/satiety
46. Example
• Flavored soy protein powder + nonfat milk
= approximately 25 grams protein per shake
(15 + 10 grams)
• Two shakes per day = 50 grams protein
• Protein servings in 25 gram units
• Patient requiring 100 grams per day will
need two additional units
47. Best Protein Sources
(3-4 units per day; 135 calories average)
Food Item One Unit Calories Protein (gm)
Egg whites 7 whites 115 25
Nonfat cottage cheese 1 cup 140 28
Soy Protein Powder, flv 1 ounce 140 15 (varies
Soy Protein Powder, plain 1 ounce 110 20-25
Soy Cereal ½ cup 140 25 (varies)
Turkey Breast 3 oz, cooked weight 135 25
Chicken Breast 3 oz, cooked weight 140 25
Lean Red Meat 3 oz, cooked weight 145-160 25
Ocean-Caught Fish 4 oz, cooked weight 130-170 25-31
Shrimp, crab, lobster 4 oz, cooked weight 120 22-24
Tuna 4 oz, water pack 145 27
Scallops 4 oz, cooked weight 135 25
Soy Hot Dog 2 links 110 22 (varies)
Soy Ground Round 3/4 cup 120 24
Soy Burgers 2 patties 160 26
Tofu, firm 1/2 cup 180 20 (varies)
48. Add Vegetable Servings
3+ per day, about 55 calories
Food Item Portion Calories Fiber
Cooked Vegetables
Acorn Squash, baked 1 cup 85 6
Artichoke 1 medium 60 6
Asparagus 1 cup 45 4
Beets, cooked 1 cup 75 3
Broccoli, cooked 1 cup 45 5
Brussels Sprouts 1 cup 60 4
Cabbage, cooked 1 cup 35 4
Cauliflower, ckd 1 cup 30 3
Carrots, cooked 1 cup 70 5
Celery, diced 1 cup 20 2
Chinese Cabbage, ckd 1 cup 20 3
Collard greens, ckd 1 cup 50 5
49. Add Fruits 3+ per day,
about 70 calories
Food Item Portion Calories Fiber
Apricots 3 whole 50 3
Avocado ¼ average fruit 80 2
Blackberries 1 cup 75 8
Blueberries 1 cup 110 5
Cantaloupe 1 cup cubes 55 1
Grapes 1 cup 115 2
Honeydew 1 cup cubes 60 1
Kiwi 1 large 55 3
Mango ½ large 80 3
Nectarine 1 large 70 2
Orange 1 large 85 4
Orange Juice ½ cup 50 0
Papaya ½ large 75 3
Peach 1 large 70 3
50. Add Grains 1-2 per day,
average 100 calories
STARCH/
GRAIN
Serving size Calories Fiber (grams) Protein
(grams)
Cooked
Beans
½ cup,
cooked
115-140 5-7 7
Brown Rice ½ cup,
cooked
110 2 3
Lentils ½ cup,
cooked
115 8 9
Whole grain
pasta
½ cup,
cooked
85 2 3
Shredded
Wheat, bite
size
1 cup 110 4 5
High Fiber
Bran Cereal
2/3 cup 90-120 15-18 4
Oatmeal 1 cup, cooked 130 4 6
Bread, Whole
Grain
1 slice 100 3 3-5
51. Sample Weight Loss Diet Plan -
1200 Calories
BREAKFAST
High Protein Meal Replacement + fruit or
1 cup nonfat yogurt or cottage cheese + fruit or
6 egg white omelet + fruit
LUNCH
Meal Replacement + fruits and vegetables or
3-4 ounces fish, poultry breast or soy protein +
salad, vegetables, and fruit
52. Weight Loss Diet Plan
PM SNACK
1 Fruit serving
DINNER
6 ounces fish, poultry breast or soy
protein substitute
1 grain serving
Salad + steamed vegetables
Fruit
53. Case Study
• Patient is a 42-year-old woman
• Married with two teenage children
• Works full time
• Complains of fatigue, low back pain
• Too tired most of the time to exercise
• Has sedentary job
54. Case Study, continued
• Vital signs: afebrile, BP 140/90, P 72
• Wt: 170 lb Height: 62”
• BMI = 31.5
• Waist circumference = 37"
• Lab studies:
– Total Cholesterol 210
– Triglycerides160
– HDL 32
– FBS 115 mg/dL
55. Body Composition Results
• Weight 170 pounds, 62” tall
• Fat Mass: 51 pounds; 30.1% body fat
• Lean Body Mass: 119 pounds
• Estimated RMR: 1642 cal/day
• Target weight: 145 lb for body fat of
22%
56. Is this target weight too high?
• Yes, she should weigh no more
than130 lb at a height of 5'2" for a BMI
of 25
• No, she has increased muscle mass
compared to other women her age; if
she maintains this lean body mass
with concomitant fat loss, she will
have a normal BMI at 145 pounds
57. Dietary History
• Patient relates frequent dieting to keep weight
in check
• When dieting, she skips breakfast and eats
mostly vegetables and small amounts of protein
or pasta for entree
• No vitamin supplements
• When not dieting, she eats pizza, frozen yogurt,
and snacks on nuts, cookies, chips
• Drinks 3 regular sodas a day
58. Typical “Diet” Day
• Breakfast: none, or black coffee and half a
grapefruit
• Lunch: large green salad with diet dressing
• Snack: piece of fruit
• Dinner: 2 cups of steamed vegetables, large
salad with diet dressing, 1 cup pasta or
small chicken breast, fruit for dessert
59. What “red flags” do you see in her
dietary history?
• No multiple vitamin supplements
• Low protein intake
• High sugar, high fat foods when not
dieting
• All of the above
60. Dietary Analysis at a Glance
• Patient takes no multiple vitamin supplements,
with an apparently very low-calorie intake on
‘diet days’
• Patient takes no calcium supplements, with no
apparent dietary sources
• Protein intake is marginal: 1 ounce of cooked
meat, fish, or poultry provides about 7 grams;
patient consumes 20+ grams per day but not
every day
• Patterns are erratic
61. Resting Metabolic Rate
• With LBM of 119 lb, patient burns about
1642 calories per day
• Since patient is sedentary, calorie needs are
not much higher than this for maintenance
• However, she does have more muscle mass
than the average woman of her height
62. Protein Requirements
• With a LBM of 119 lb, patient requires a 60
- 120 grams per day
• Patient currently takes in <30 grams per day
on the days she is dieting
• Patient needs to increase protein intake to
preserve LBM
• Meal replacements can help provide
adequate protein and organize her eating
63. How much weight will this patient
lose on a 1200-caloric diet?
• About 1 lb per week
• Very little without exercise
• 2 lb per week with no difficulty
64. Recommendations for This Patient
• Needs adequate dietary protein to maintain LBM:
recommend 100 grams per day with 2 meal
replacements per day
• Patient needs to begin strength training to build
muscle and cardiovascular exercise for endurance
and to boost calorie expenditure
• Each pound of muscle burns 14 calories; if she can
build 10 lb of muscle, she can maintain weight on
140 more calories per day
65. Additional Recommendations
• Advise patient to use meal replacements
and portion-controlled meals to provide
proper nutrition with defined calories
• Counsel on avoidance of ‘trigger foods’
– Nuts
– Mayonnaise, salad dressings, butter, margarine
– Cheese and cheese pizza
– Ice cream and frozen yogurt
– Red meat and fatty fish
– Cakes, pies, pastry, and candy
66. Partial Meal Replacement Plan
A randomized controlled trial
Patients who were transferred to the University Obesity Center for obesity
therapy. 1200-1500 kcal/day, 20E% protein, 50-60E% CH, 20-30E% fat for
all patients.
Weight loss phase:
3 months:
partial meal replacement plan with 2 meal replacements, two snack
replacements and 1 sensible meal/day
versus
conventional diet with 3 meals and 2 snacks
Weight maintenance phase
4 years:
Both diet groups had 1 meal replacement and 1 snack replacement and 2
sensible meals/day
67. Mean Percent Weight Loss Profiles
month
%weightlossfrombaseline
0 10 20 30 40 50
-15-10-50
Group A
Group B
Flechtner-Mors, Obes Res 2000
Partial meal replacement plan
Weight loss and weight maintenance
2 Shakes as meal
replacement
1 Shake as meal replacement
Percentagereductionofinitialweight
Conventional diet
Flechtner-Mors M et al. Obes Res 2000
Months
1 Shake as meal replacement
68. • Weight loss:
Two daily Meal Replacements were more effective for
weight loss than a traditional meal plan using the same
prescribed energy content.
• Weight maintenance:
One daily Meal Replacement and Snack Replacement
was effective in maintaining weight loss for a period of 4
years.
Partial meal replacement plan
Results
69. Why diets with incorporated meal replacements
improve weight loss
and weight maintenance
• Easier to plan meals
• Reduces barriers to dietary adherence
• Helps instill regular eating patterns
• May increase accuracy of calorie estimation and
estimation of portion size
• Provides a simple guide for healthy nutrition
• Positively affects self-monitoring
• Facilitates making less deleterious food decisions
Editor's Notes
Body mass index (BMI) represents the relationship between weight and height. It is calculated as weight (in kilograms) divided by height (in meters squared). As shown in this figure, which contains data from 613 men and 876 women, BMI correlates with percent body fat mass in a curvilinear fashion in both men and women [1,2]. The relationship between BMI and percent body fat is sex and age dependent; at an equivalent BMI, women and older persons have a higher percent body fat than men and younger persons. In addition, persons who have a large muscle mass can have an “obese” BMI despite having a normal amount of body fat, while those with excess adiposity and reduced muscle mass can have a “normal” BMI. 1. Gallagher D, Visser M, Sepulveda D, et al. How useful is body mass index for comparison of body fatness across age, sex, and ethnic groups? Am J Epidemiol 1996;143:228-239. 2. Gallagher D, Heymsfield SB, Heo M, et al. Healthy percentage body fat ranges: an approach for developing guidelines based on body mass index. Am J Clin Nutr 2000;72:694-701.
Behavioral strategies PA >175 min/week, group sessions and individual meetings, goal of weight loss > 10% was given
Quartile of visits and PA similarly were related to initial weight loss
*
In a systematic evaluation of randomized controlled trials utilizing PMR plans for weight management suggests that these types of interventions can safely and effectively produce significant sustainable weight loss and improve weight related risk factors of disease