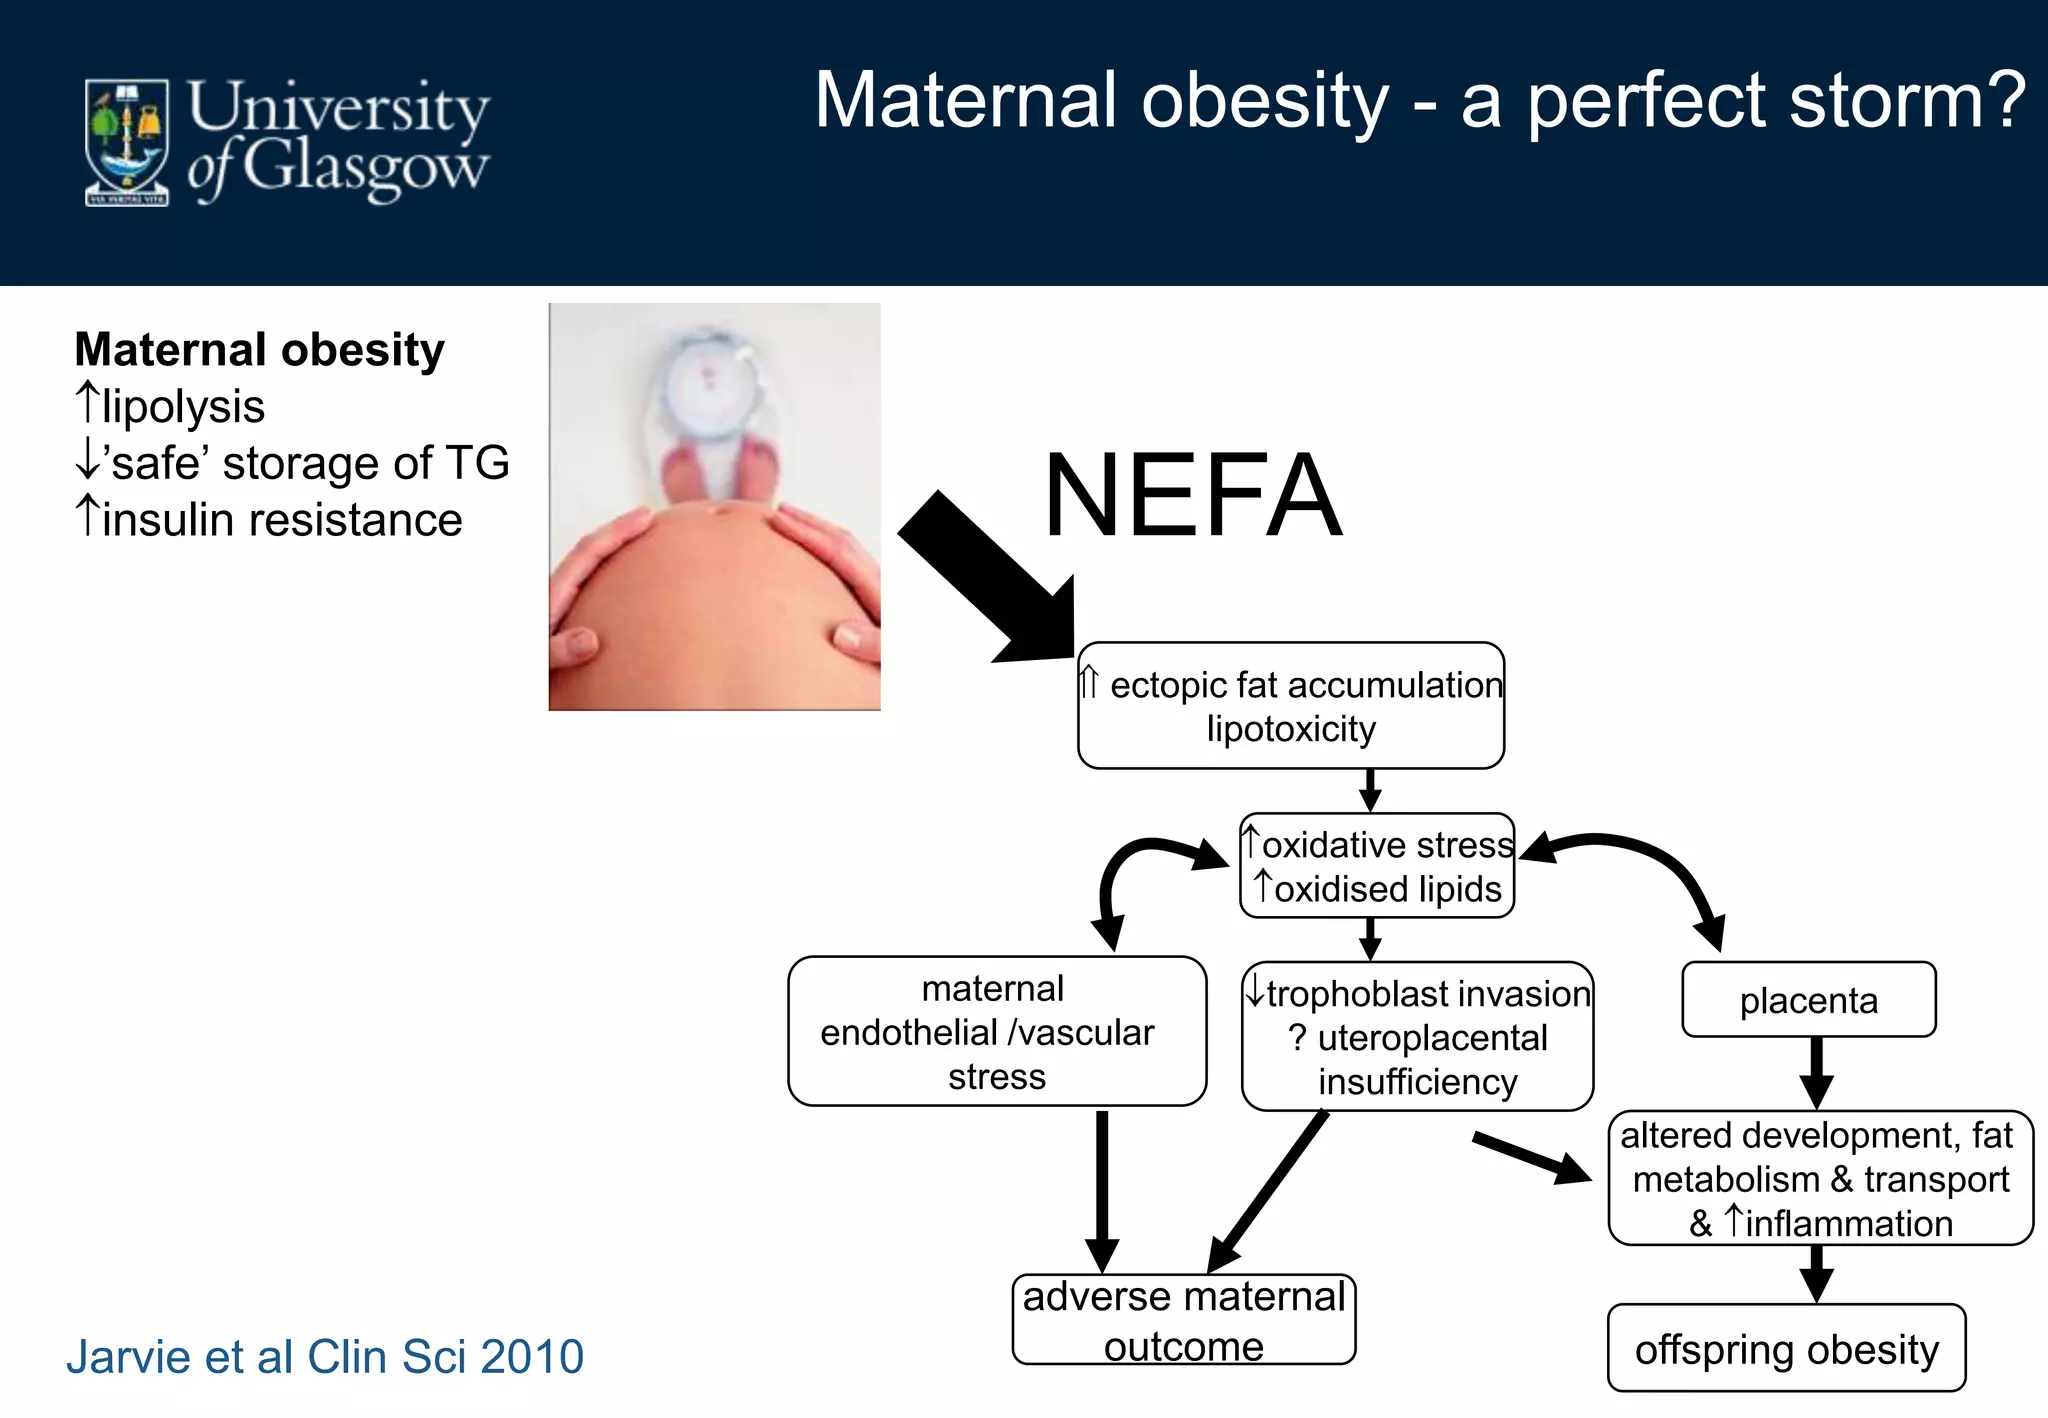
Maternal obesity is associated with alterations in maternal metabolism and fat distribution during pregnancy that may impact health outcomes. Specifically:
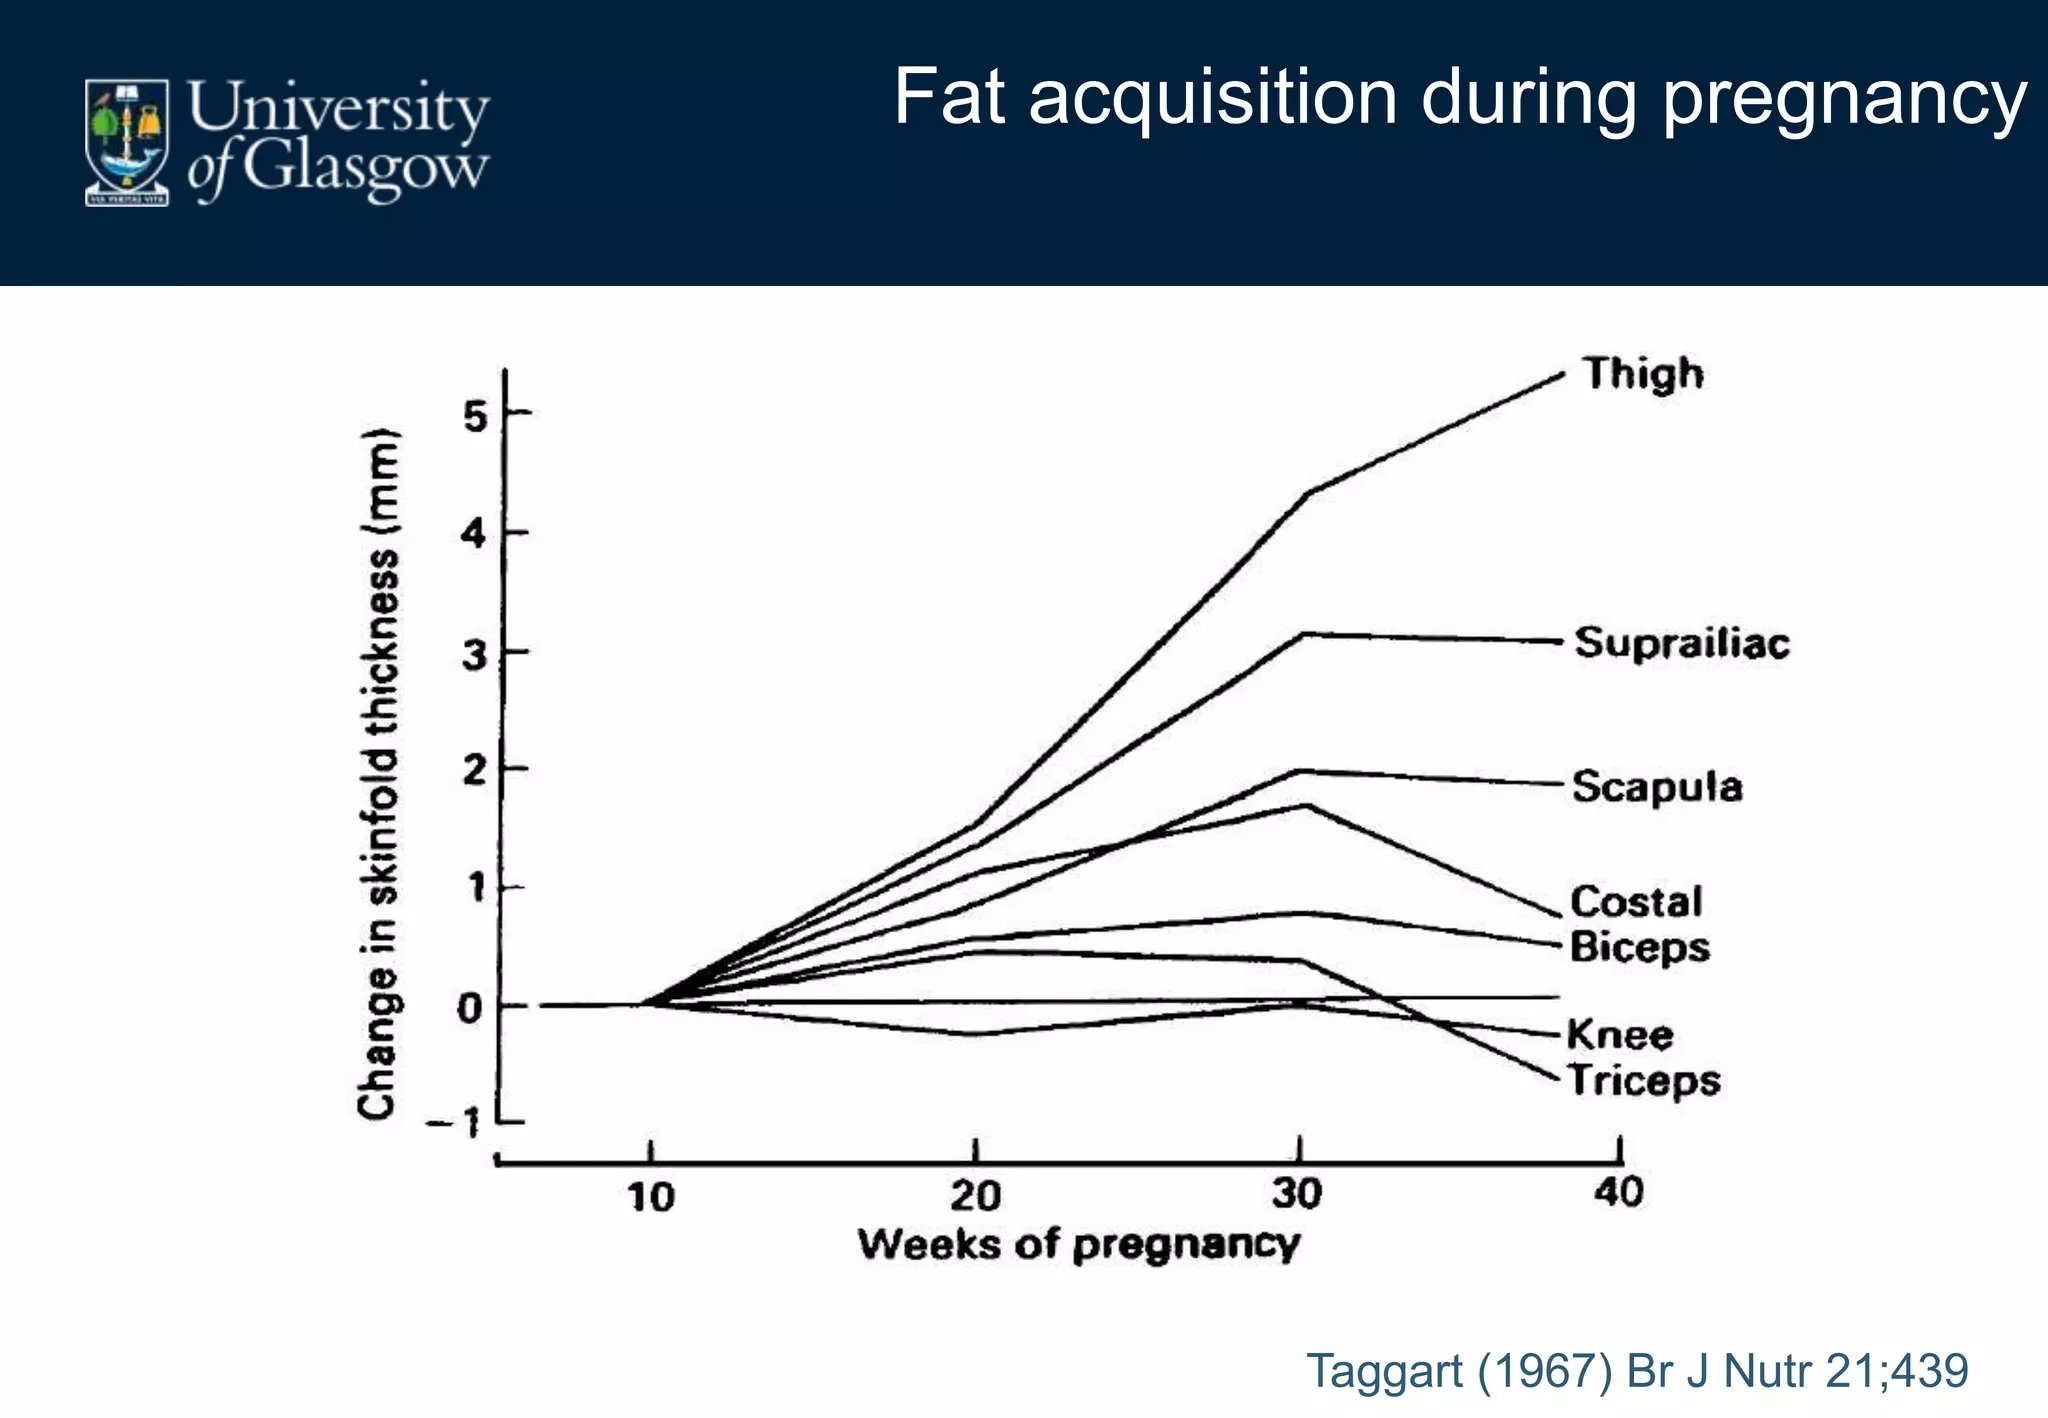
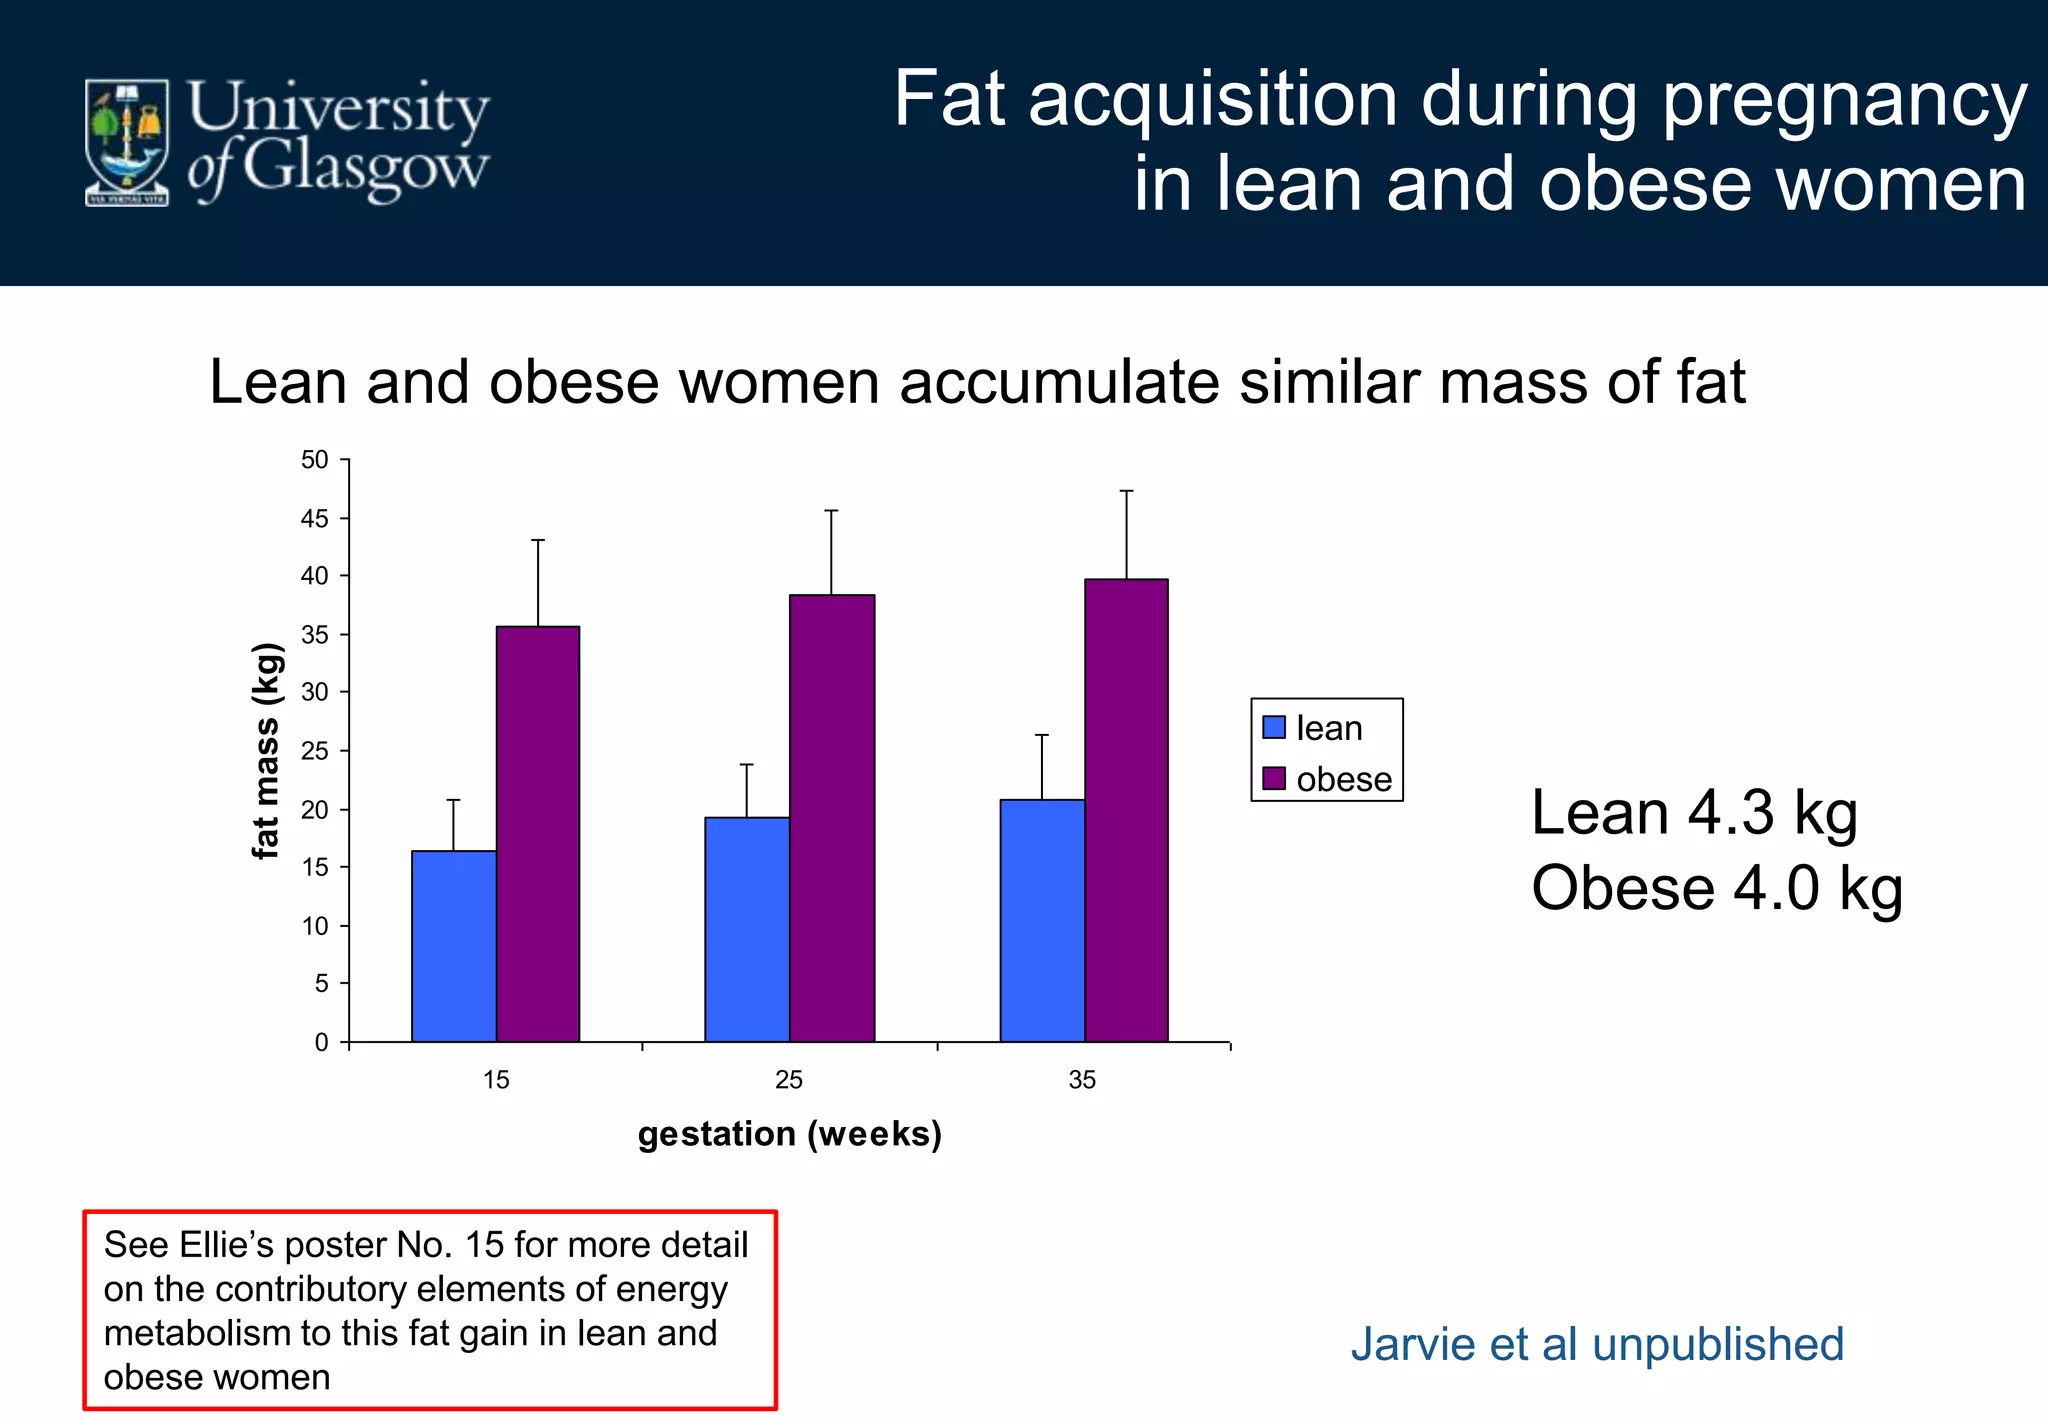
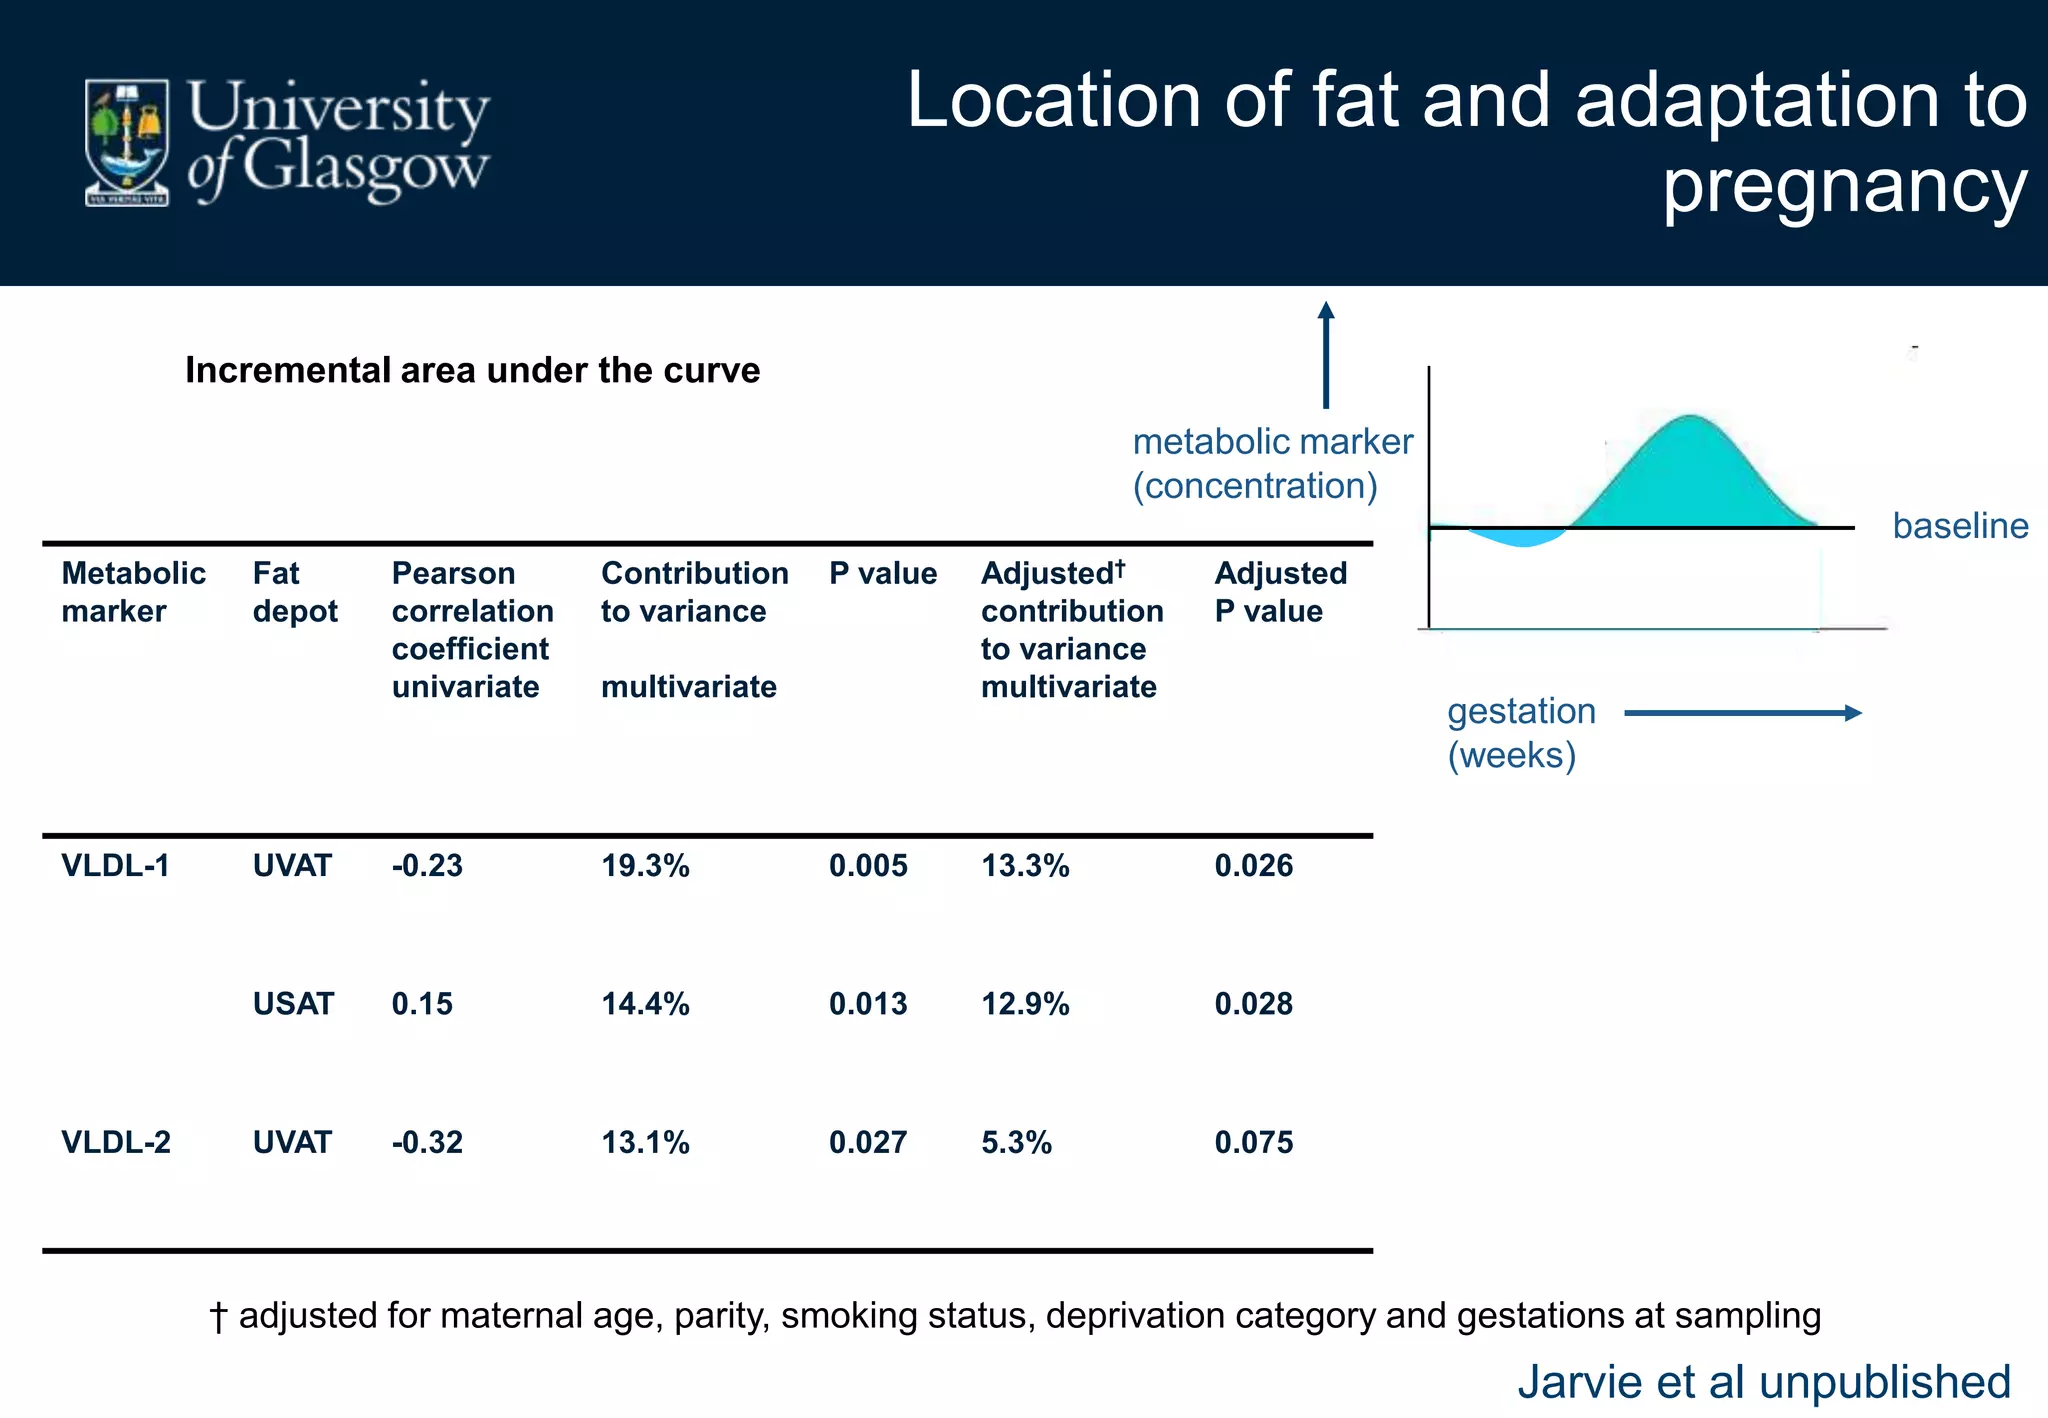
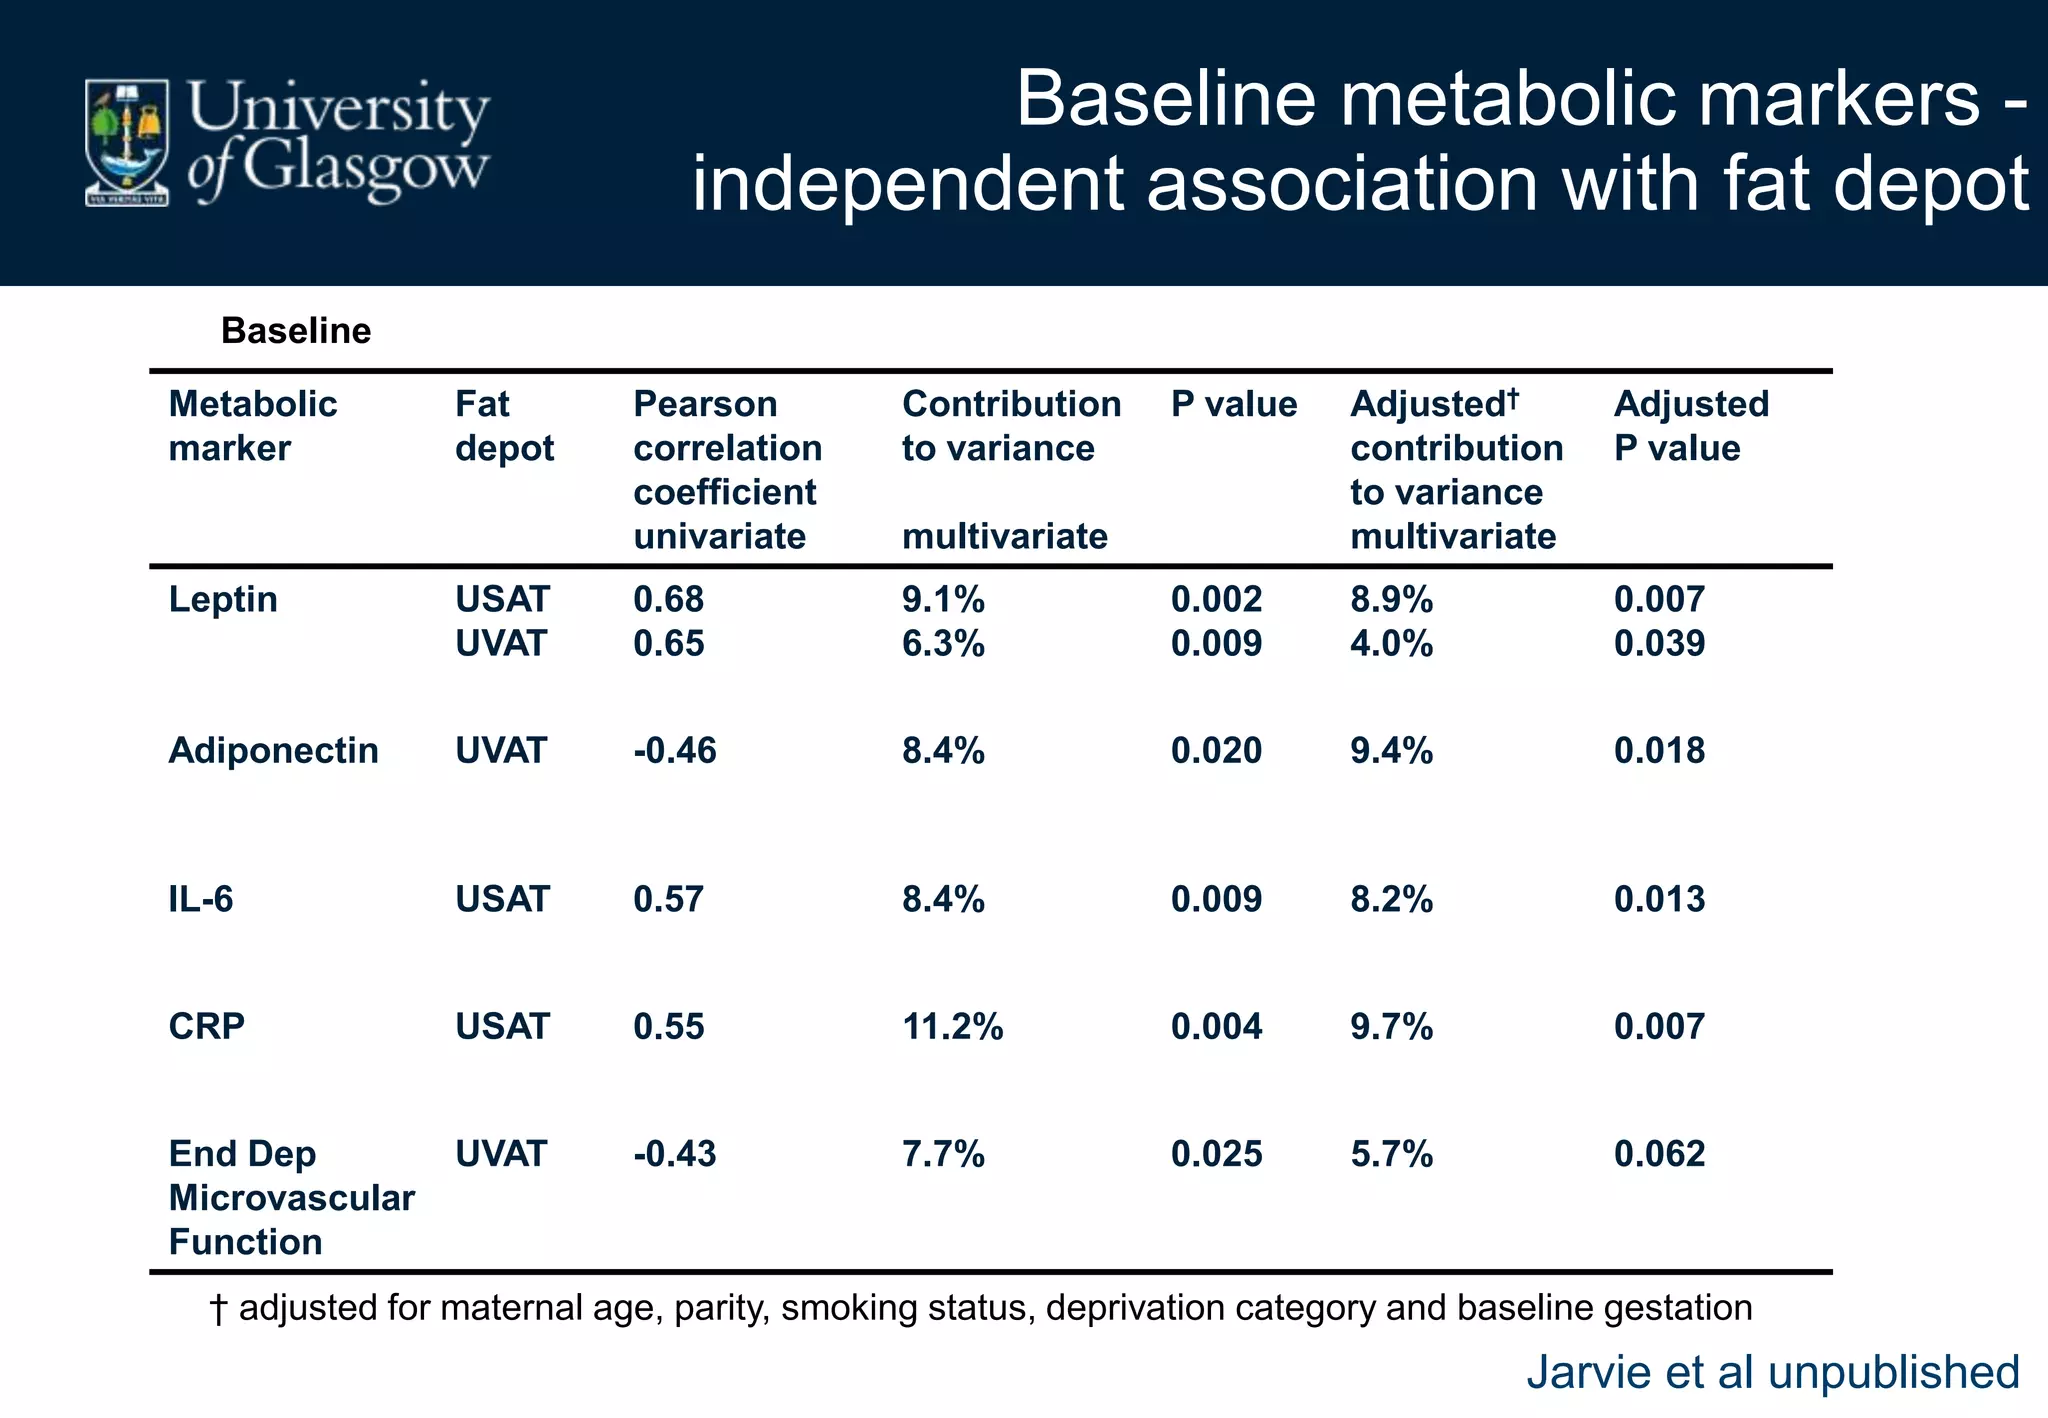
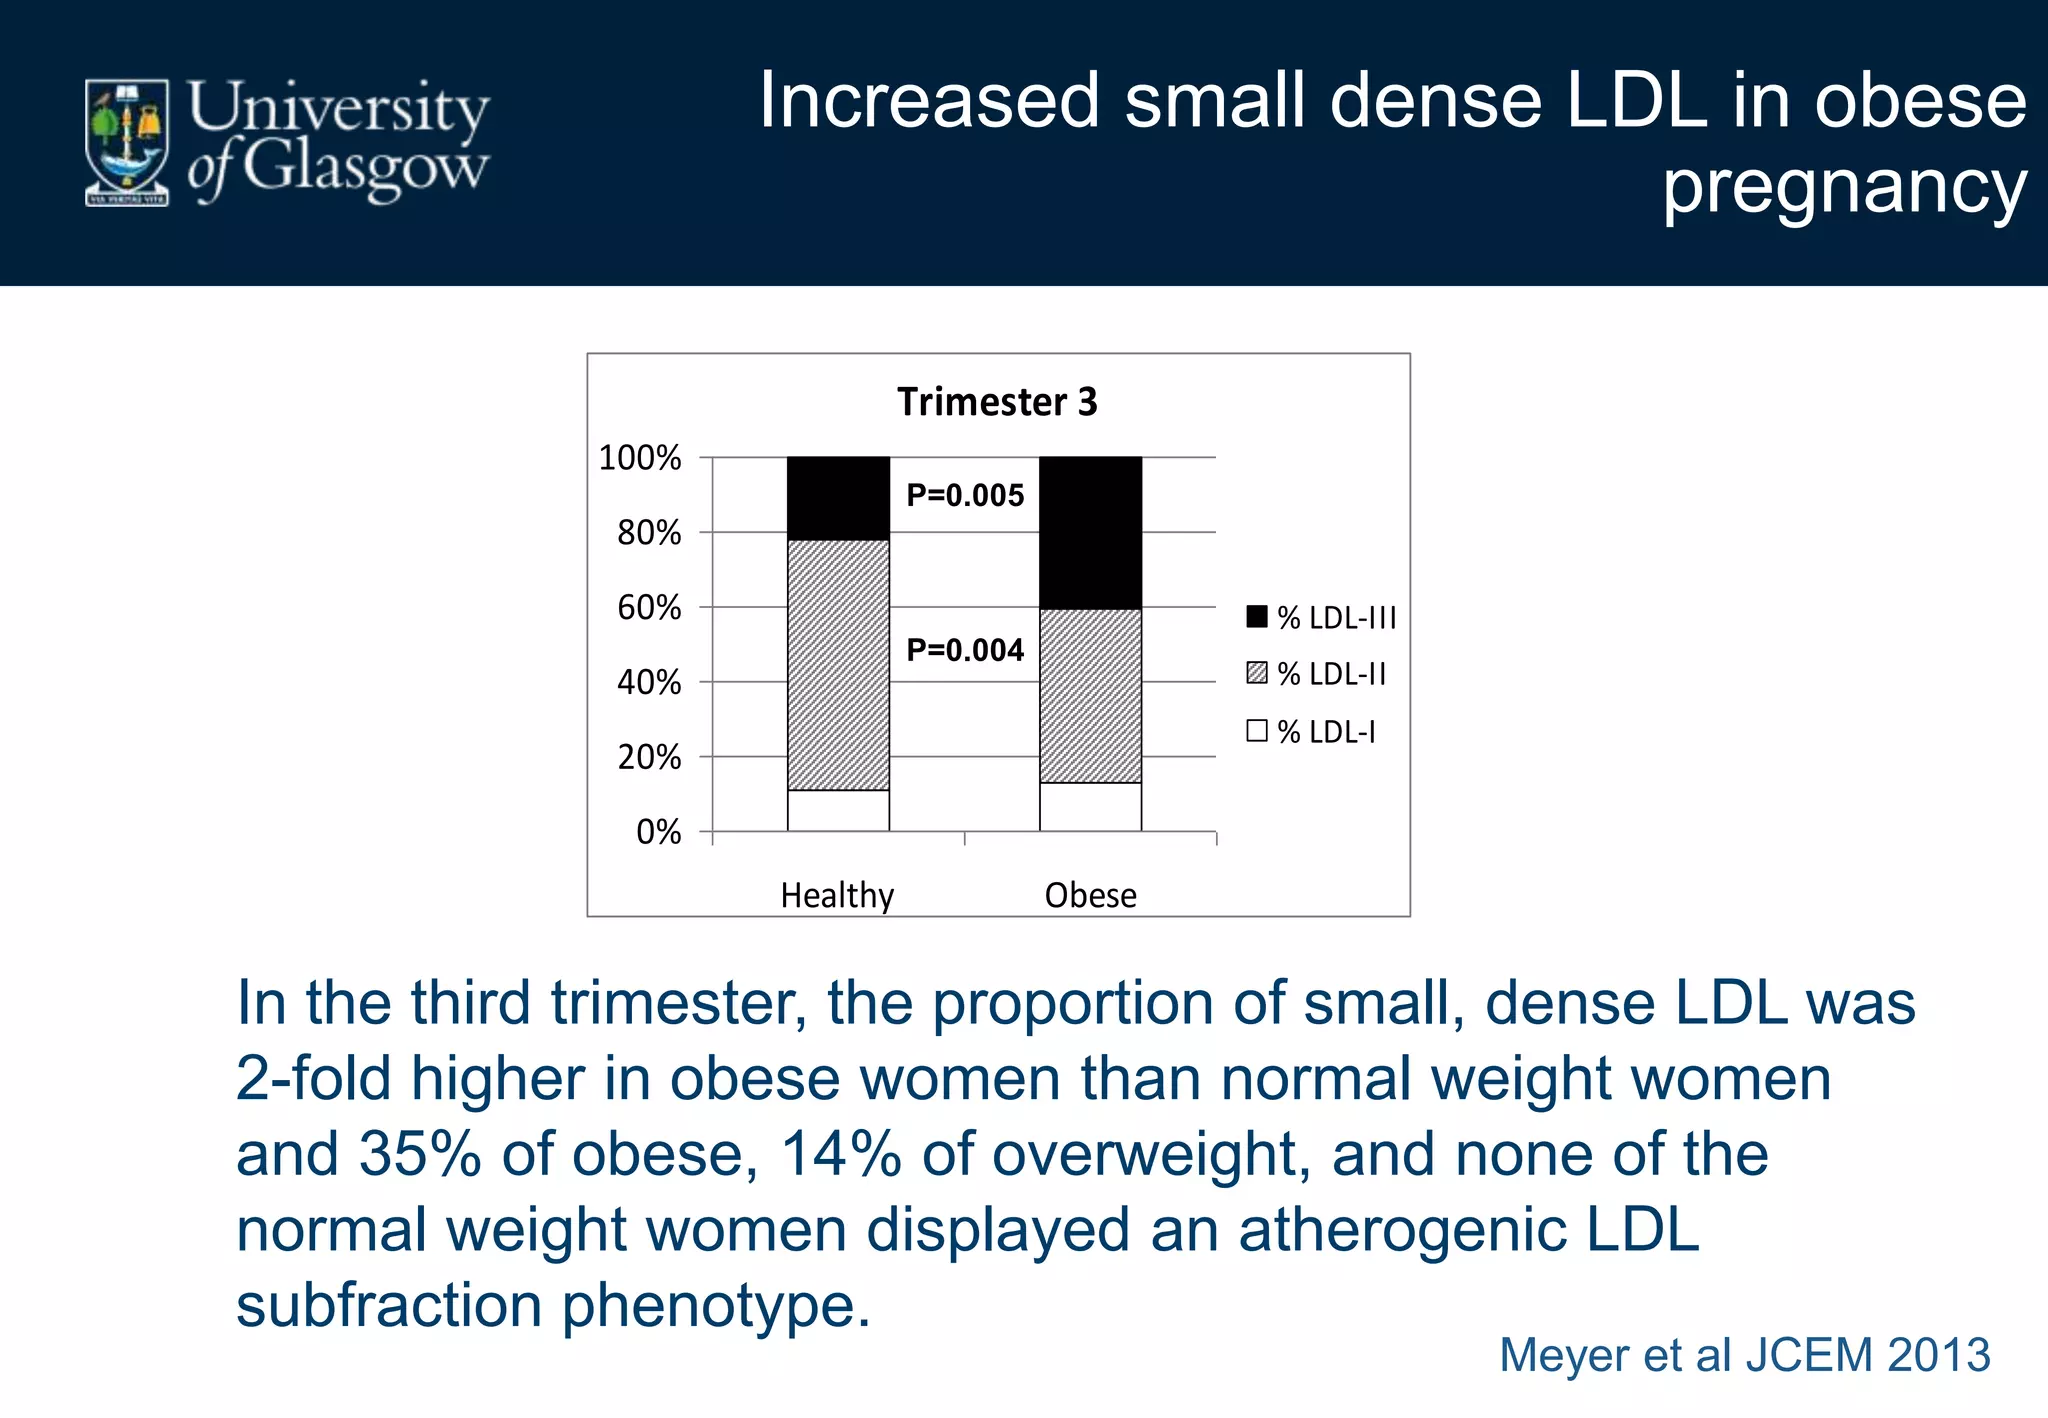
1. Obese pregnant women have greater fat acquisition similar to lean women, but deposit more fat in visceral rather than subcutaneous depots.
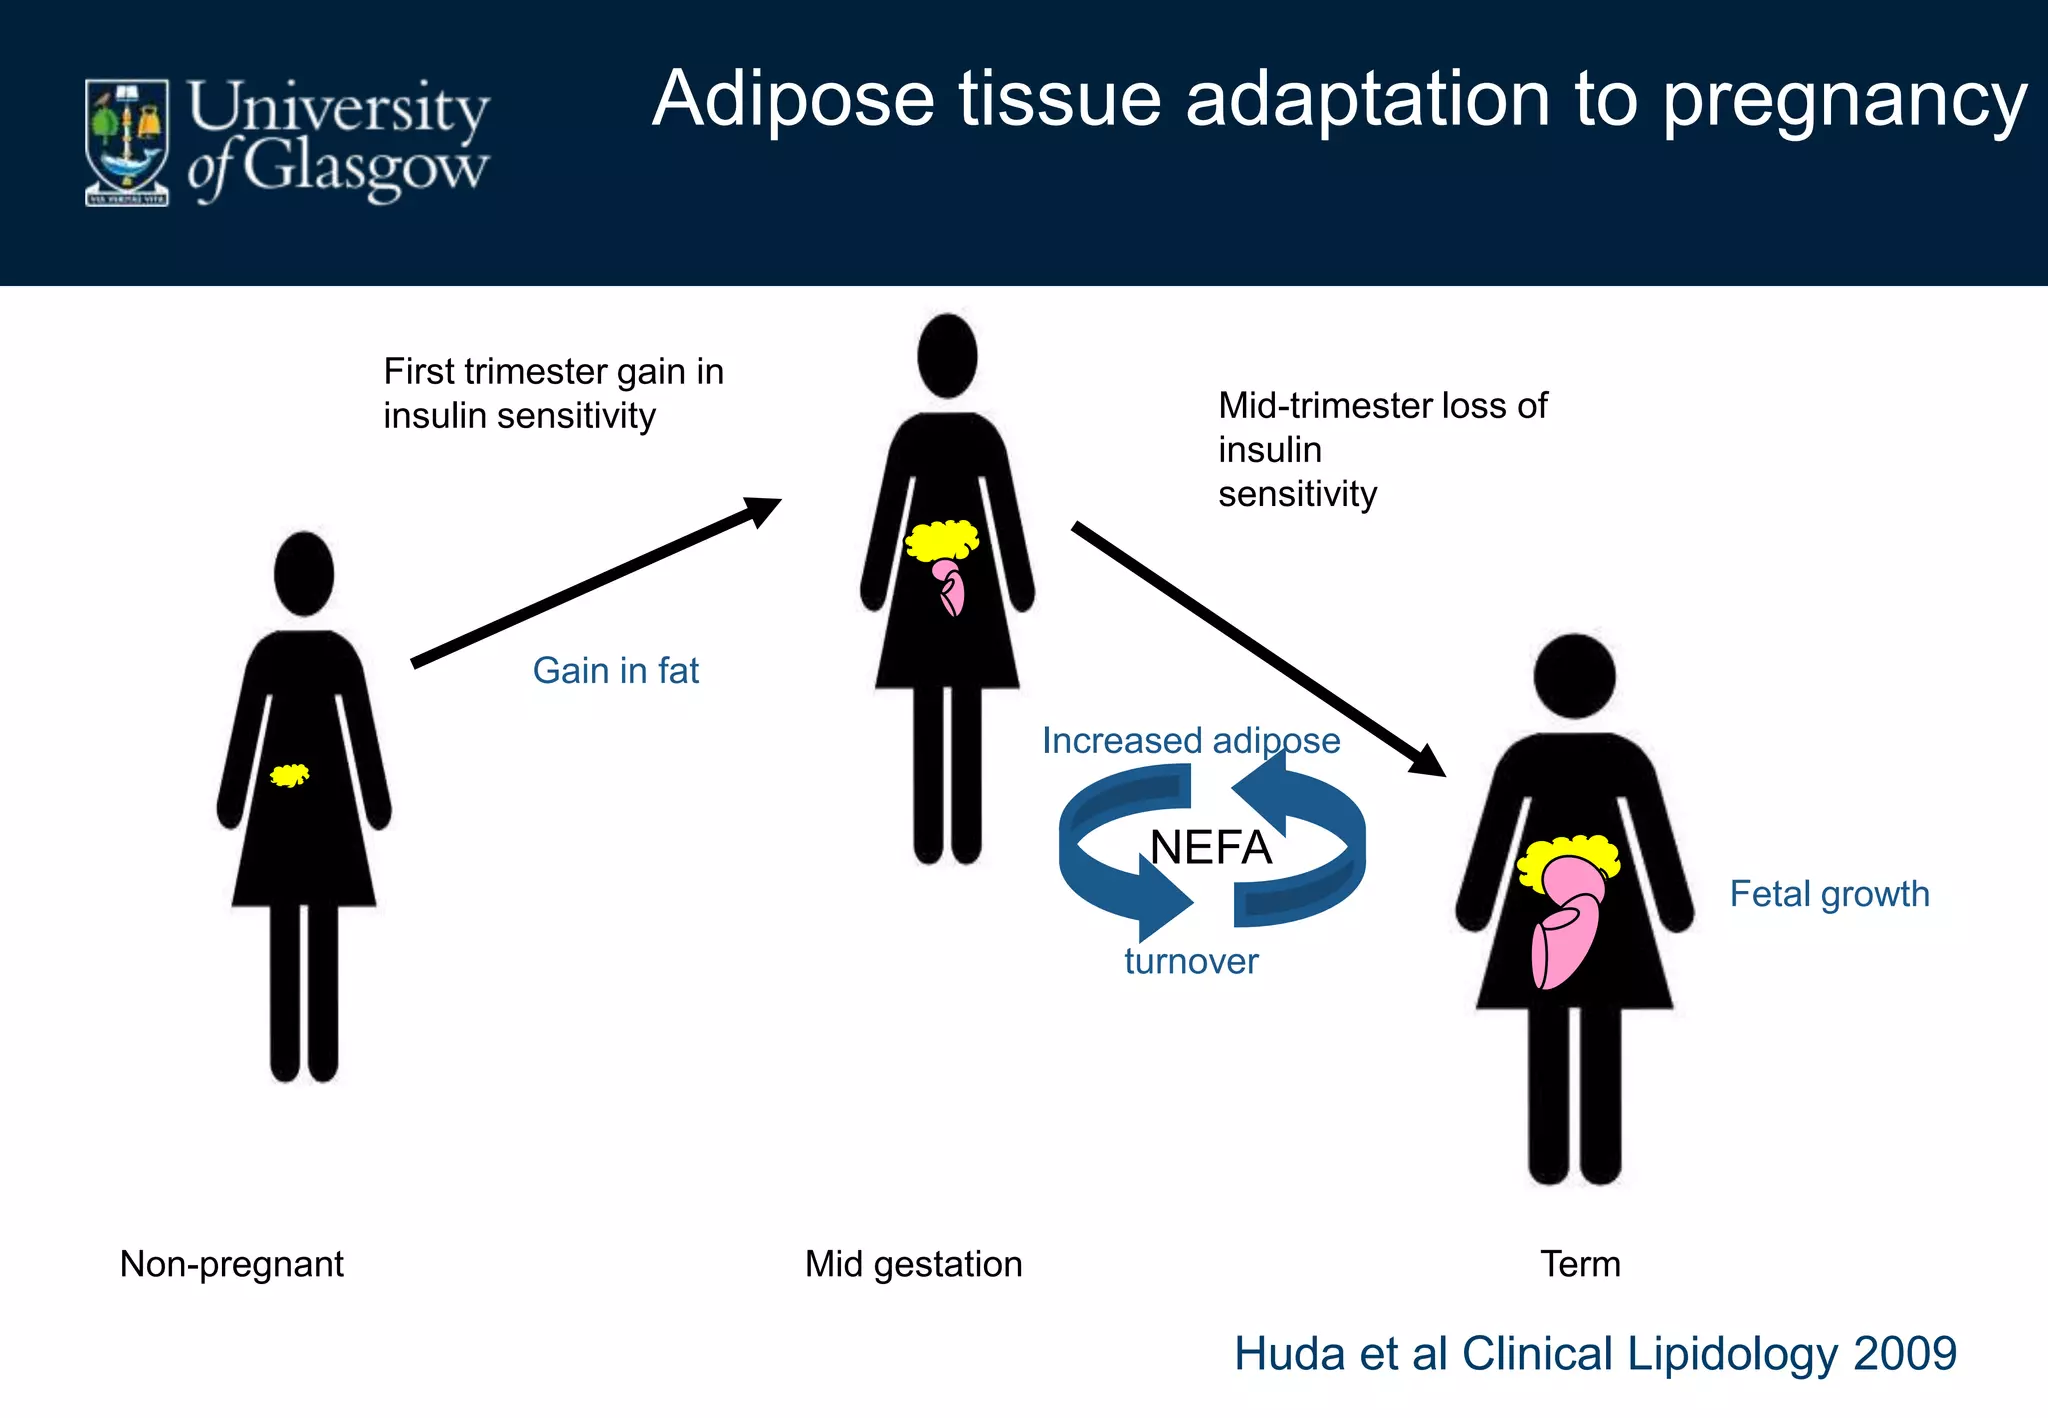
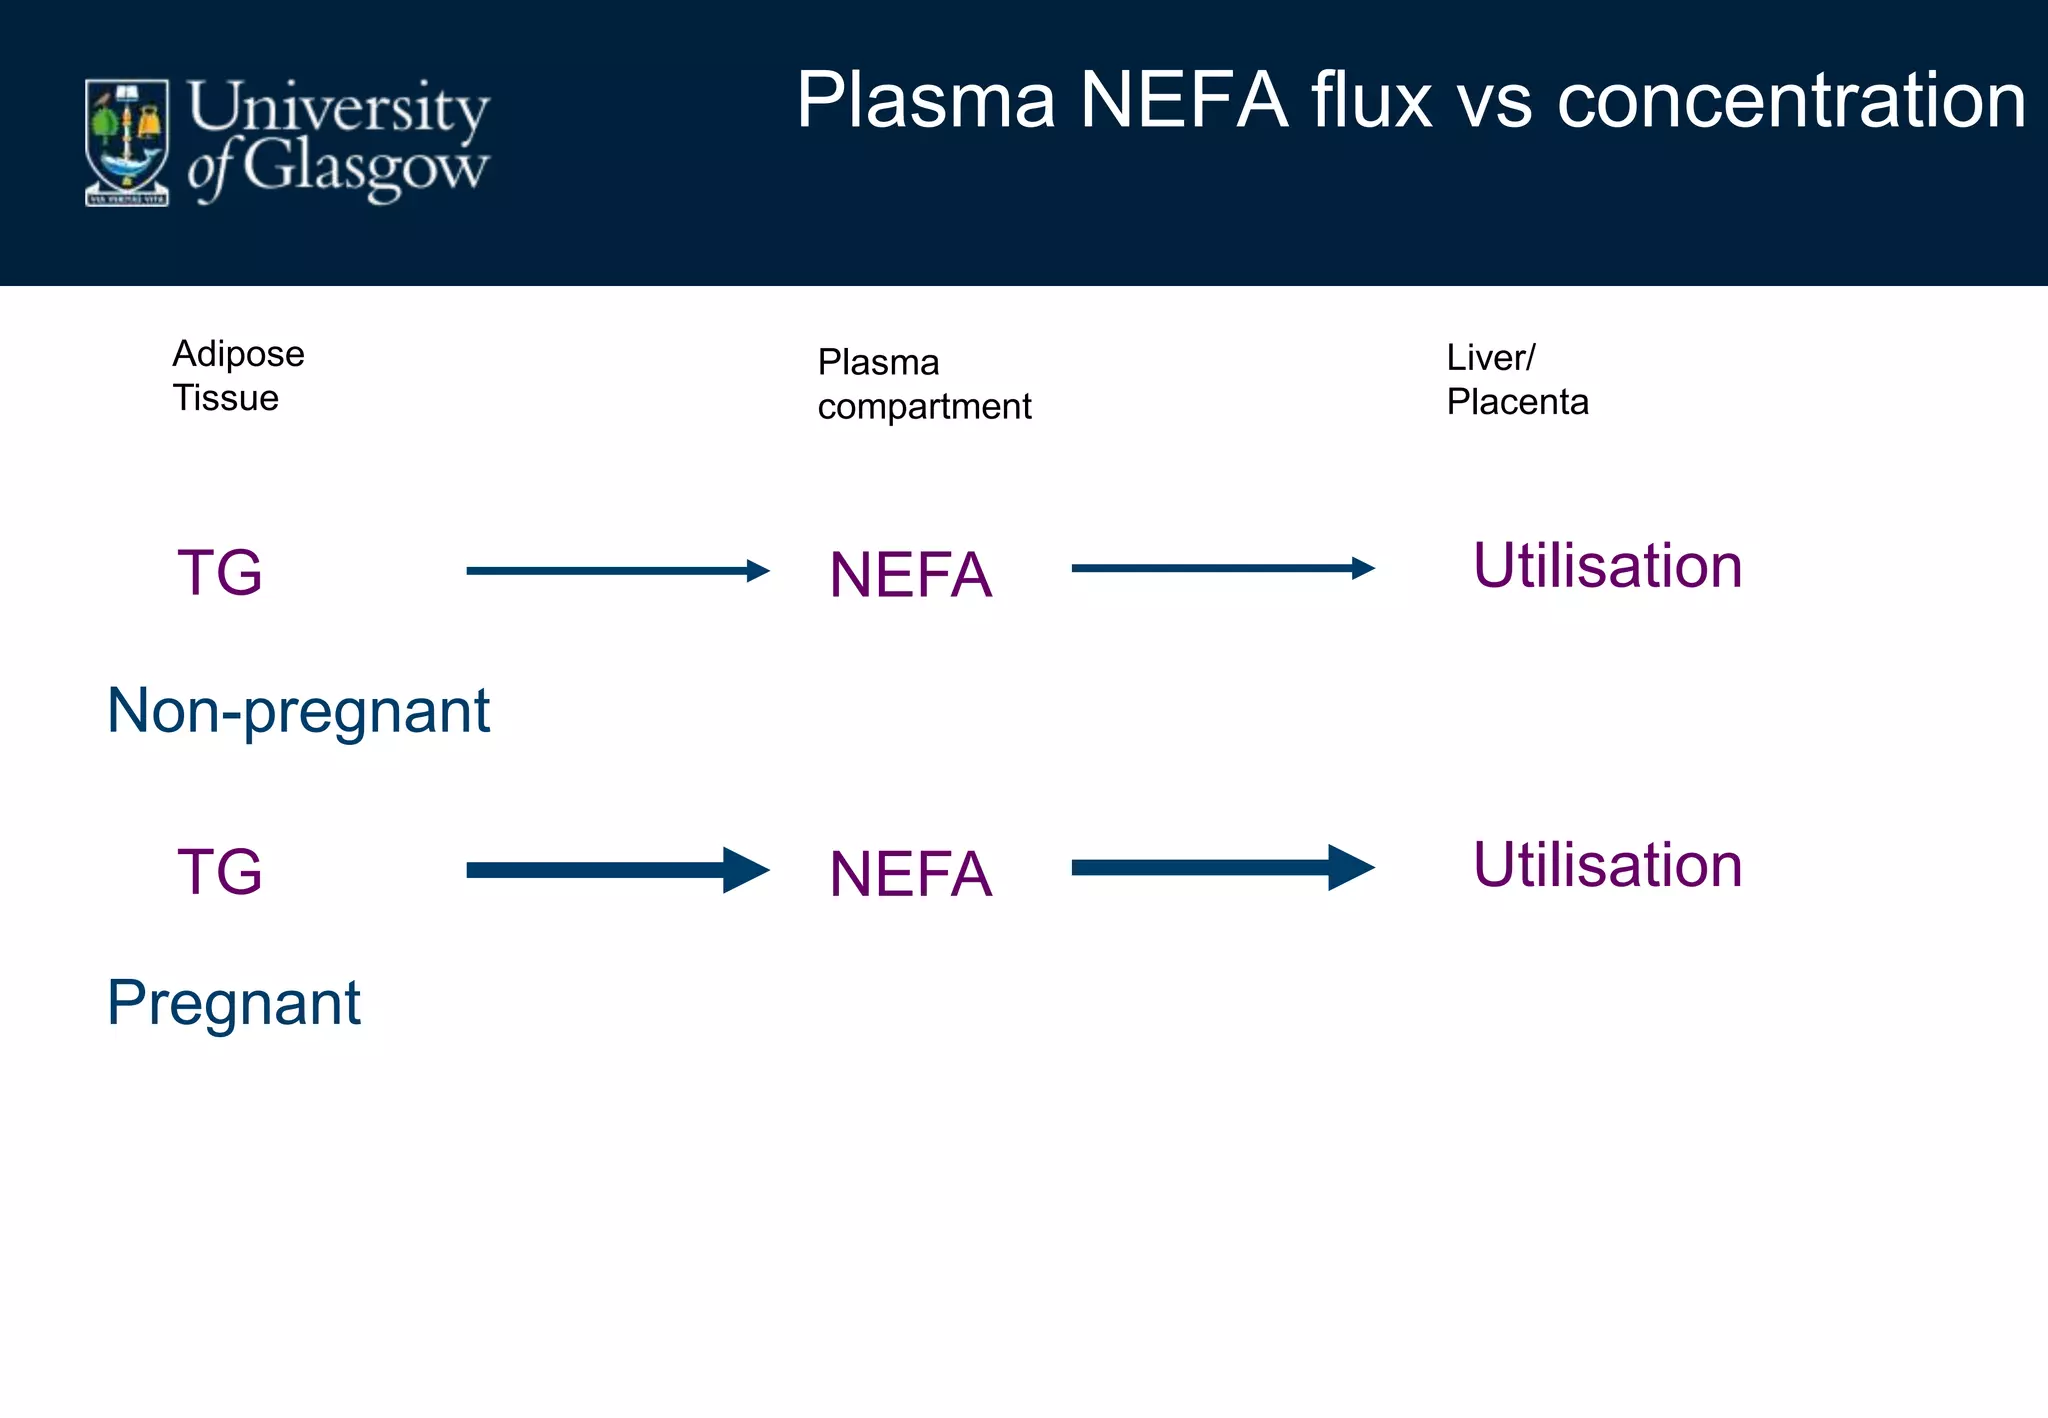
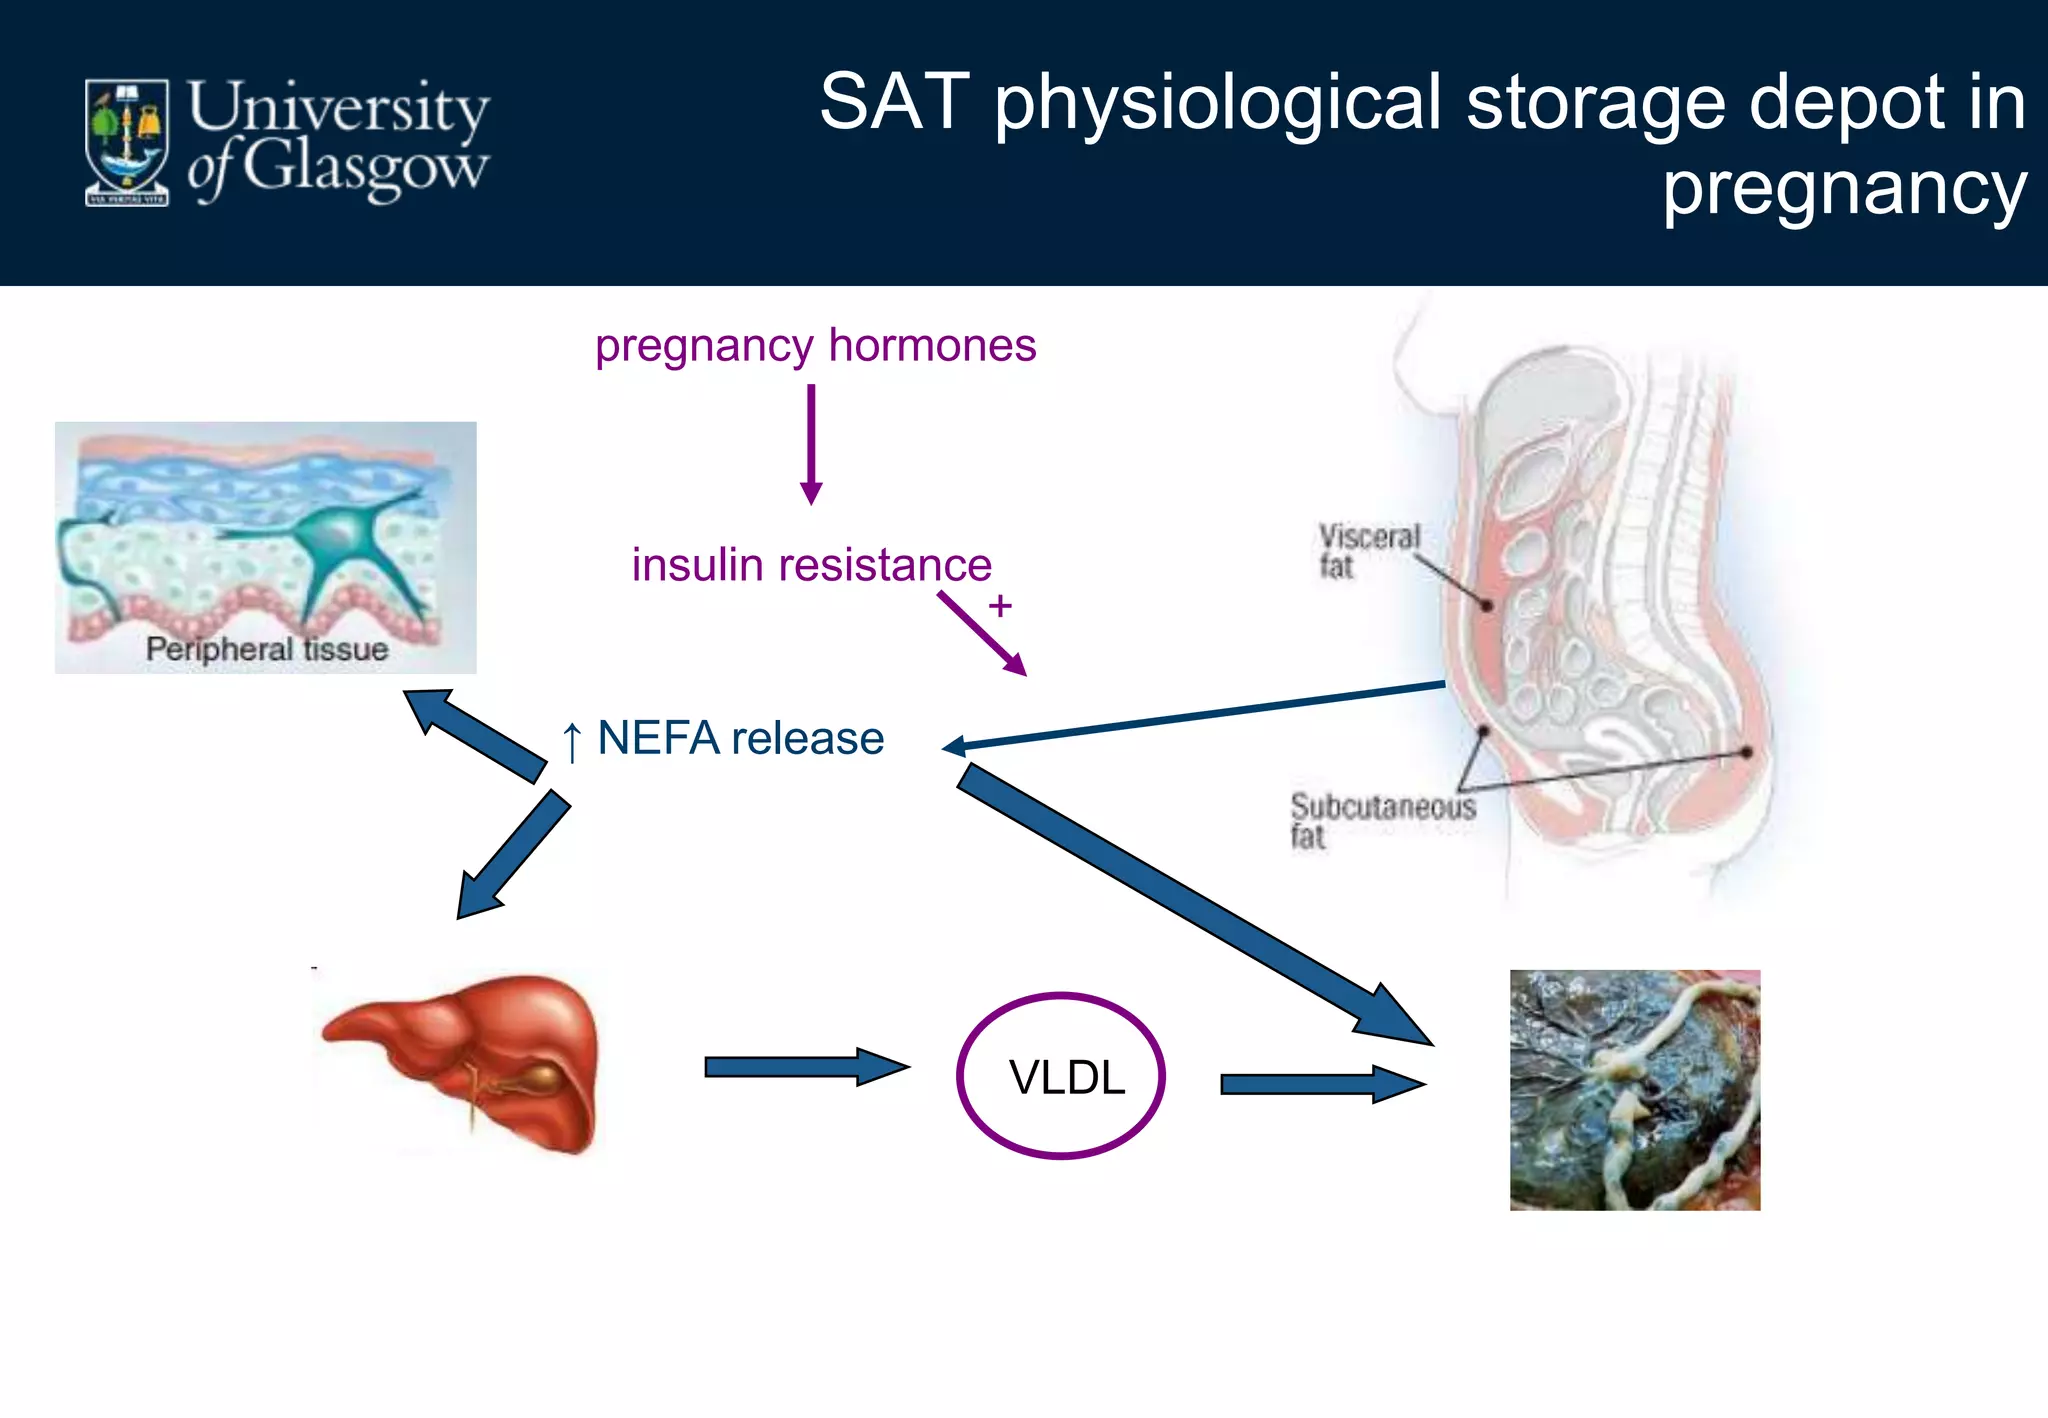
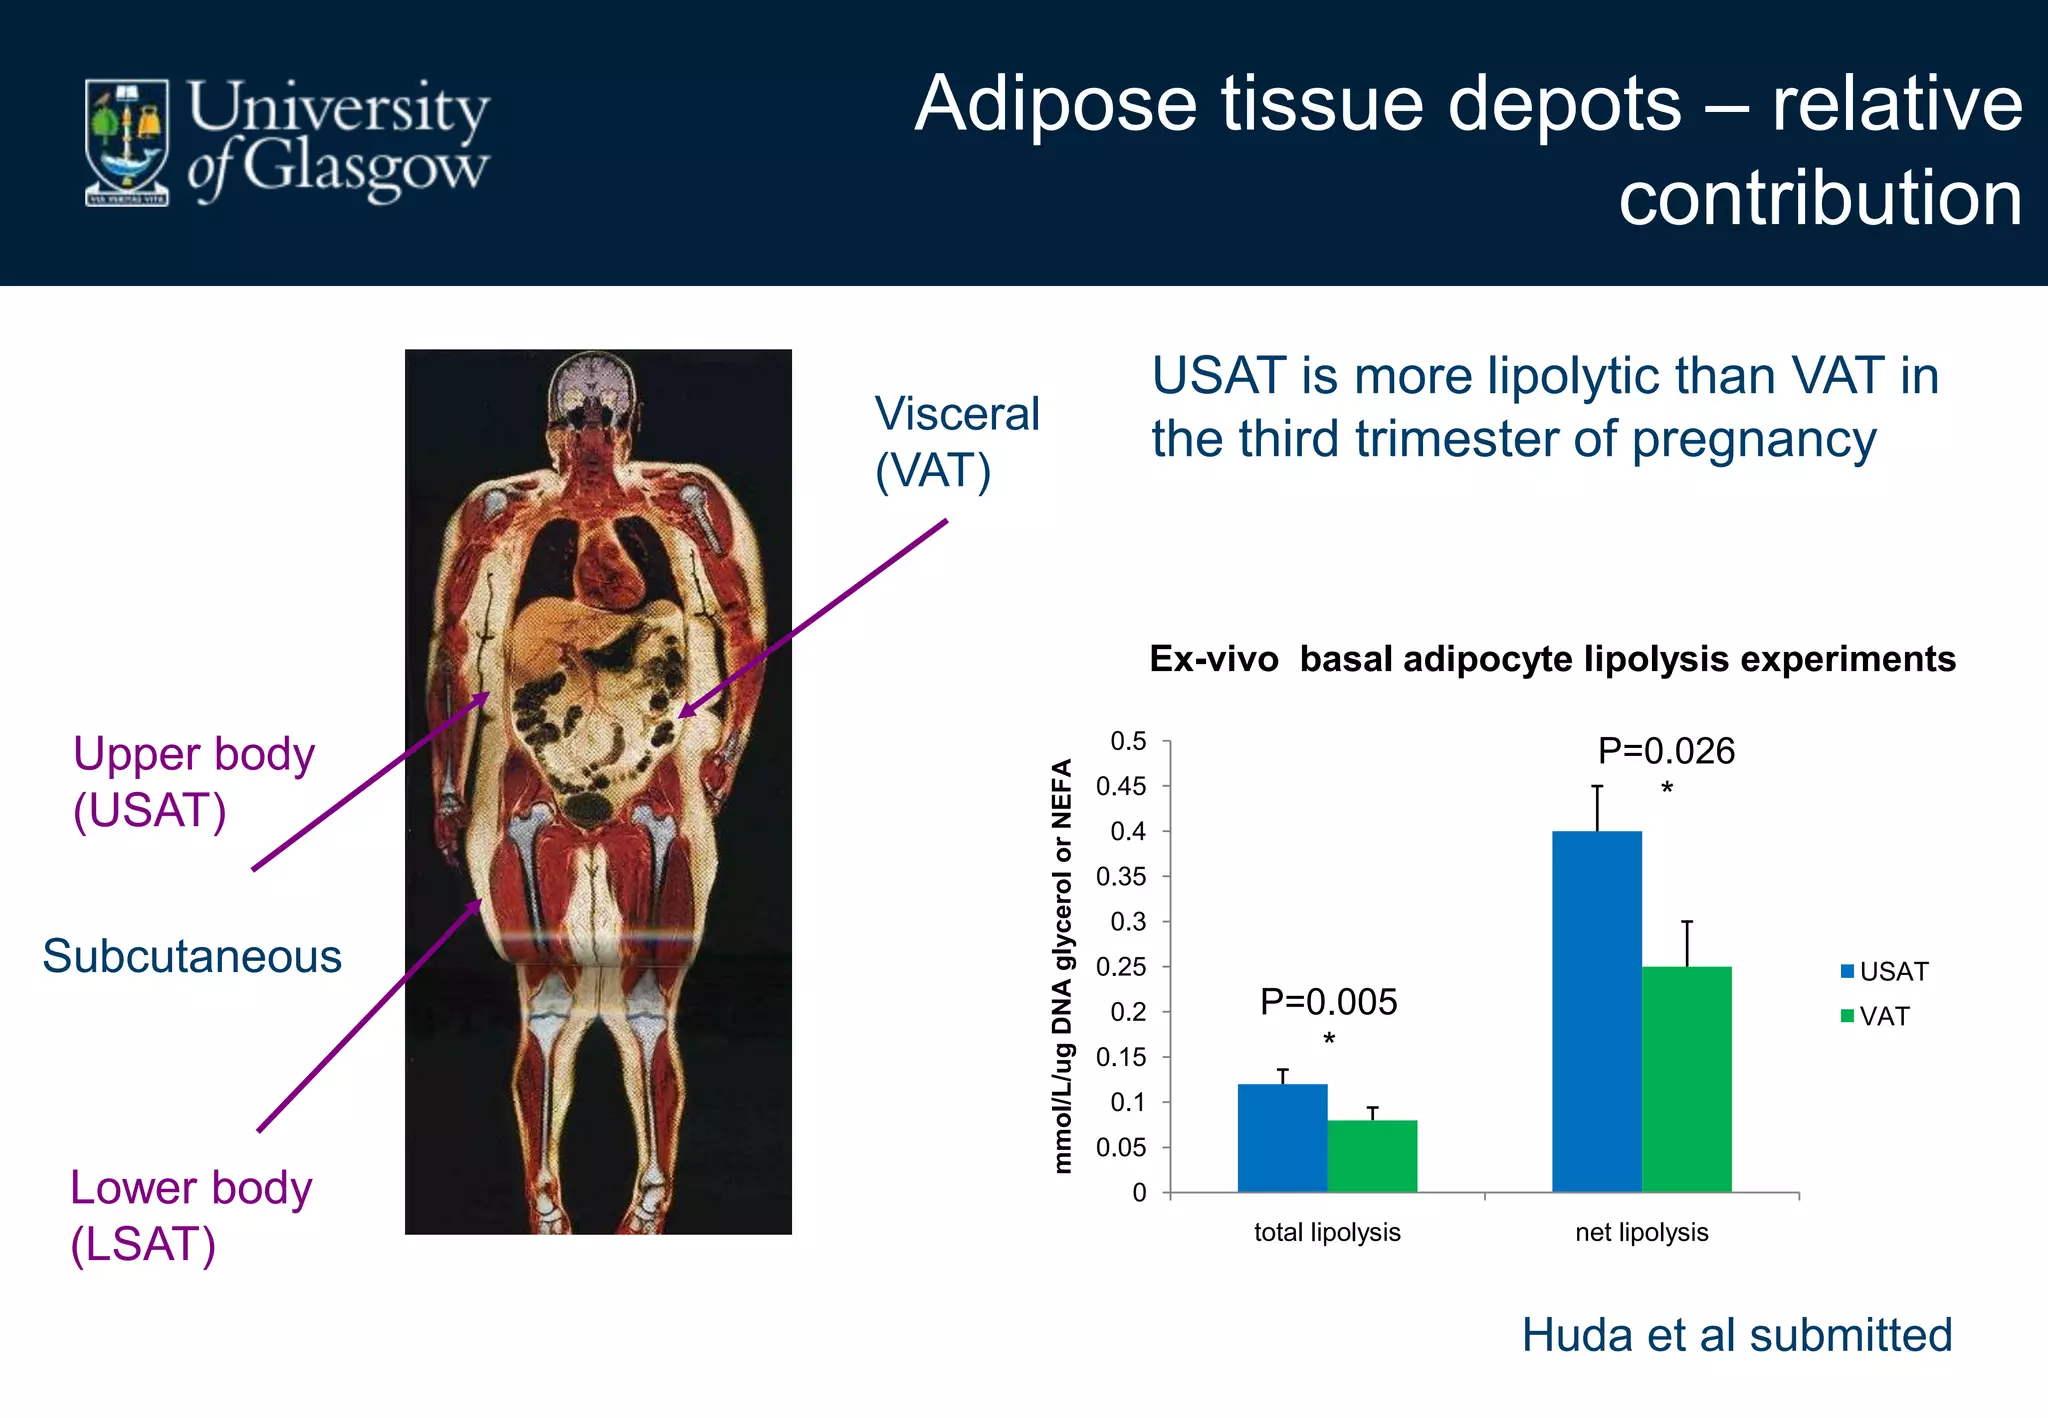
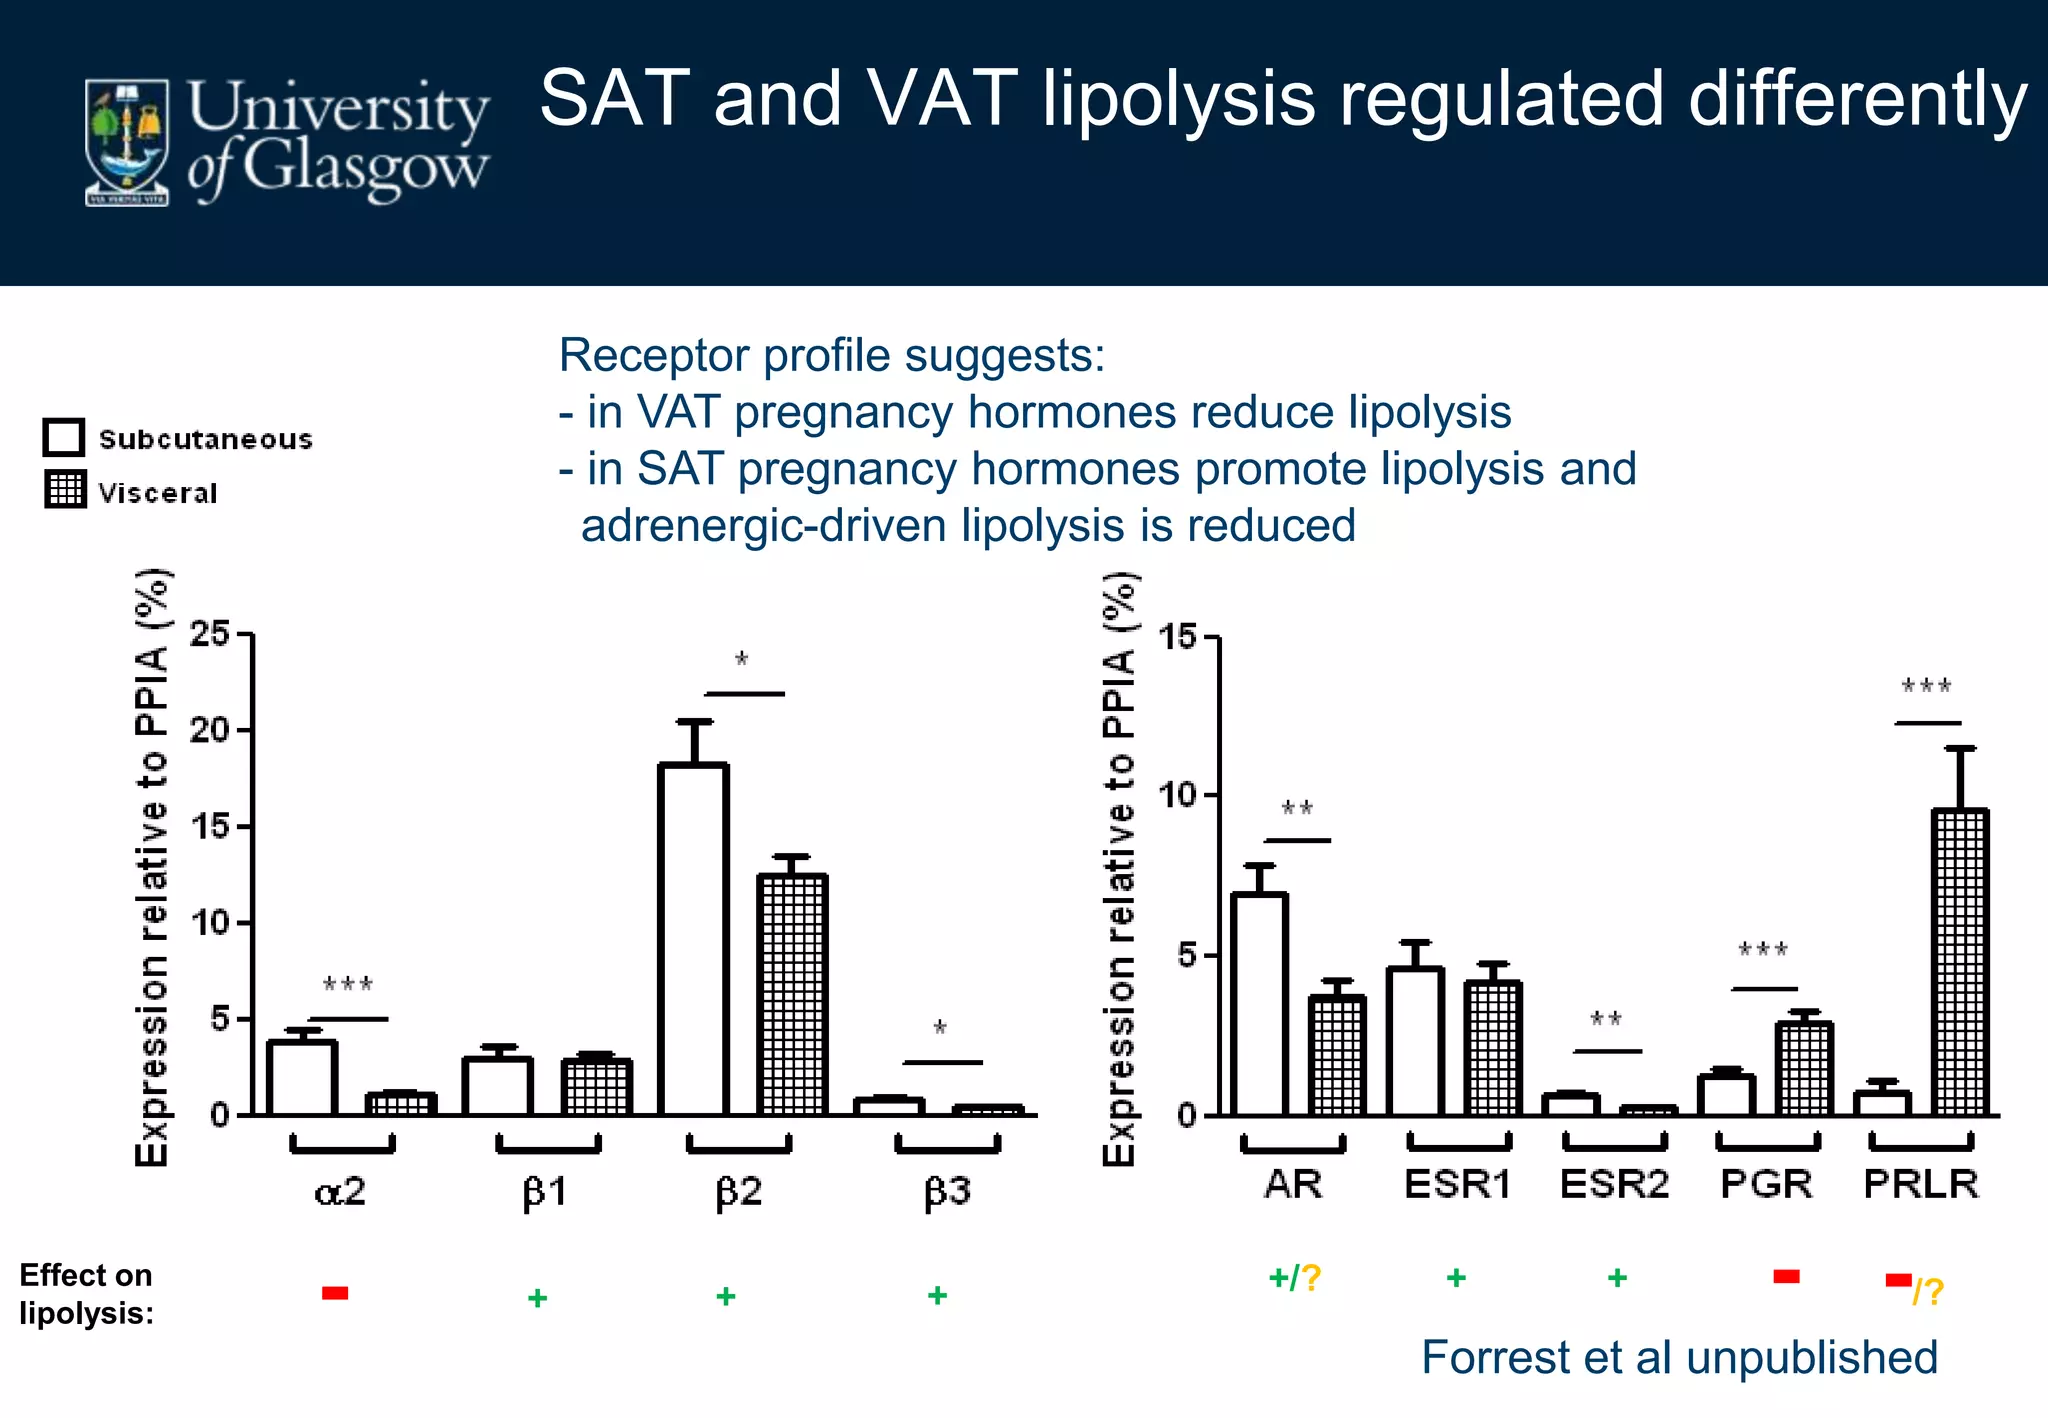
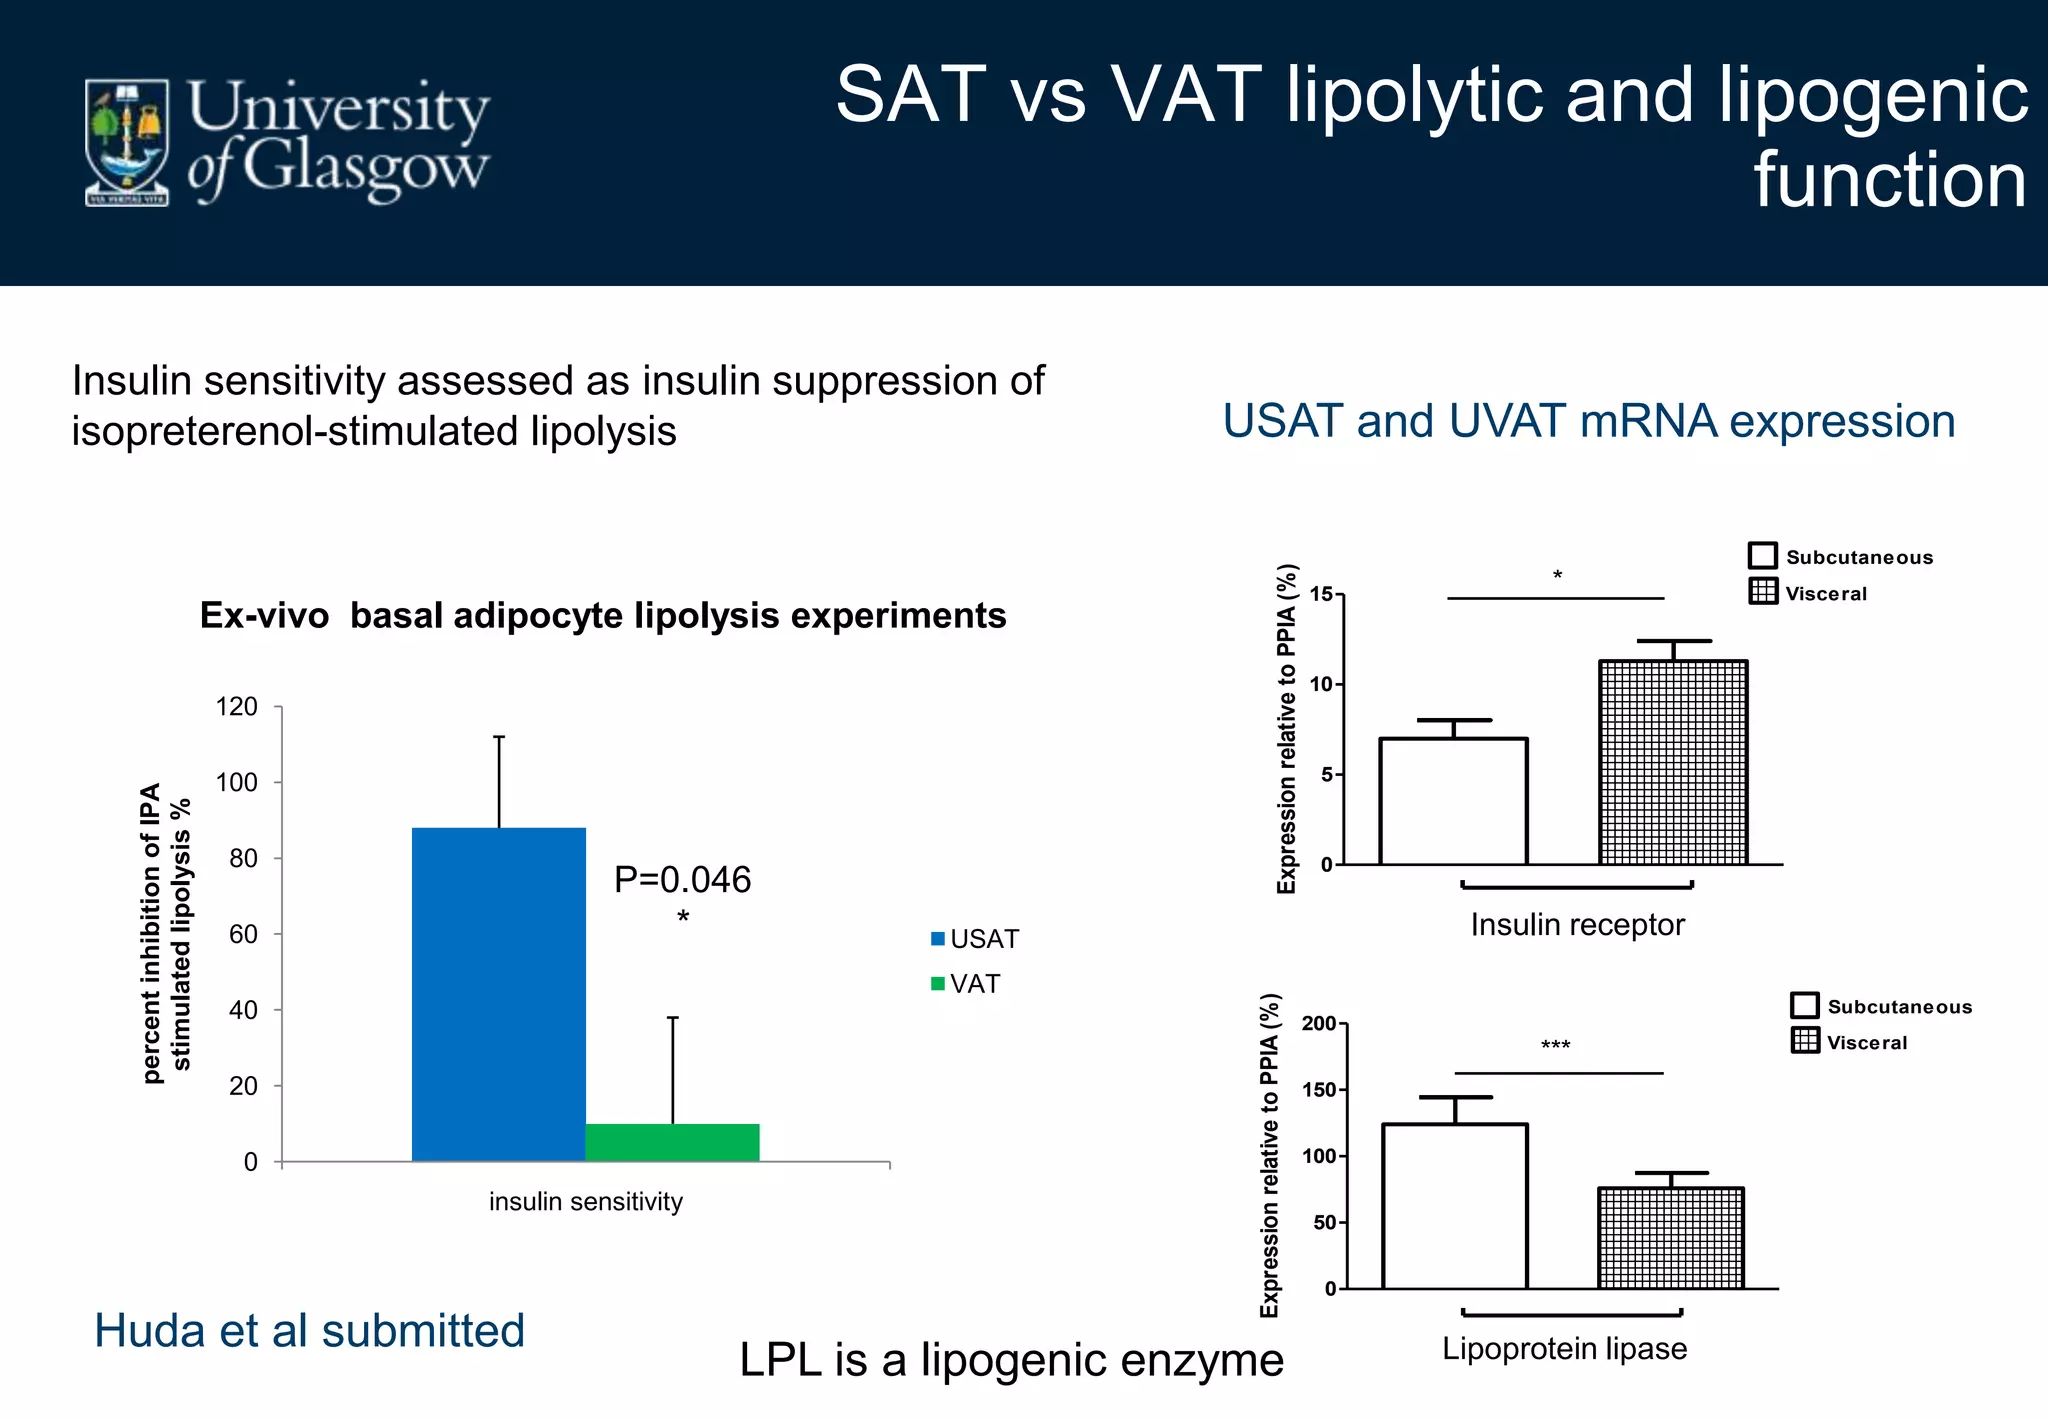
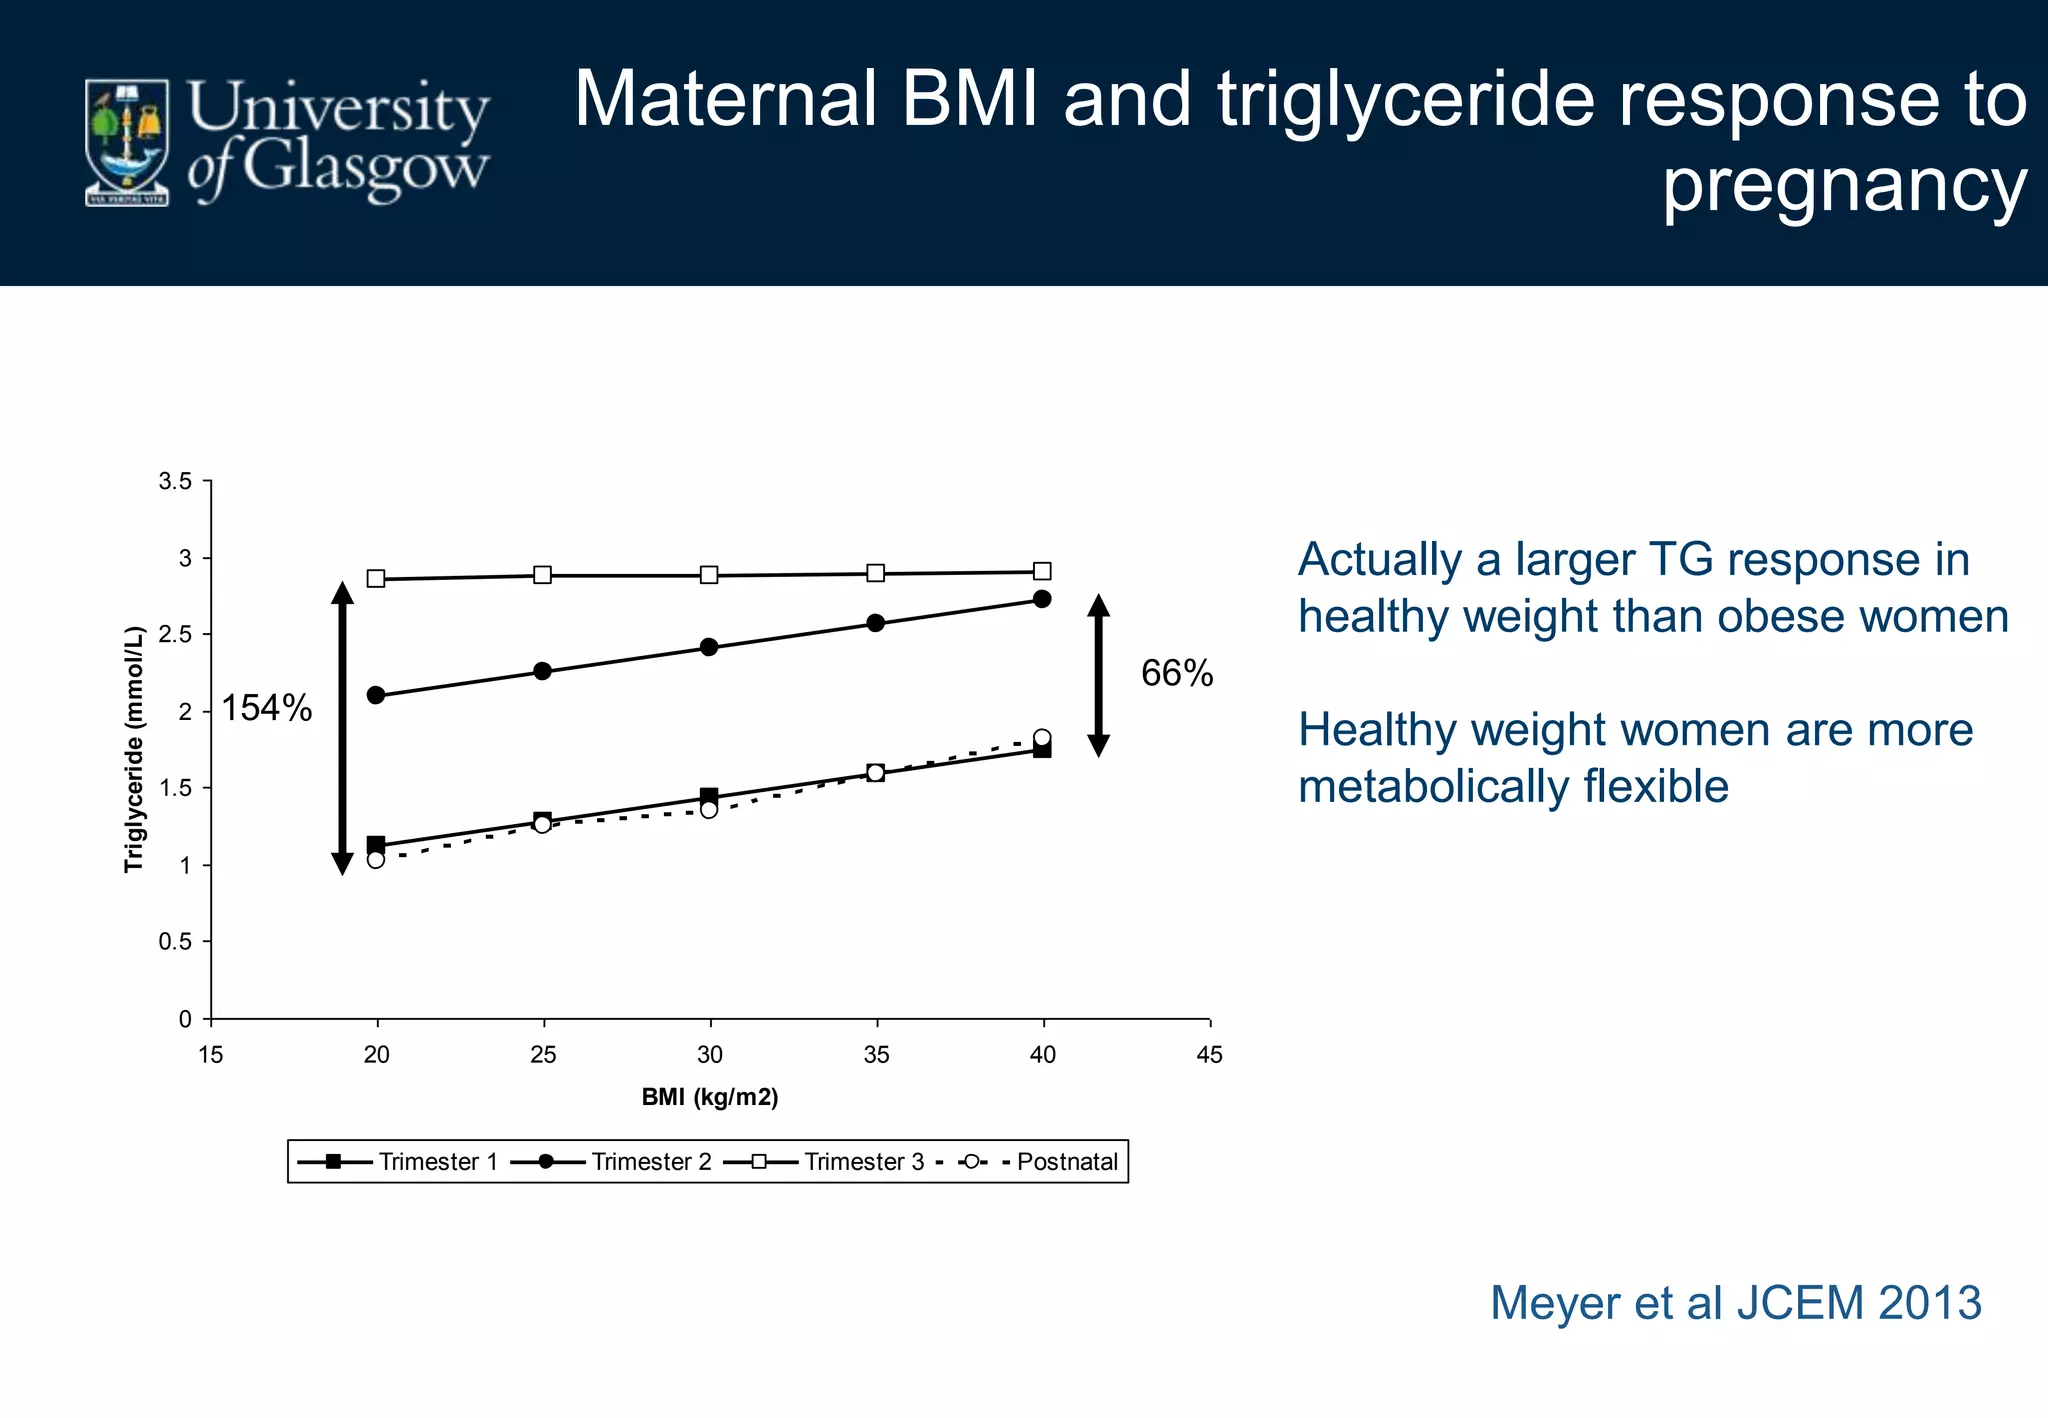
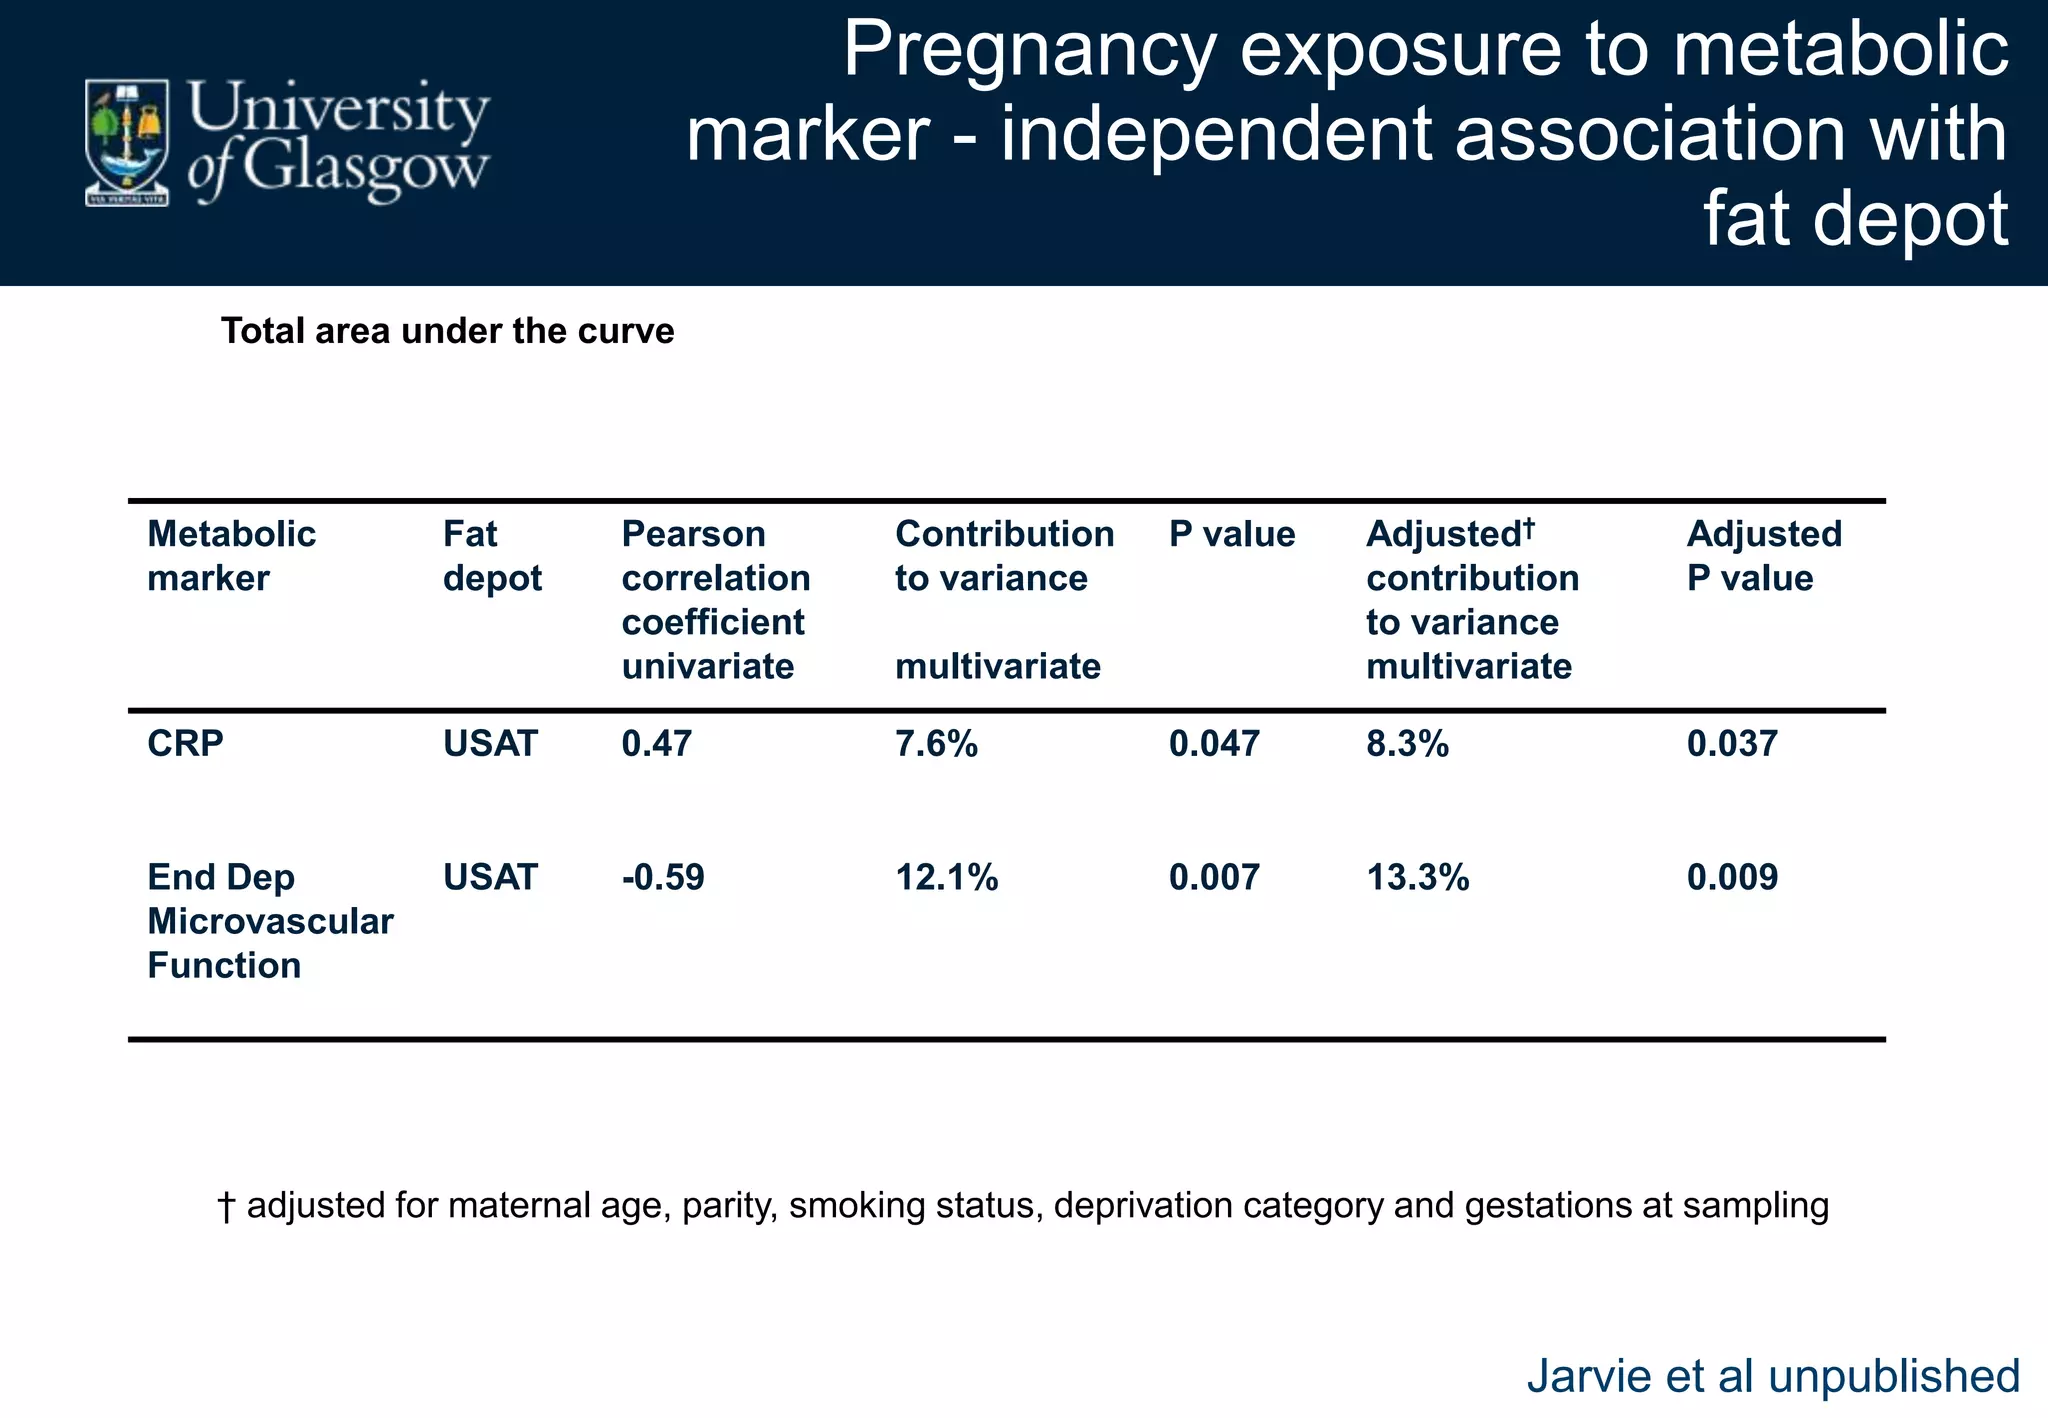
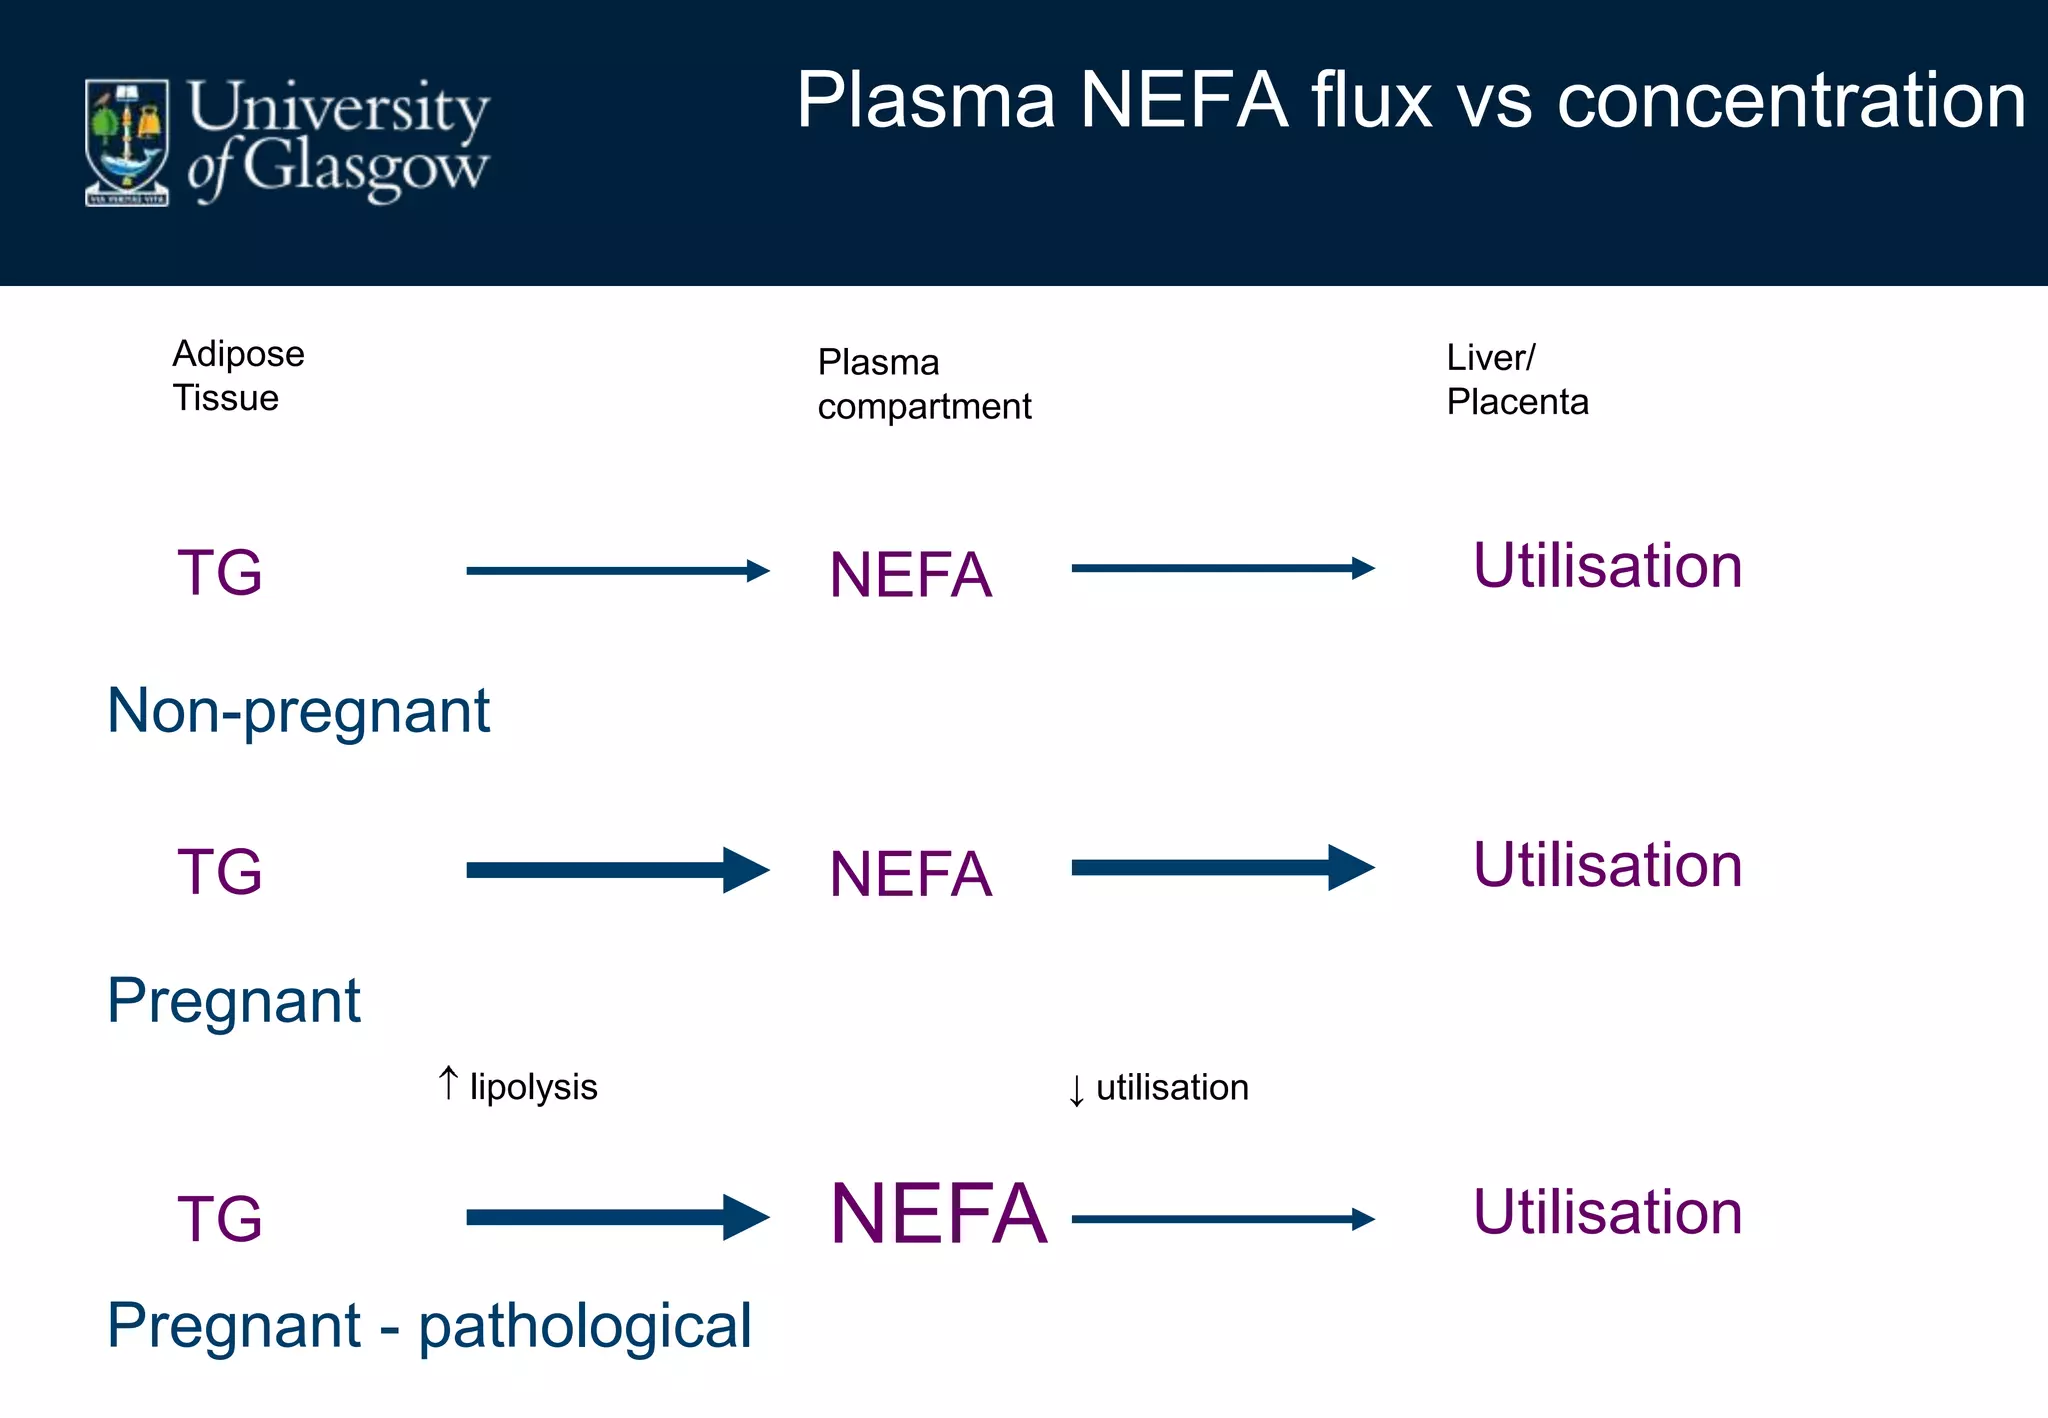
2. Subcutaneous adipose tissue normally acts as a fatty acid reservoir in healthy pregnancy, but visceral fat is more lipolytic and linked to insulin resistance and inflammation.
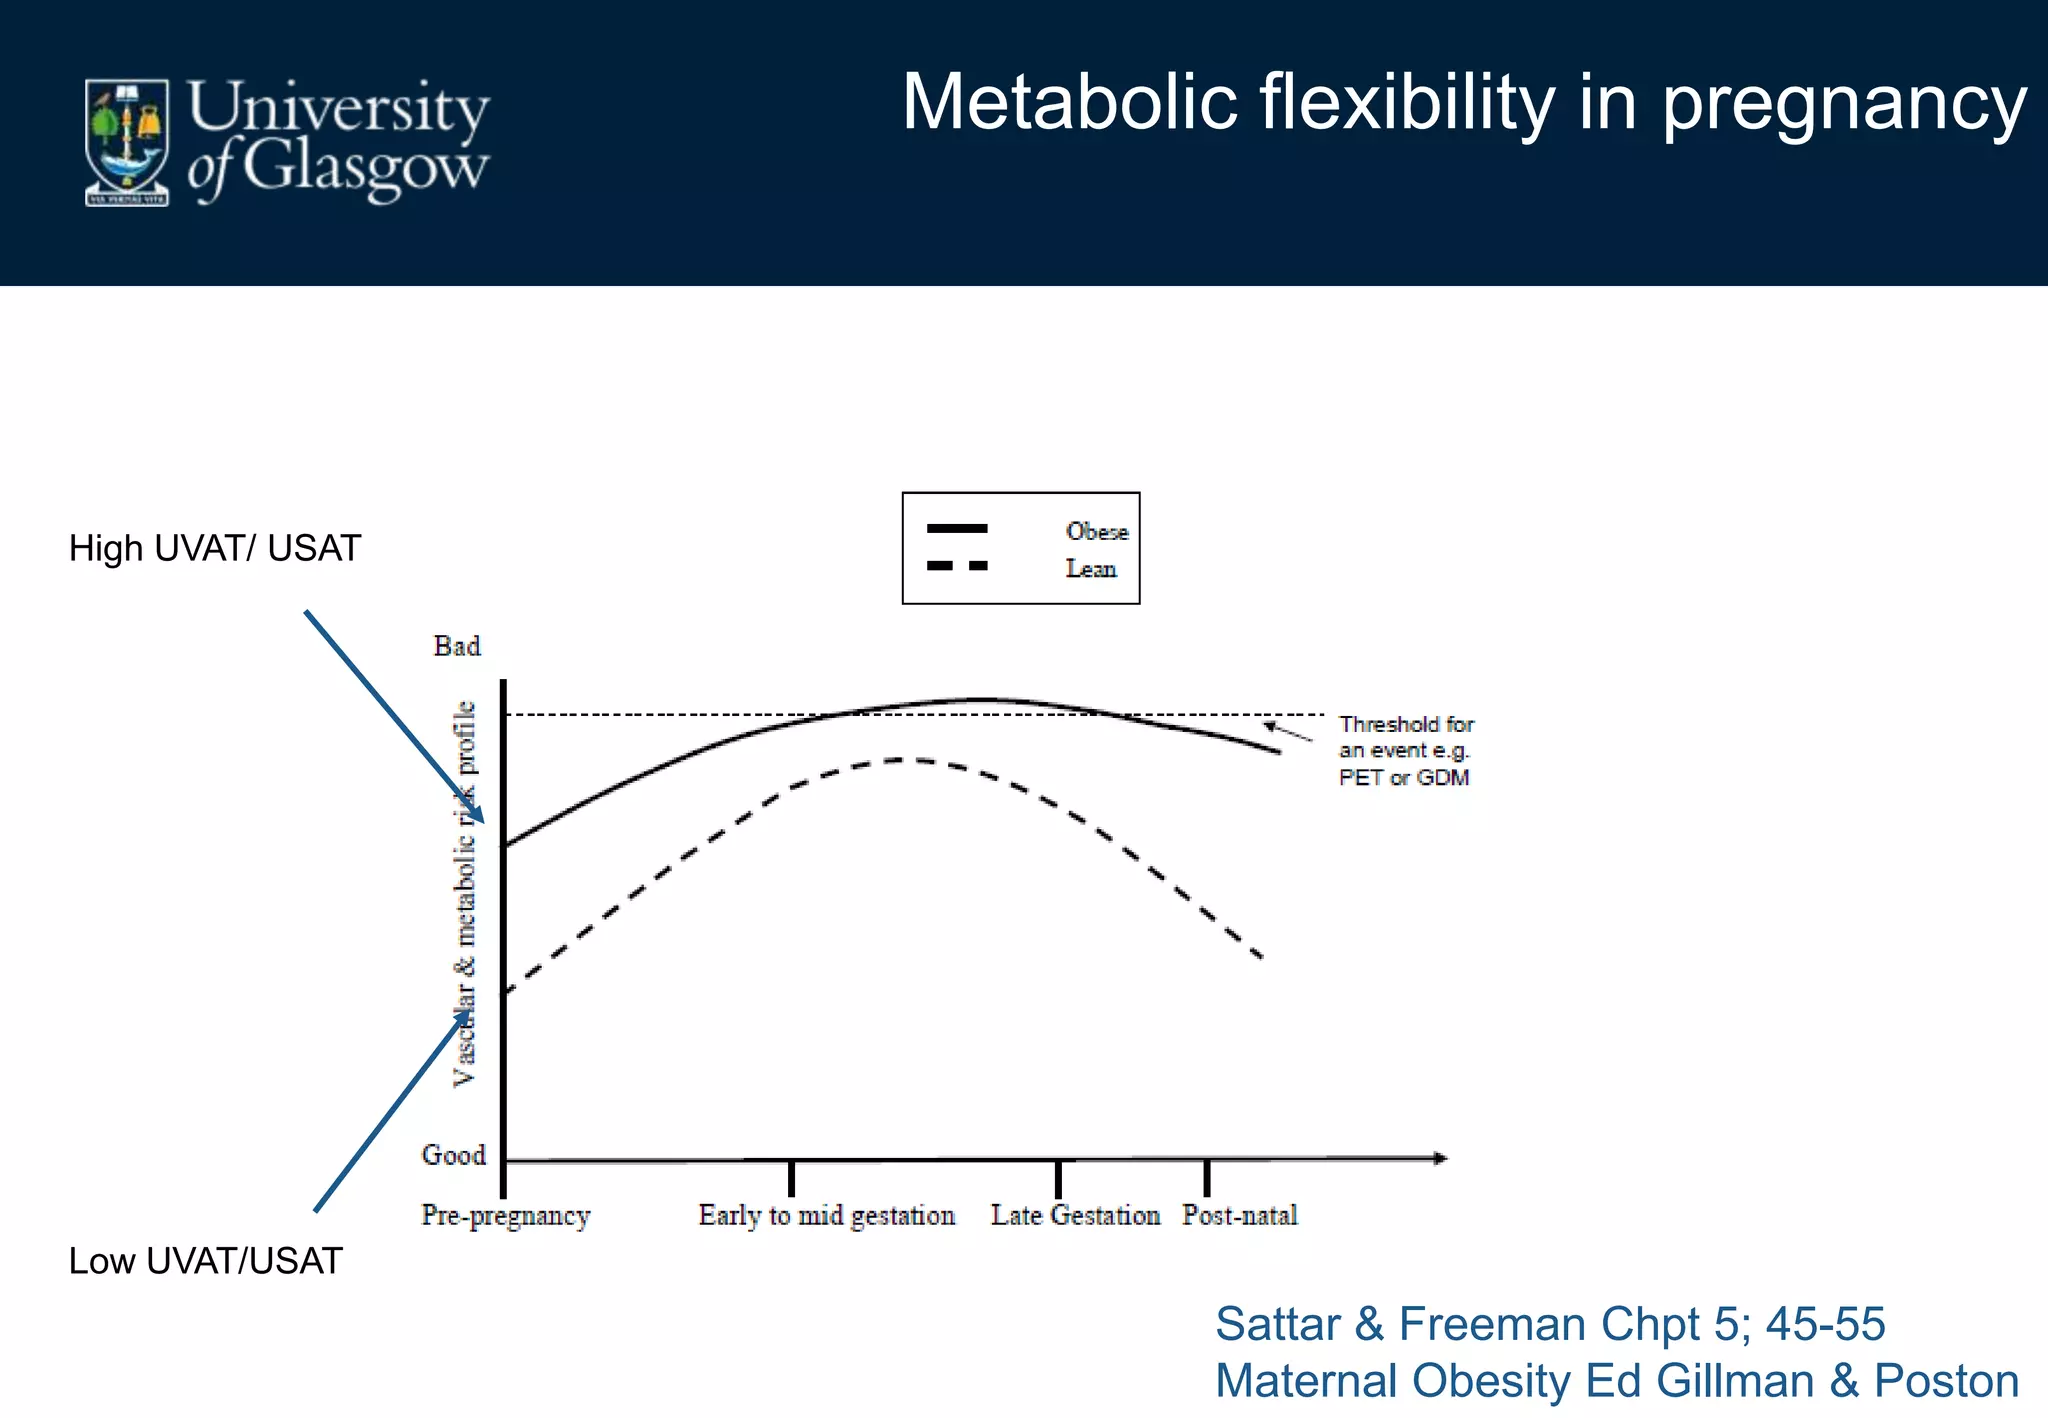
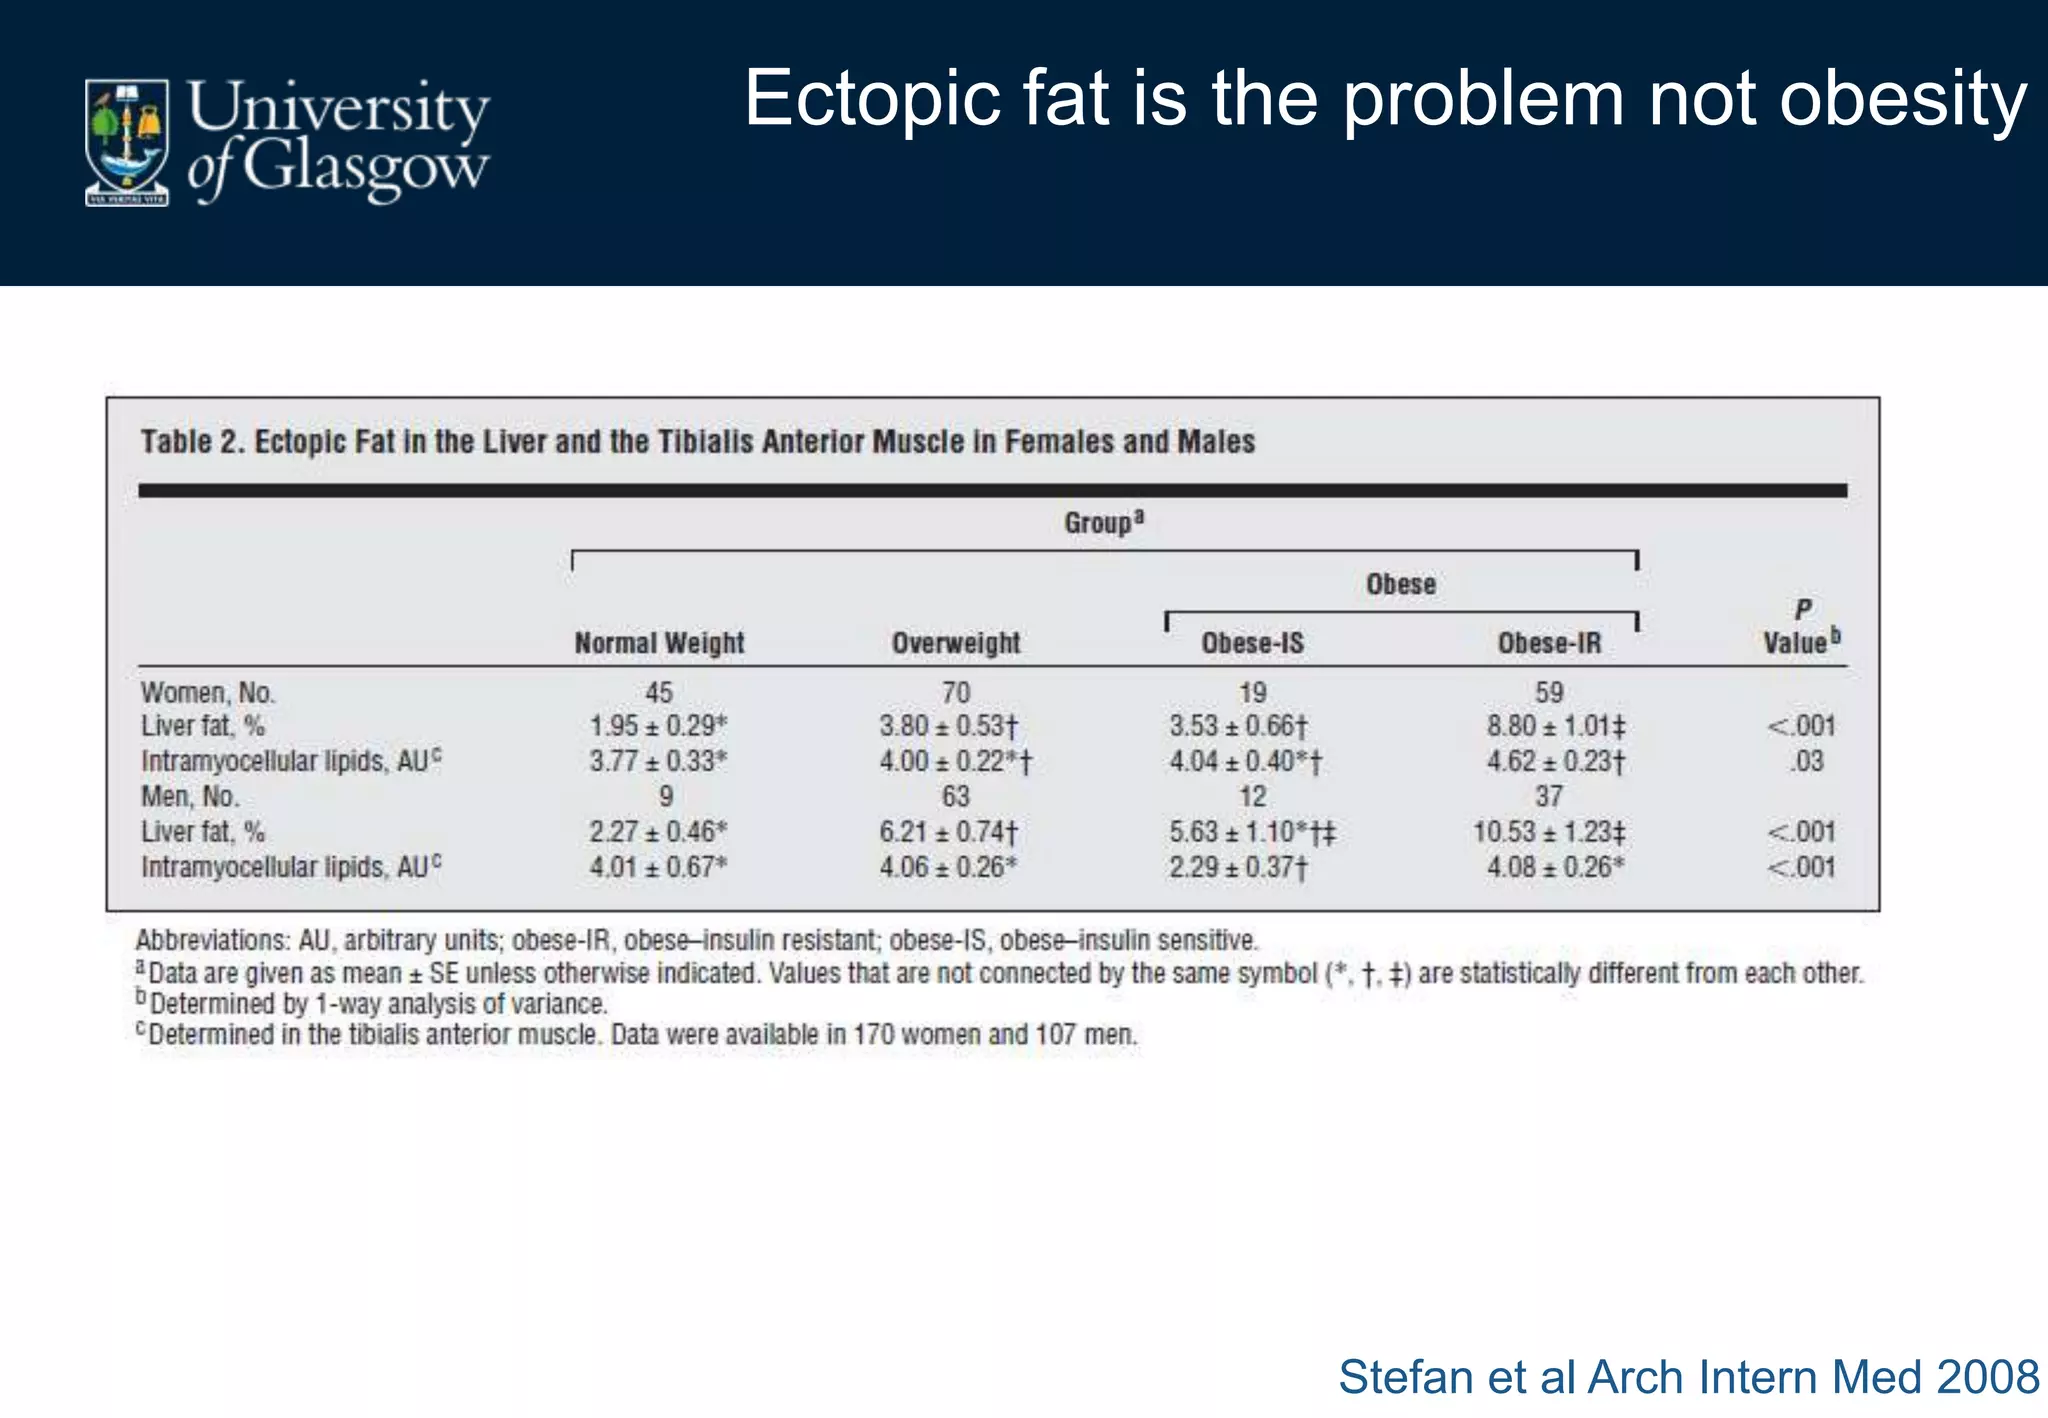
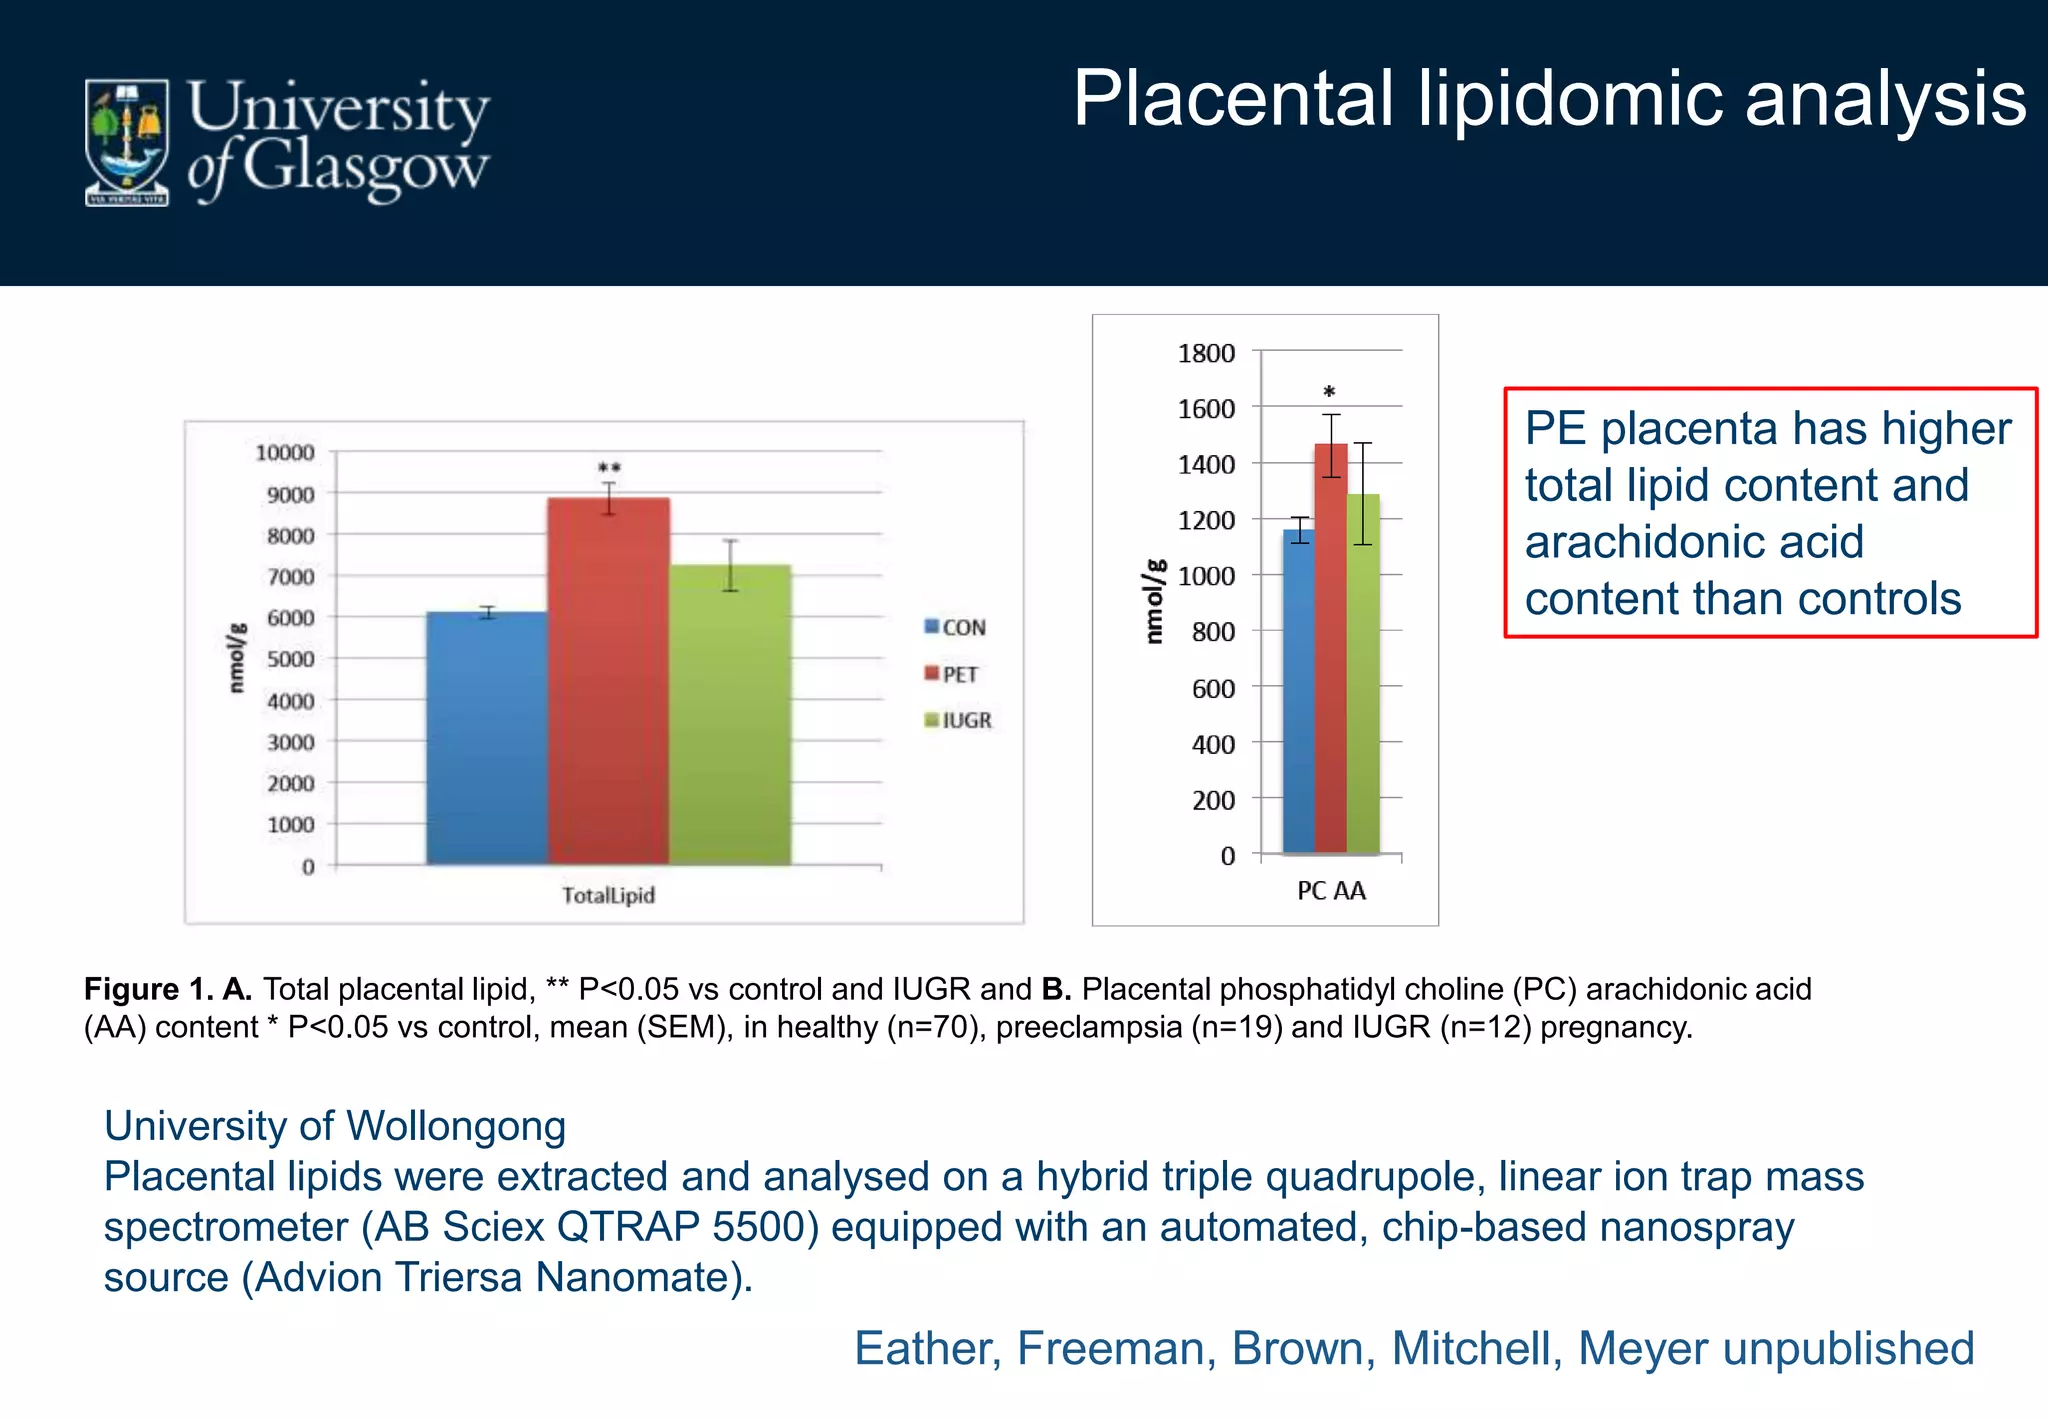
3. Conditions like preeclampsia are associated with ectopic fat deposition and impaired metabolic flexibility, suggesting inability to appropriately distribute and utilize fat stores during pregnancy.