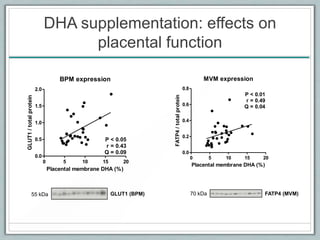
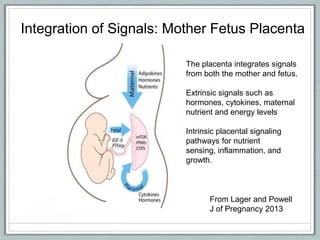
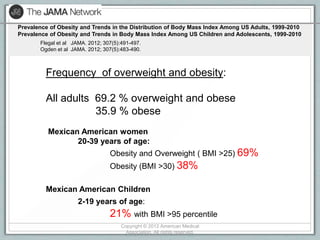
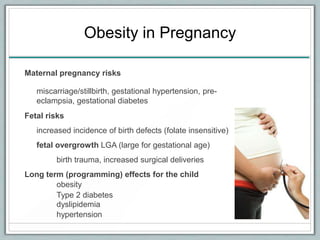
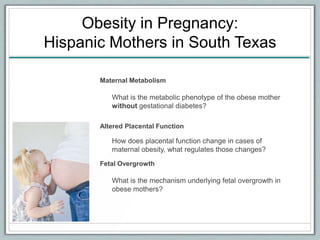
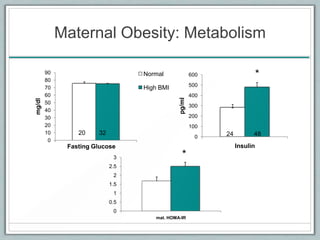
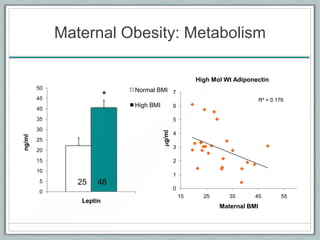
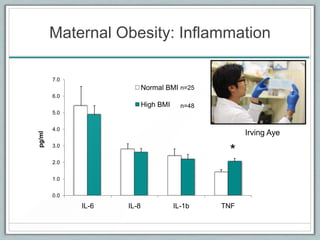
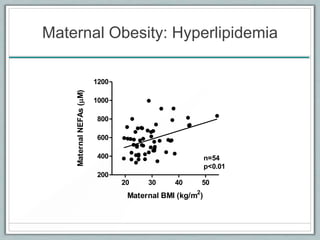
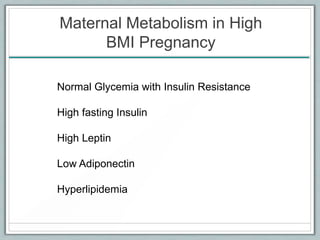
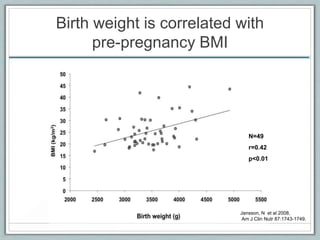
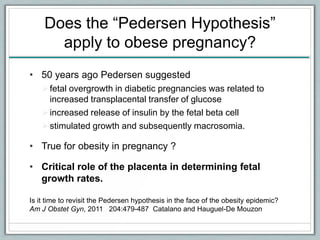
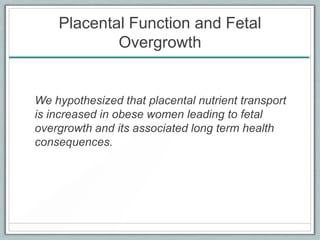
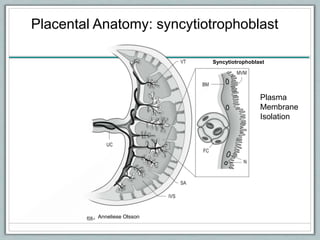
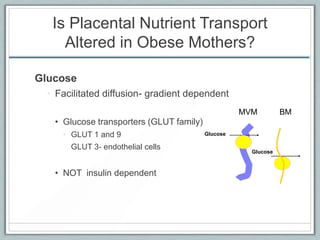
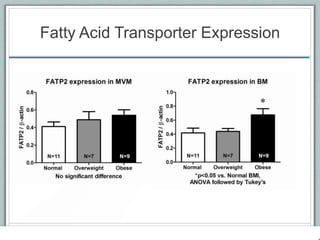
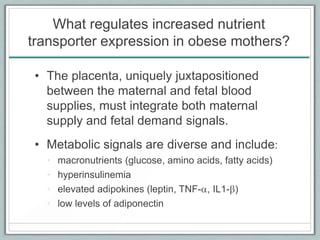
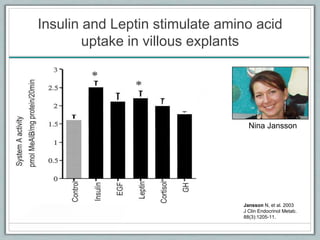
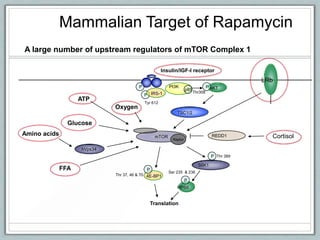
Maternal Obesity and
Placental Function
Theresa Powell, PhD
Center for Pregnancy and Newborn Research
Department of Obstetrics and Gynecology
University of Texas Health Science Center
San Antonio, Texas
Copyright © 2012 American Medical
Association. All rights reserved.
Prevalence of Obesity and Trends in the Distribution of Body Mass Index Among US Adults, 1999-2010
Prevalence of Obesity and Trends in Body Mass Index Among US Children and Adolescents, 1999-2010
Flegal et al JAMA. 2012; 307(5):491-497.
Ogden et al JAMA. 2012; 307(5):483-490.
Frequency of overweight and obesity:
All adults 69.2 % overweight and obese
35.9 % obese
Mexican American women
20-39 years of age:
Obesity and Overweight ( BMI >25) 69%
Obesity (BMI >30) 38%
Mexican American Children
2-19 years of age:
21% with BMI >95 percentile
Obesity in Pregnancy
Maternal pregnancy risks
miscarriage/stillbirth, gestational hypertension, pre-
eclampsia, gestational diabetes
Fetal risks
increased incidence of birth defects (folate insensitive)
fetal overgrowth LGA (large for gestational age)
birth trauma, increased surgical deliveries
Long term (programming) effects for the child
obesity
Type 2 diabetes
dyslipidemia
hypertension
Obesity in Pregnancy:
Hispanic Mothers in South Texas
Maternal Metabolism
What is the metabolic phenotype of the obese mother
without gestational diabetes?
Altered Placental Function
How does placental function change in cases of
maternal obesity, what regulates those changes?
Fetal Overgrowth
What is the mechanism underlying fetal overgrowth in
obese mothers?
Maternal Obesity: Metabolism
0
0.5
1
1.5
2
2.5
3
mat. HOMA-IR
0
100
200
300
400
500
600
Insulin
pg/ml
24 48
0
10
20
30
40
50
60
70
80
90
Mat Glu
mg/dl
Normal
High BMI
20 32
*
*
Fasting Glucose
Maternal Obesity: Metabolism
0
5
10
15
20
25
30
35
40
45
50
Leptin
ng/ml
Normal BMI
High BMI
* R² = 0.176
0
1
2
3
4
5
6
7
15 25 35 45 55
mg/ml
Maternal BMI
High Mol Wt Adiponectin
25 48
Maternal Obesity: Inflammation
0.0
1.0
2.0
3.0
4.0
5.0
6.0
7.0
IL-6 IL-8 IL-1b TNF
pg/ml
Normal BMI
High BMI
*
Irving Aye
n=25
n=48
Maternal Obesity: Hyperlipidemia
Maternal BMI (kg/m2
)
MaternalNEFAs(mM)
20 30 40 50
200
400
600
800
1000
1200
n=54
p<0.01
Maternal Metabolism in High
BMI Pregnancy
Normal Glycemia with Insulin Resistance
High fasting Insulin
High Leptin
Low Adiponectin
Hyperlipidemia
Birth weight is correlated with
pre-pregnancy BMI
N=49
r=0.42
p<0.01
Jansson, N et al 2008,
Am J Clin Nutr 87:1743-1749.
Does the “Pedersen Hypothesis”
apply to obese pregnancy?
• 50 years ago Pedersen suggested
fetal overgrowth in diabetic pregnancies was related to
increased transplacental transfer of glucose
increased release of insulin by the fetal beta cell
stimulated growth and subsequently macrosomia.
• True for obesity in pregnancy ?
• Critical role of the placenta in determining fetal
growth rates.
Is it time to revisit the Pedersen hypothesis in the face of the obesity epidemic?
Am J Obstet Gyn, 2011 204:479-487 Catalano and Hauguel-De Mouzon
Placental Function and Fetal
Overgrowth
We hypothesized that placental nutrient transport
is increased in obese women leading to fetal
overgrowth and its associated long term health
consequences.
Syncytiotrophoblast
Anneliese Olsson
Placental Anatomy: syncytiotrophoblast
Plasma
Membrane
Isolation
Is Placental Nutrient Transport
Altered in Obese Mothers?
Glucose
• Facilitated diffusion- gradient dependent
• Glucose transporters (GLUT family)
• GLUT 1 and 9
GLUT 3- endothelial cells
• NOT insulin dependent
Glucose
Glucose
MVM BM
N
orm
alB
M
I/A
G
A
H
igh
B
M
I/A
G
A
H
igh
B
M
I/>4000g
0.0
0.5
1.0
1.5
MVMGLUT1Density/TotalProtein(A.U.)
n=9 n=12n=12
55 KdGLUT 1
N
orm
alB
M
I/A
G
A
H
igh
B
M
I/A
G
A
H
igh
B
M
I/>4000g
0.0
0.2
0.4
0.6
BMGLUT1Density/TotalProtein(A.U.)
n=12 n=12n=9
55 KdGLUT 1
GLUT 1 Expression
MVM BM
BM GLUT 1 expression correlates
with birth weight
GLUT 1 BM
FetalBirthWeight(g)
0.0 0.2 0.4 0.6 0.8 1.0
2500
3000
3500
4000
4500
5000
n=33
r=0.37
p=0.03
Ome Acosta
Is Placental Nutrient Transport
Altered in Obese Mothers?
Amino Acids
• Multiple transport proteins are
• responsible for uptake and transfer
• of AAs
• Non-Essential AA: System A
• sodium dependent
• SNAT 1, 2 and 4
• Essential AA: System L
• exchanger
• LAT1 and LAT2, CD98
Na+
AA
Leucine
AA
MVM BM
System A Expression: MVM
SNAT2 SNAT4
n=10 n=12 n=10 n=12
System A activity correlates with
birth weight
0
20
40
60
80
100
120
140
2700 3200 3700 4200
MVMMeAIBuptake
pmol/mgx30s
Birth weight (g)
N=21
R=0.60
P<0.001
Is Placental Nutrient Transport
Altered in Obese Mothers?
Fatty Acids
Multi-step process
• Lipase activity to release
fatty acids from TG
Uptake by fatty acids transport proteins
• Bound in the cytoplasm by
• fatty acid binding proteins
• Released to the fetal circulation.
TG
FATP
MVM BM
LPL
FAs
FATP
Fatty Acid Transporter Expression
What regulates increased nutrient
transporter expression in obese mothers?
• The placenta, uniquely juxtapositioned
between the maternal and fetal blood
supplies, must integrate both maternal
supply and fetal demand signals.
• Metabolic signals are diverse and include:
• macronutrients (glucose, amino acids, fatty acids)
• hyperinsulinemia
• elevated adipokines (leptin, TNF-a, IL1-b)
• low levels of adiponectin
Insulin and Leptin stimulate amino acid
uptake in villous explants
Jansson N, et al. 2003
J Clin Endocrinol Metab.
88(3):1205-11.
Nina Jansson
Mammalian Target of Rapamycin
A large number of upstream regulators of mTOR Complex 1
mTOR
Raptor
S6K1
Thr 389P
RPS6
P
Translation
4E-BP1
P
Thr 37, 46 & 70
Ser 235 & 236
Insulin/IGF-I receptor
P
AKT
IRS-1
PI3KP
p85
hVps34
TSC1/2
Glucose
Amino acids
ATP
Oxygen
Tyr 612
P
Thr308
FFA
LRb
CortisolREDD1
mTOR and placental amino acid
transport
Rosario FJ et al
J Physiol. 2013
Placental mTOR
0
50
100
150
200
250
300
P-4EBP36/47 P-4EBP70 P-RS6
RelativeDensitometry
Normal
High BMI
*
*
Francesca Gaccioli
Toll like Receptor 4
SFA and MUFA
Pro-Inflammatory
Response
LPS
Oleic acid stimulates amino acid
uptake through a TLR4 mechanism
Lager S, et al .
J Lipid Res. 2013
Susanne Lager
0
1
2
3
4
5
6
0 0.002 0.02 0.2
[TNF-a] ng/ml
MeAIBuptakepmol/mg/min
ANOVA p=0.004 n = 6 for each concentration
**
**
Amino acid uptake is stimulated by TNF-a
in primary cultured trophoblast cells
TNF-a
Jones et al, 2009
Am J Physiol, Cell Physiol
297:1228-1235.
Helen Jones
Effects of SFA, MUFA and LCPUFA on trophoblast
amino acid uptake
Study participants (n=35):
• Obese (≥30 kg/m2) pre-pregnancy BMI.
• Singleton pregnancies.
• Exclusion criteria: concurrent inflammatory, vascular, or metabolic disease (such as
diabetes, pre-eclampsia), tobacco or street drug use, high usual intake of DHA.
Recruitment
Study visit 1:
Enrollment/baseline
26 weeks 32 weeks
Study visit 2:
Compliance
36 weeks
Study visit 3:
Compliance
Placenta
collection and
analysis
Term
800 mg/day DHA or Placebo
DHA Supplementation in Obese
Mothers: Study Design
DHA supplementation in obese
pregnant women
0
2
4
6
8
10
12
PercentoftotalFA
SV1 SV3 SV1 SV3
Placebo DHA
*
DHA supplementation: effects on
placental function
DHA supplementation: effects on
placental function
MVM expression
Placental membrane DHA (%)
FATP4/totalprotein
0 5 10 15 20
0.0
0.2
0.4
0.6
0.8
P < 0.01
r = 0.49
Q = 0.04
BPM expression
Placental membrane DHA (%)
GLUT1/totalprotein
0 5 10 15 20
0.0
0.5
1.0
1.5
2.0
P < 0.05
r = 0.43
Q = 0.09
GLUT1 (BPM) FATP4 (MVM)70 kDa55 kDa
Fatty Acids and Placental Function
• We have demonstrated that saturated and
monounsaturated fatty acids stimulate
trophoblast System A amino acid uptake in a
TLR4 dependent manner.
• Omega3 long chain polyunsaturated fatty acids
inhibit amino acid uptake by System A.
• DHA supplementation modulates placental
nutrient transport capacity in obese mothers.
Jansson N et al 2008, Am J Clin Nutr 87:1743-1749.
r = -0.592, p<0.001
Maternal adiponectin, placental function and
fetal growth
Hypothesis: Maternal adiponectin
down-regulates placental nutrient
transport and inhibit fetal growth.
Jones HN et al., 2010, Diabetes 59:1161-1170
N=6, ANOVA<0.
05
0
2
4
6
8
10
12
14
16
18
20
C I IAd Ad
SystemAactivity
pmmo;/mg/min
*
Chronic maternal infusion adiponectin in
pregnant mice
Infusion (mini-osmotic pump) of full length adiponectin
Gestational days 14.5-18.5 in mice
Decreased pup weight ( -20%)
Decreased placental amino acid transport
0
40
80
120
System A
SystemAuptake
pmol/mgprotein/15sec
*
0
0.1
0.2
0.3
0.4
0.5
0.6
System L
SystemLuptake
pmol/mgprotein/15sec
C A
*
Rosario et al 2012 J Physiol 590:1495-1509
Adiponectin in Pregnancy
Adiponectin is insulin sensitizing in adult tissues
but causes insulin resistance in placenta.
Adiponectin is high in lean women and acts to
inhibit placental insulin signaling. This would tend
to decrease amino acid uptake in normal healthy
pregnancies.
Obese women have low adiponectin which would
promote insulin stimulated amino acid transfer
across the placenta.
High BMI
Higher fasting insulin, leptin, cytokines
Low adiponectin
Hyperlipidemia –SFA and MUFA
Low omega3 LCPUFA
Maternal metabolic
factors stimulate the
placenta to transport
nutrients
Increased nutrient
delivery to the fetus
stimulates growth
through insulin release
Omega3 LCPUFA
From Lager and Powell
J of Pregnancy 2013
Integration of Signals: Mother Fetus Placenta
The placenta integrates signals
from both the mother and fetus.
Extrinsic signals such as
hormones, cytokines, maternal
nutrient and energy levels
Intrinsic placental signaling
pathways for nutrient
sensing, inflammation, and
growth.
Obesity, Placenta and Developmental Programming
Understanding the complex placental signaling
pathways that lead to alterations in fetal growth will
allow for the development of strategies to prevent
short- and long-term health consequences of
pathological fetal growth.
Thank you!
to the mothers and babies University Hospital in San Antonio
Thomas Jansson
Post Docs, Fellows
and students
Our funding sources:
Swedish Research Council
NOVO Nordiska
NIH NHLBI R21HL093532
CTSA UL1RR025767
Mike Hogg Fund
NIH NIDDK RO1 DK89989
NIH NICHD R03 HD058030
NIH NICHD R01 HD058045

Powell o&p2013

  • 1.
    Maternal Obesity and PlacentalFunction Theresa Powell, PhD Center for Pregnancy and Newborn Research Department of Obstetrics and Gynecology University of Texas Health Science Center San Antonio, Texas
  • 2.
    Copyright © 2012American Medical Association. All rights reserved. Prevalence of Obesity and Trends in the Distribution of Body Mass Index Among US Adults, 1999-2010 Prevalence of Obesity and Trends in Body Mass Index Among US Children and Adolescents, 1999-2010 Flegal et al JAMA. 2012; 307(5):491-497. Ogden et al JAMA. 2012; 307(5):483-490. Frequency of overweight and obesity: All adults 69.2 % overweight and obese 35.9 % obese Mexican American women 20-39 years of age: Obesity and Overweight ( BMI >25) 69% Obesity (BMI >30) 38% Mexican American Children 2-19 years of age: 21% with BMI >95 percentile
  • 3.
    Obesity in Pregnancy Maternalpregnancy risks miscarriage/stillbirth, gestational hypertension, pre- eclampsia, gestational diabetes Fetal risks increased incidence of birth defects (folate insensitive) fetal overgrowth LGA (large for gestational age) birth trauma, increased surgical deliveries Long term (programming) effects for the child obesity Type 2 diabetes dyslipidemia hypertension
  • 4.
    Obesity in Pregnancy: HispanicMothers in South Texas Maternal Metabolism What is the metabolic phenotype of the obese mother without gestational diabetes? Altered Placental Function How does placental function change in cases of maternal obesity, what regulates those changes? Fetal Overgrowth What is the mechanism underlying fetal overgrowth in obese mothers?
  • 5.
    Maternal Obesity: Metabolism 0 0.5 1 1.5 2 2.5 3 mat.HOMA-IR 0 100 200 300 400 500 600 Insulin pg/ml 24 48 0 10 20 30 40 50 60 70 80 90 Mat Glu mg/dl Normal High BMI 20 32 * * Fasting Glucose
  • 6.
    Maternal Obesity: Metabolism 0 5 10 15 20 25 30 35 40 45 50 Leptin ng/ml NormalBMI High BMI * R² = 0.176 0 1 2 3 4 5 6 7 15 25 35 45 55 mg/ml Maternal BMI High Mol Wt Adiponectin 25 48
  • 7.
    Maternal Obesity: Inflammation 0.0 1.0 2.0 3.0 4.0 5.0 6.0 7.0 IL-6IL-8 IL-1b TNF pg/ml Normal BMI High BMI * Irving Aye n=25 n=48
  • 8.
    Maternal Obesity: Hyperlipidemia MaternalBMI (kg/m2 ) MaternalNEFAs(mM) 20 30 40 50 200 400 600 800 1000 1200 n=54 p<0.01
  • 9.
    Maternal Metabolism inHigh BMI Pregnancy Normal Glycemia with Insulin Resistance High fasting Insulin High Leptin Low Adiponectin Hyperlipidemia
  • 10.
    Birth weight iscorrelated with pre-pregnancy BMI N=49 r=0.42 p<0.01 Jansson, N et al 2008, Am J Clin Nutr 87:1743-1749.
  • 11.
    Does the “PedersenHypothesis” apply to obese pregnancy? • 50 years ago Pedersen suggested fetal overgrowth in diabetic pregnancies was related to increased transplacental transfer of glucose increased release of insulin by the fetal beta cell stimulated growth and subsequently macrosomia. • True for obesity in pregnancy ? • Critical role of the placenta in determining fetal growth rates. Is it time to revisit the Pedersen hypothesis in the face of the obesity epidemic? Am J Obstet Gyn, 2011 204:479-487 Catalano and Hauguel-De Mouzon
  • 12.
    Placental Function andFetal Overgrowth We hypothesized that placental nutrient transport is increased in obese women leading to fetal overgrowth and its associated long term health consequences.
  • 13.
    Syncytiotrophoblast Anneliese Olsson Placental Anatomy:syncytiotrophoblast Plasma Membrane Isolation
  • 14.
    Is Placental NutrientTransport Altered in Obese Mothers? Glucose • Facilitated diffusion- gradient dependent • Glucose transporters (GLUT family) • GLUT 1 and 9 GLUT 3- endothelial cells • NOT insulin dependent Glucose Glucose MVM BM
  • 15.
    N orm alB M I/A G A H igh B M I/A G A H igh B M I/>4000g 0.0 0.5 1.0 1.5 MVMGLUT1Density/TotalProtein(A.U.) n=9 n=12n=12 55 KdGLUT1 N orm alB M I/A G A H igh B M I/A G A H igh B M I/>4000g 0.0 0.2 0.4 0.6 BMGLUT1Density/TotalProtein(A.U.) n=12 n=12n=9 55 KdGLUT 1 GLUT 1 Expression MVM BM
  • 16.
    BM GLUT 1expression correlates with birth weight GLUT 1 BM FetalBirthWeight(g) 0.0 0.2 0.4 0.6 0.8 1.0 2500 3000 3500 4000 4500 5000 n=33 r=0.37 p=0.03 Ome Acosta
  • 17.
    Is Placental NutrientTransport Altered in Obese Mothers? Amino Acids • Multiple transport proteins are • responsible for uptake and transfer • of AAs • Non-Essential AA: System A • sodium dependent • SNAT 1, 2 and 4 • Essential AA: System L • exchanger • LAT1 and LAT2, CD98 Na+ AA Leucine AA MVM BM
  • 18.
    System A Expression:MVM SNAT2 SNAT4 n=10 n=12 n=10 n=12
  • 19.
    System A activitycorrelates with birth weight 0 20 40 60 80 100 120 140 2700 3200 3700 4200 MVMMeAIBuptake pmol/mgx30s Birth weight (g) N=21 R=0.60 P<0.001
  • 20.
    Is Placental NutrientTransport Altered in Obese Mothers? Fatty Acids Multi-step process • Lipase activity to release fatty acids from TG Uptake by fatty acids transport proteins • Bound in the cytoplasm by • fatty acid binding proteins • Released to the fetal circulation. TG FATP MVM BM LPL FAs FATP
  • 21.
  • 22.
    What regulates increasednutrient transporter expression in obese mothers? • The placenta, uniquely juxtapositioned between the maternal and fetal blood supplies, must integrate both maternal supply and fetal demand signals. • Metabolic signals are diverse and include: • macronutrients (glucose, amino acids, fatty acids) • hyperinsulinemia • elevated adipokines (leptin, TNF-a, IL1-b) • low levels of adiponectin
  • 23.
    Insulin and Leptinstimulate amino acid uptake in villous explants Jansson N, et al. 2003 J Clin Endocrinol Metab. 88(3):1205-11. Nina Jansson
  • 24.
    Mammalian Target ofRapamycin A large number of upstream regulators of mTOR Complex 1 mTOR Raptor S6K1 Thr 389P RPS6 P Translation 4E-BP1 P Thr 37, 46 & 70 Ser 235 & 236 Insulin/IGF-I receptor P AKT IRS-1 PI3KP p85 hVps34 TSC1/2 Glucose Amino acids ATP Oxygen Tyr 612 P Thr308 FFA LRb CortisolREDD1
  • 25.
    mTOR and placentalamino acid transport Rosario FJ et al J Physiol. 2013
  • 26.
    Placental mTOR 0 50 100 150 200 250 300 P-4EBP36/47 P-4EBP70P-RS6 RelativeDensitometry Normal High BMI * * Francesca Gaccioli
  • 27.
    Toll like Receptor4 SFA and MUFA Pro-Inflammatory Response LPS
  • 28.
    Oleic acid stimulatesamino acid uptake through a TLR4 mechanism Lager S, et al . J Lipid Res. 2013 Susanne Lager
  • 29.
    0 1 2 3 4 5 6 0 0.002 0.020.2 [TNF-a] ng/ml MeAIBuptakepmol/mg/min ANOVA p=0.004 n = 6 for each concentration ** ** Amino acid uptake is stimulated by TNF-a in primary cultured trophoblast cells TNF-a Jones et al, 2009 Am J Physiol, Cell Physiol 297:1228-1235. Helen Jones
  • 30.
    Effects of SFA,MUFA and LCPUFA on trophoblast amino acid uptake
  • 31.
    Study participants (n=35): •Obese (≥30 kg/m2) pre-pregnancy BMI. • Singleton pregnancies. • Exclusion criteria: concurrent inflammatory, vascular, or metabolic disease (such as diabetes, pre-eclampsia), tobacco or street drug use, high usual intake of DHA. Recruitment Study visit 1: Enrollment/baseline 26 weeks 32 weeks Study visit 2: Compliance 36 weeks Study visit 3: Compliance Placenta collection and analysis Term 800 mg/day DHA or Placebo DHA Supplementation in Obese Mothers: Study Design
  • 32.
    DHA supplementation inobese pregnant women 0 2 4 6 8 10 12 PercentoftotalFA SV1 SV3 SV1 SV3 Placebo DHA *
  • 33.
    DHA supplementation: effectson placental function
  • 34.
    DHA supplementation: effectson placental function MVM expression Placental membrane DHA (%) FATP4/totalprotein 0 5 10 15 20 0.0 0.2 0.4 0.6 0.8 P < 0.01 r = 0.49 Q = 0.04 BPM expression Placental membrane DHA (%) GLUT1/totalprotein 0 5 10 15 20 0.0 0.5 1.0 1.5 2.0 P < 0.05 r = 0.43 Q = 0.09 GLUT1 (BPM) FATP4 (MVM)70 kDa55 kDa
  • 35.
    Fatty Acids andPlacental Function • We have demonstrated that saturated and monounsaturated fatty acids stimulate trophoblast System A amino acid uptake in a TLR4 dependent manner. • Omega3 long chain polyunsaturated fatty acids inhibit amino acid uptake by System A. • DHA supplementation modulates placental nutrient transport capacity in obese mothers.
  • 36.
    Jansson N etal 2008, Am J Clin Nutr 87:1743-1749. r = -0.592, p<0.001 Maternal adiponectin, placental function and fetal growth Hypothesis: Maternal adiponectin down-regulates placental nutrient transport and inhibit fetal growth. Jones HN et al., 2010, Diabetes 59:1161-1170 N=6, ANOVA<0. 05 0 2 4 6 8 10 12 14 16 18 20 C I IAd Ad SystemAactivity pmmo;/mg/min *
  • 37.
    Chronic maternal infusionadiponectin in pregnant mice Infusion (mini-osmotic pump) of full length adiponectin Gestational days 14.5-18.5 in mice Decreased pup weight ( -20%) Decreased placental amino acid transport 0 40 80 120 System A SystemAuptake pmol/mgprotein/15sec * 0 0.1 0.2 0.3 0.4 0.5 0.6 System L SystemLuptake pmol/mgprotein/15sec C A * Rosario et al 2012 J Physiol 590:1495-1509
  • 38.
    Adiponectin in Pregnancy Adiponectinis insulin sensitizing in adult tissues but causes insulin resistance in placenta. Adiponectin is high in lean women and acts to inhibit placental insulin signaling. This would tend to decrease amino acid uptake in normal healthy pregnancies. Obese women have low adiponectin which would promote insulin stimulated amino acid transfer across the placenta.
  • 39.
    High BMI Higher fastinginsulin, leptin, cytokines Low adiponectin Hyperlipidemia –SFA and MUFA Low omega3 LCPUFA Maternal metabolic factors stimulate the placenta to transport nutrients Increased nutrient delivery to the fetus stimulates growth through insulin release Omega3 LCPUFA
  • 40.
    From Lager andPowell J of Pregnancy 2013 Integration of Signals: Mother Fetus Placenta The placenta integrates signals from both the mother and fetus. Extrinsic signals such as hormones, cytokines, maternal nutrient and energy levels Intrinsic placental signaling pathways for nutrient sensing, inflammation, and growth.
  • 41.
    Obesity, Placenta andDevelopmental Programming Understanding the complex placental signaling pathways that lead to alterations in fetal growth will allow for the development of strategies to prevent short- and long-term health consequences of pathological fetal growth.
  • 42.
    Thank you! to themothers and babies University Hospital in San Antonio Thomas Jansson Post Docs, Fellows and students Our funding sources: Swedish Research Council NOVO Nordiska NIH NHLBI R21HL093532 CTSA UL1RR025767 Mike Hogg Fund NIH NIDDK RO1 DK89989 NIH NICHD R03 HD058030 NIH NICHD R01 HD058045

Editor's Notes

  • #32 For this study we enrolled pregnant women, who were obese when entering pregnancy, and they were randomized to either placebo or 800 mg/day DHA. There were three study visits, at enrollment at 26 weeks gestation, the next visit at 32 weeks gestation, and finally near term at 36 weeks gestation. At delivery we collected the placentas for analysis. Company MARTEK (lif’s DHA). The placebo was a mixture of corn/soy bean oil. The DHA was of a non-fish source. Four tablets á 200 mg/day.