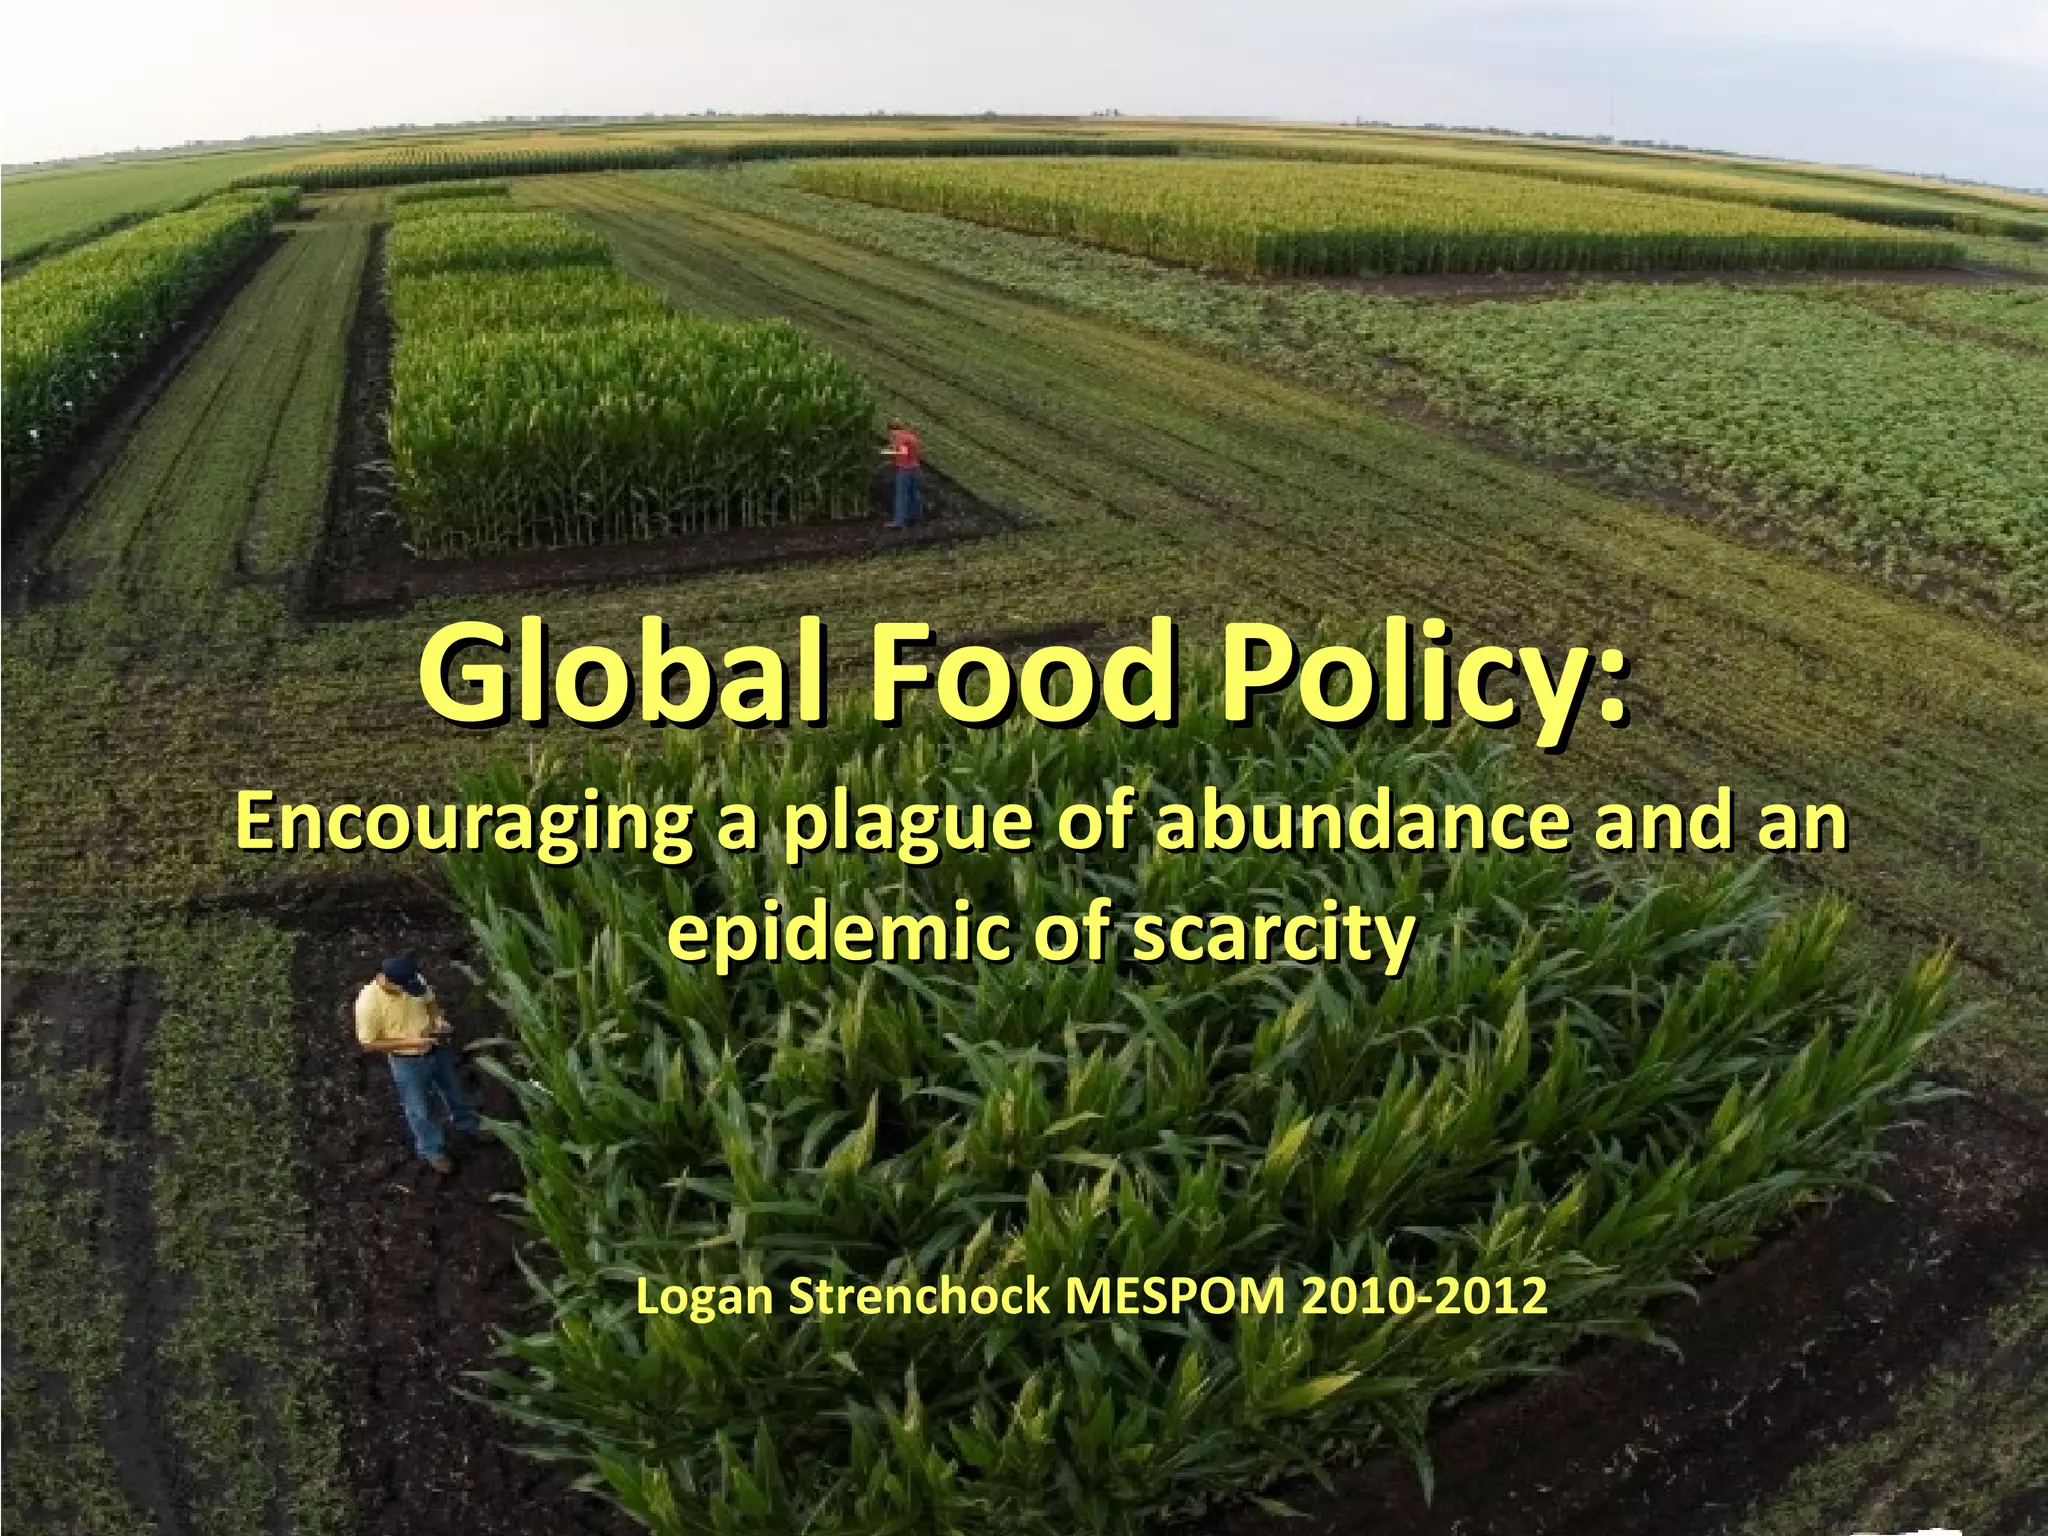
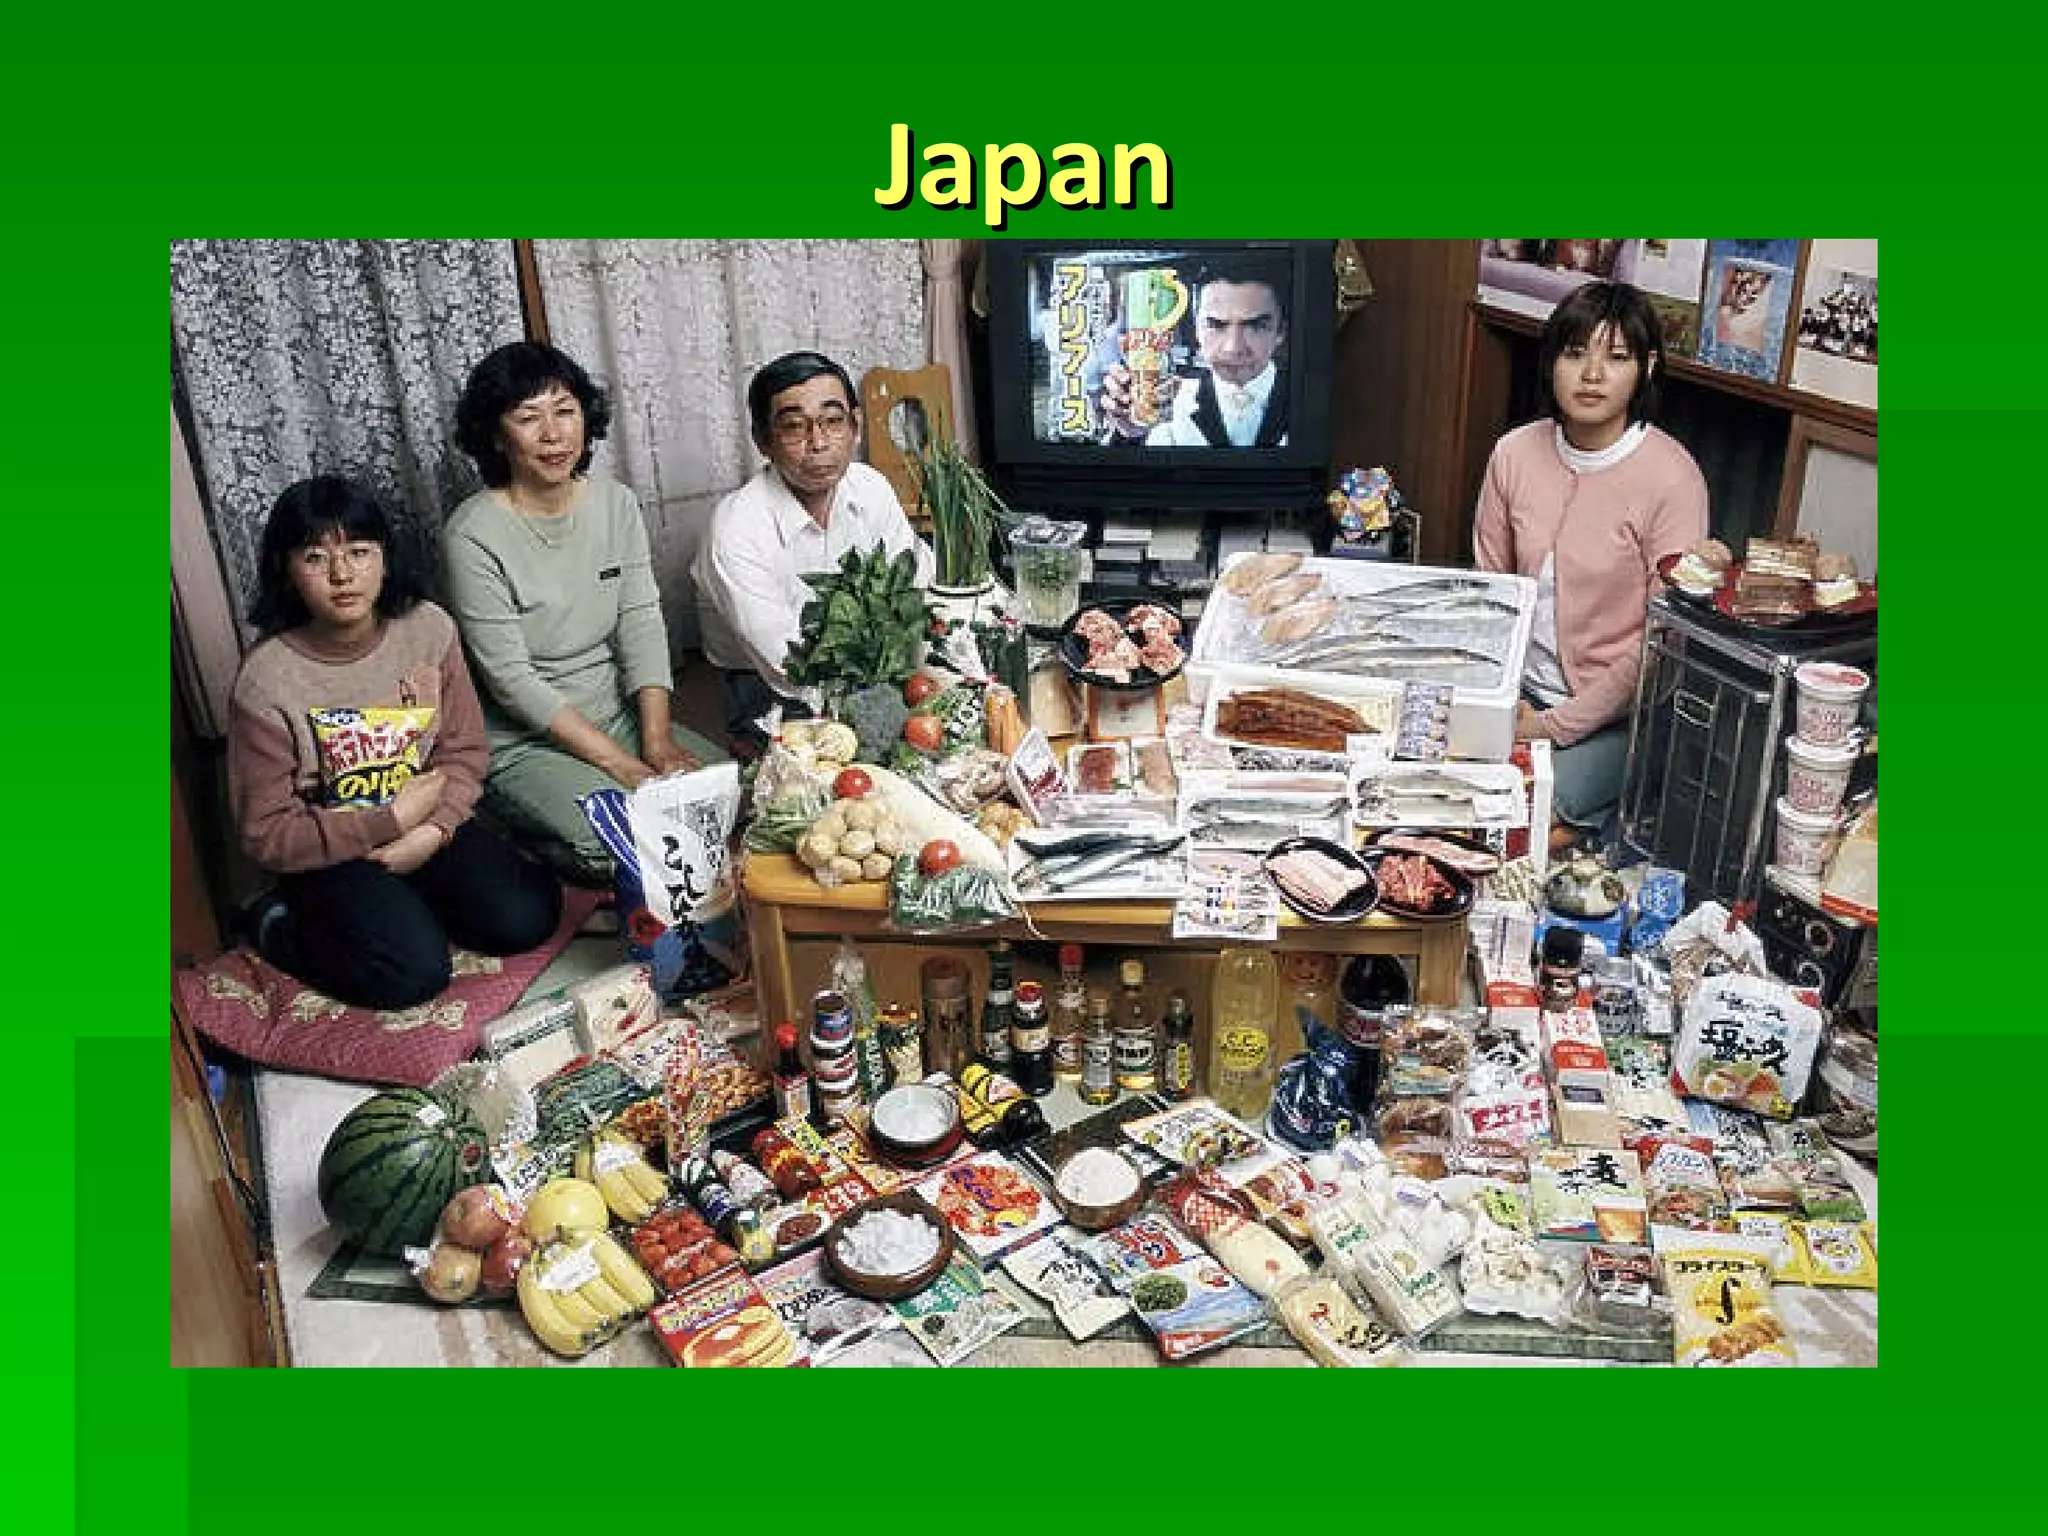
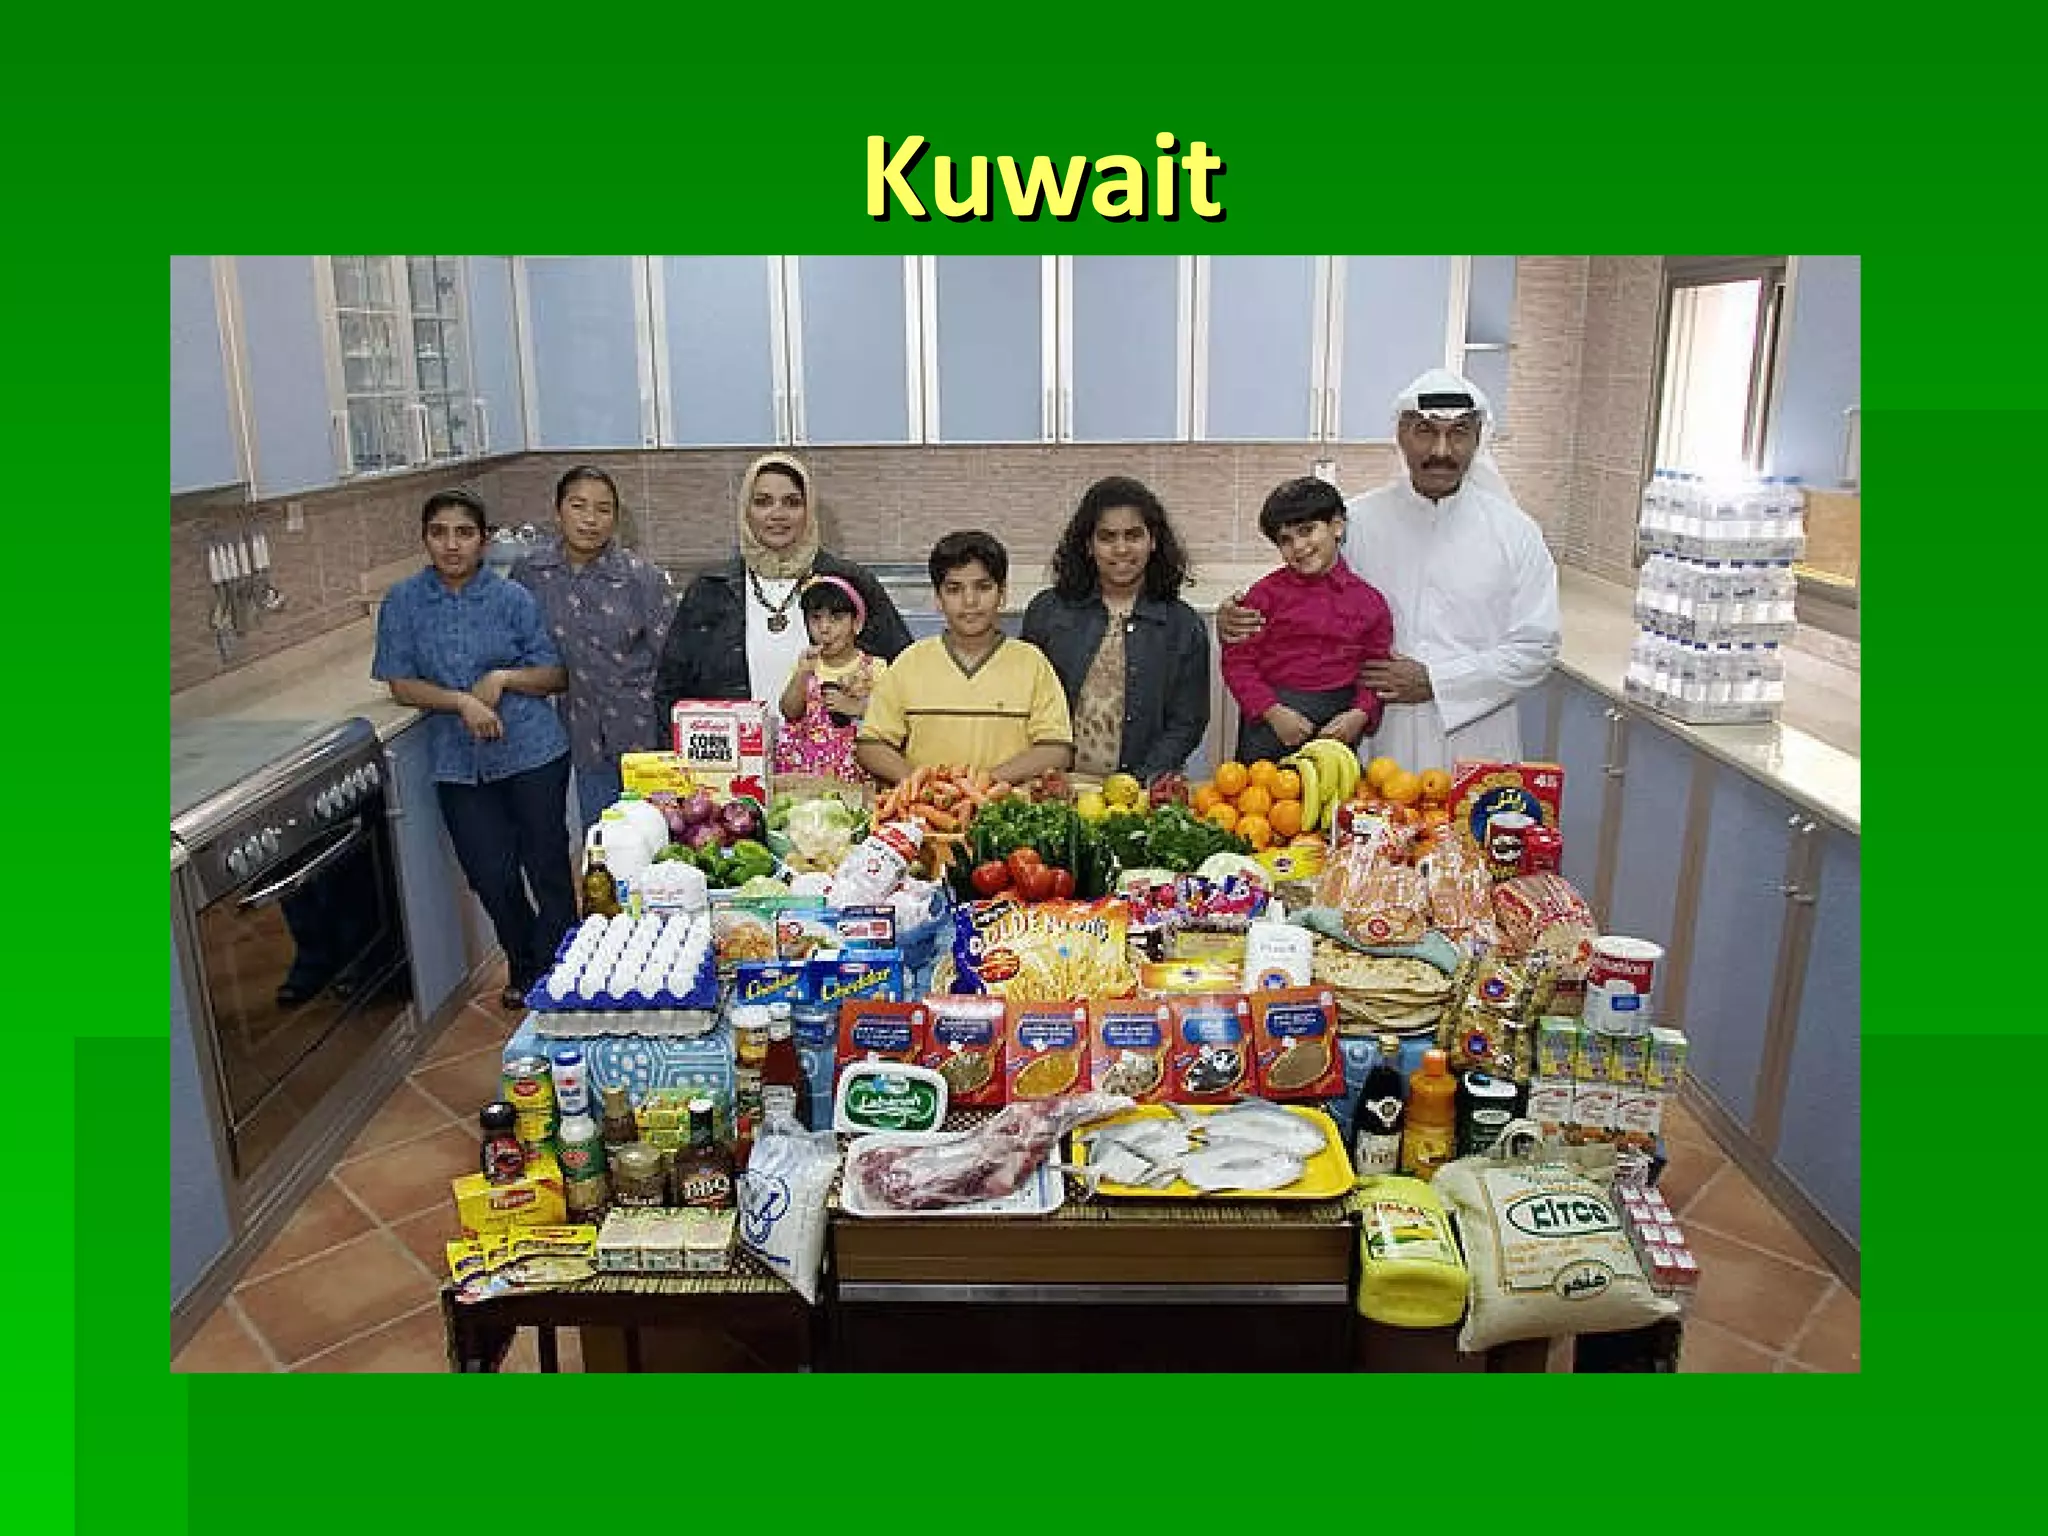
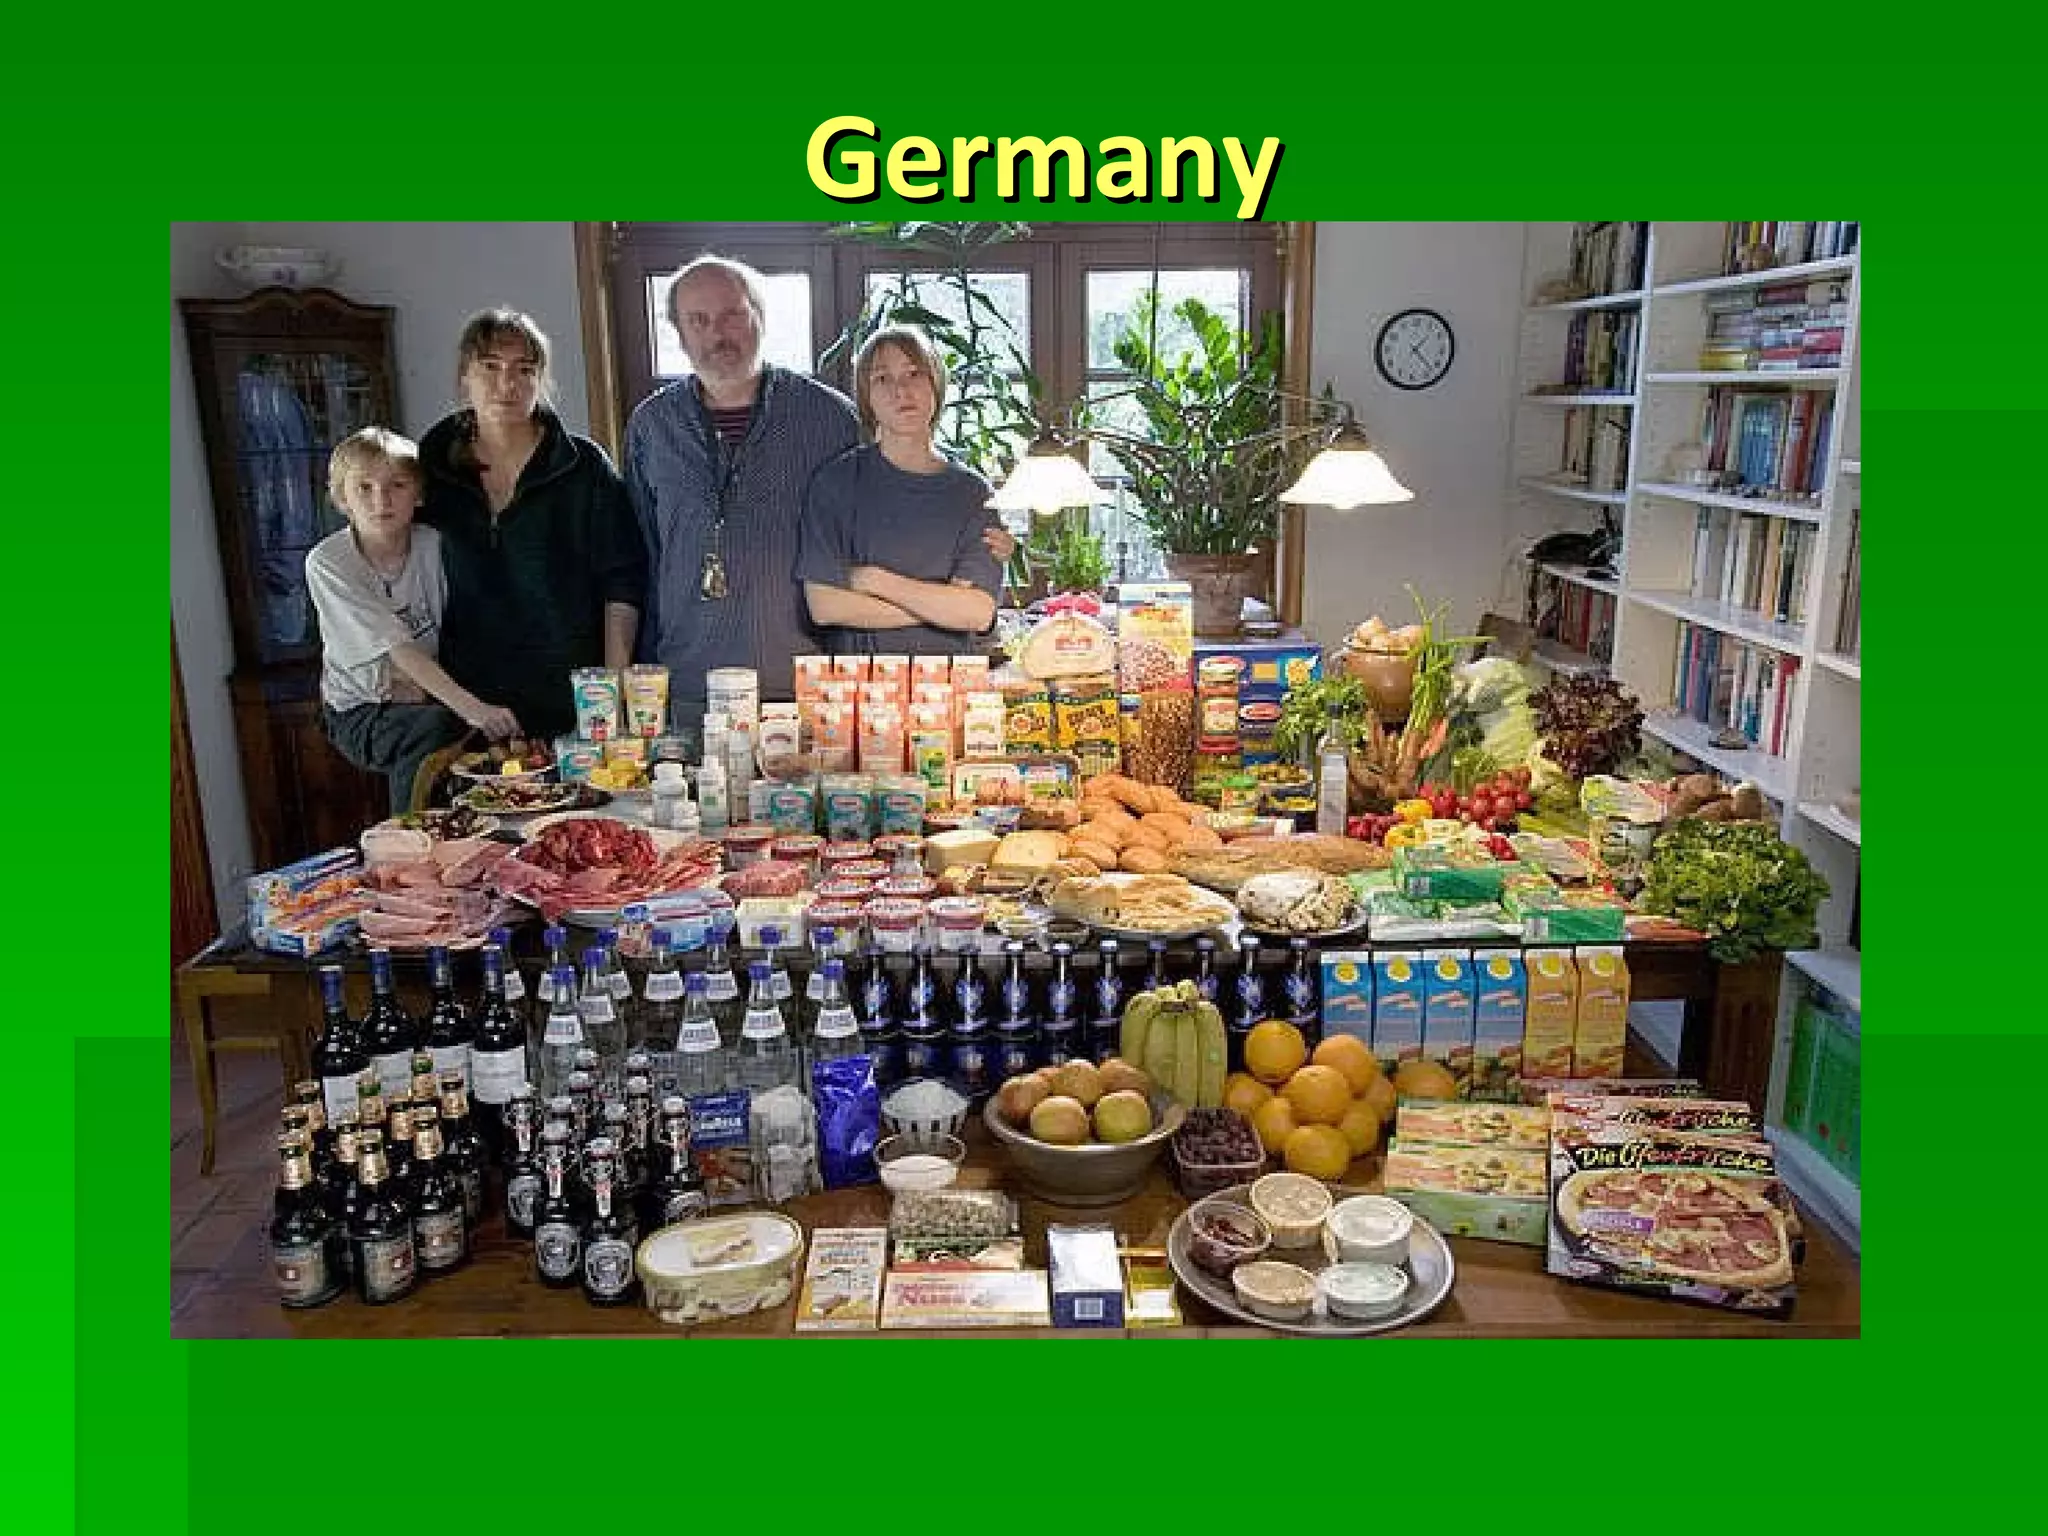
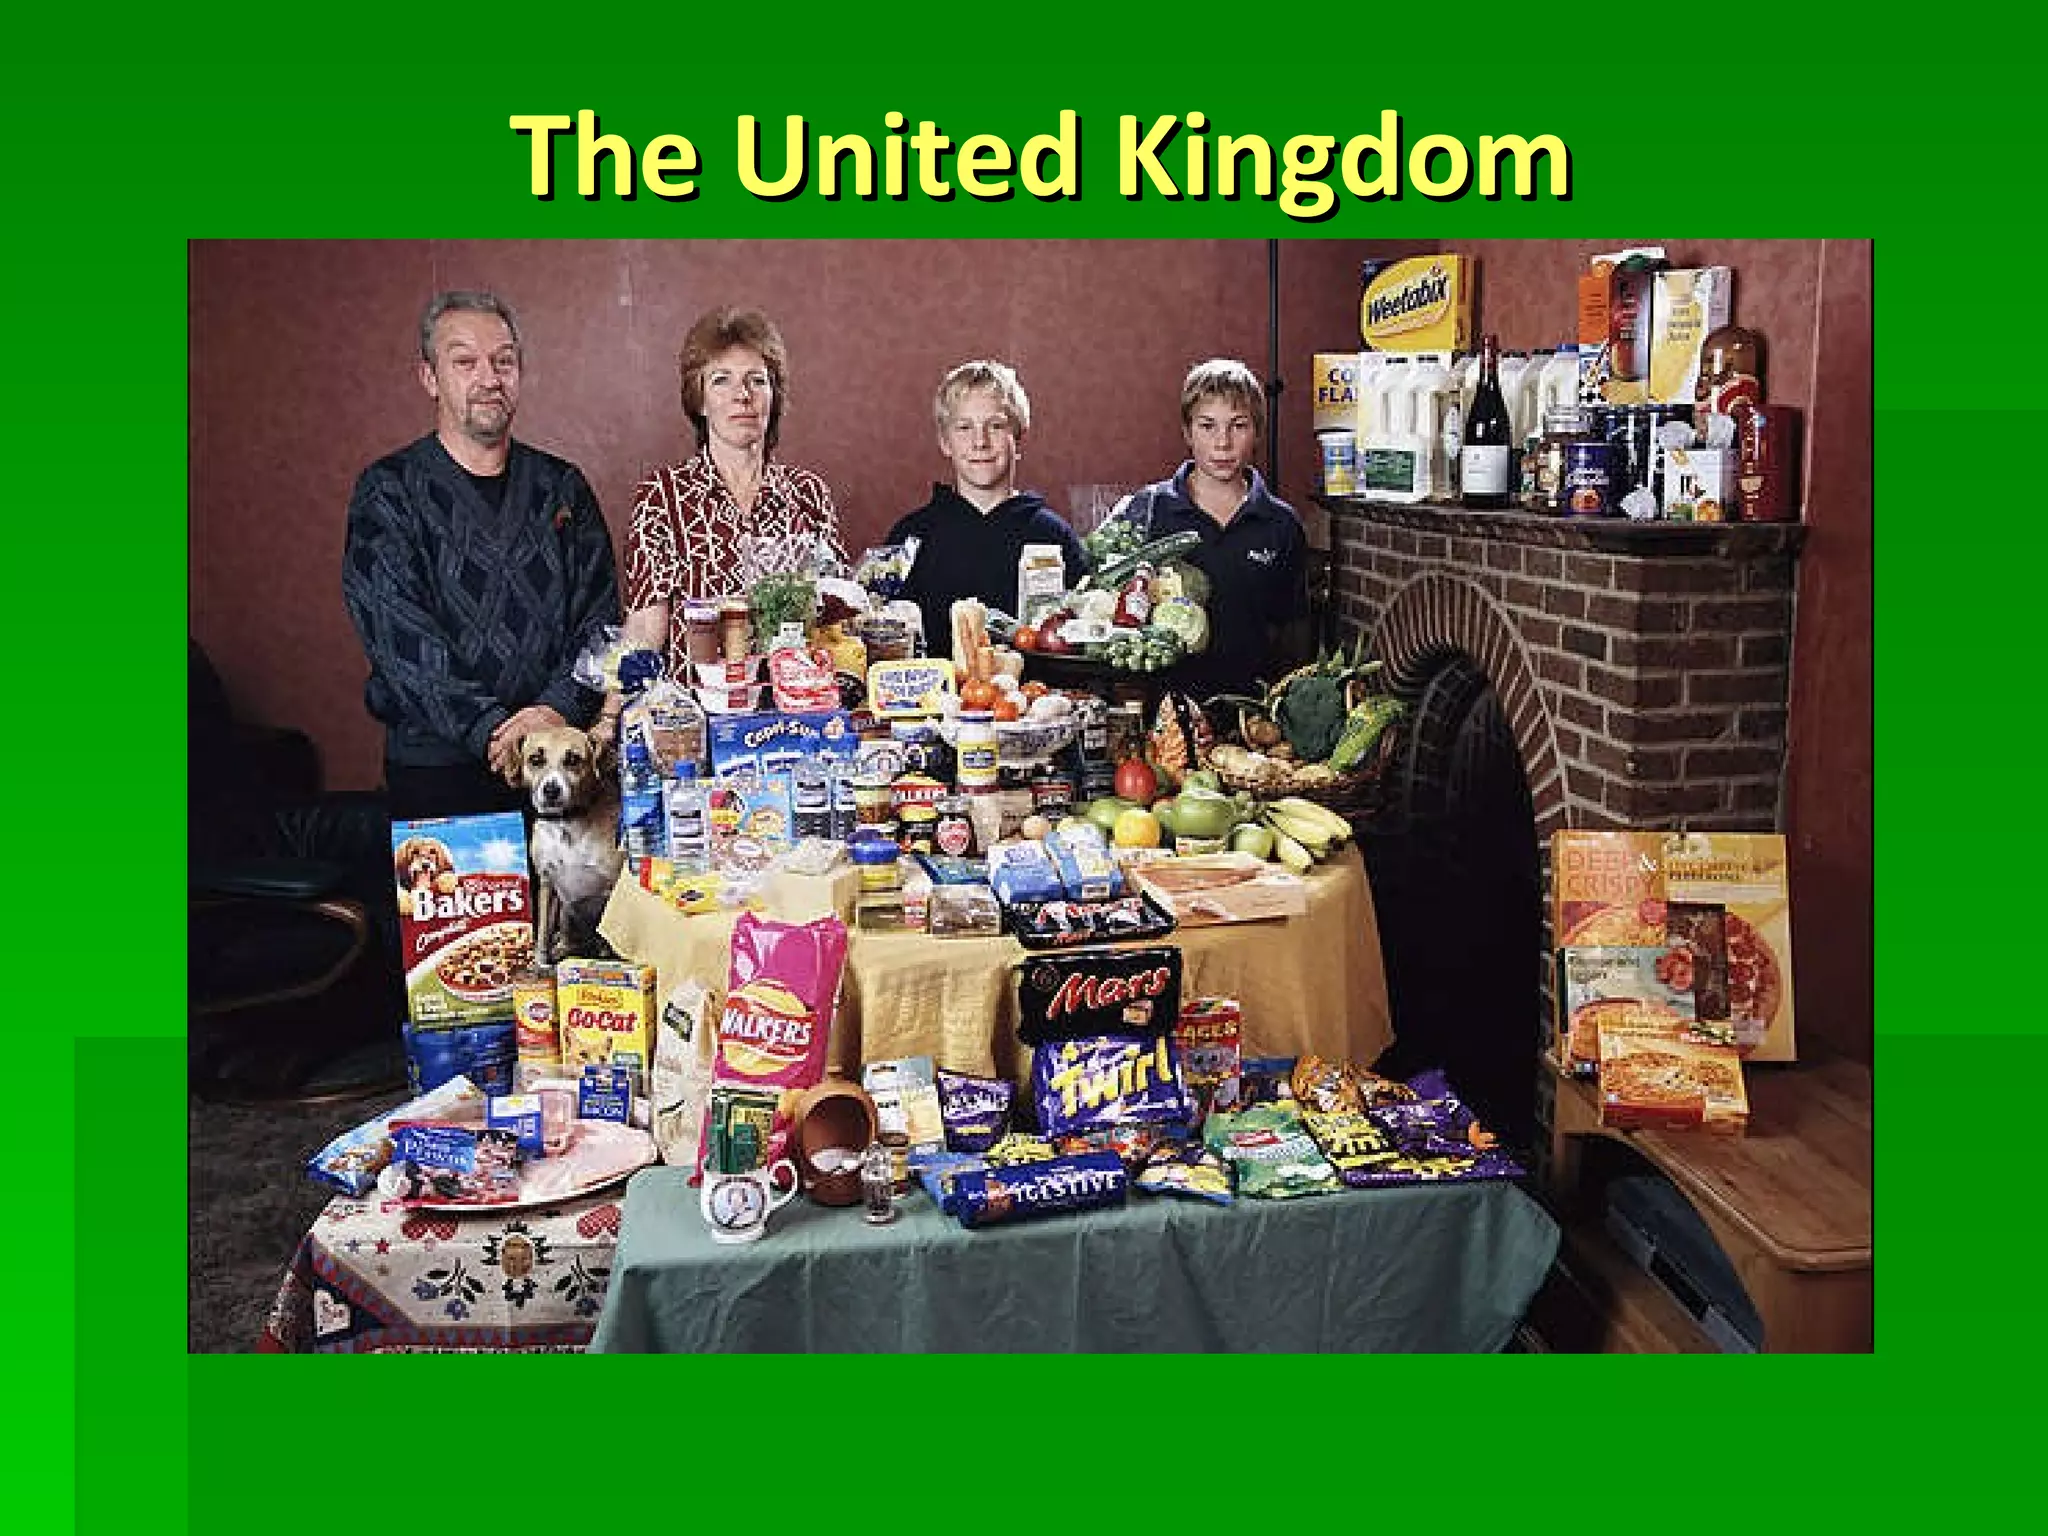
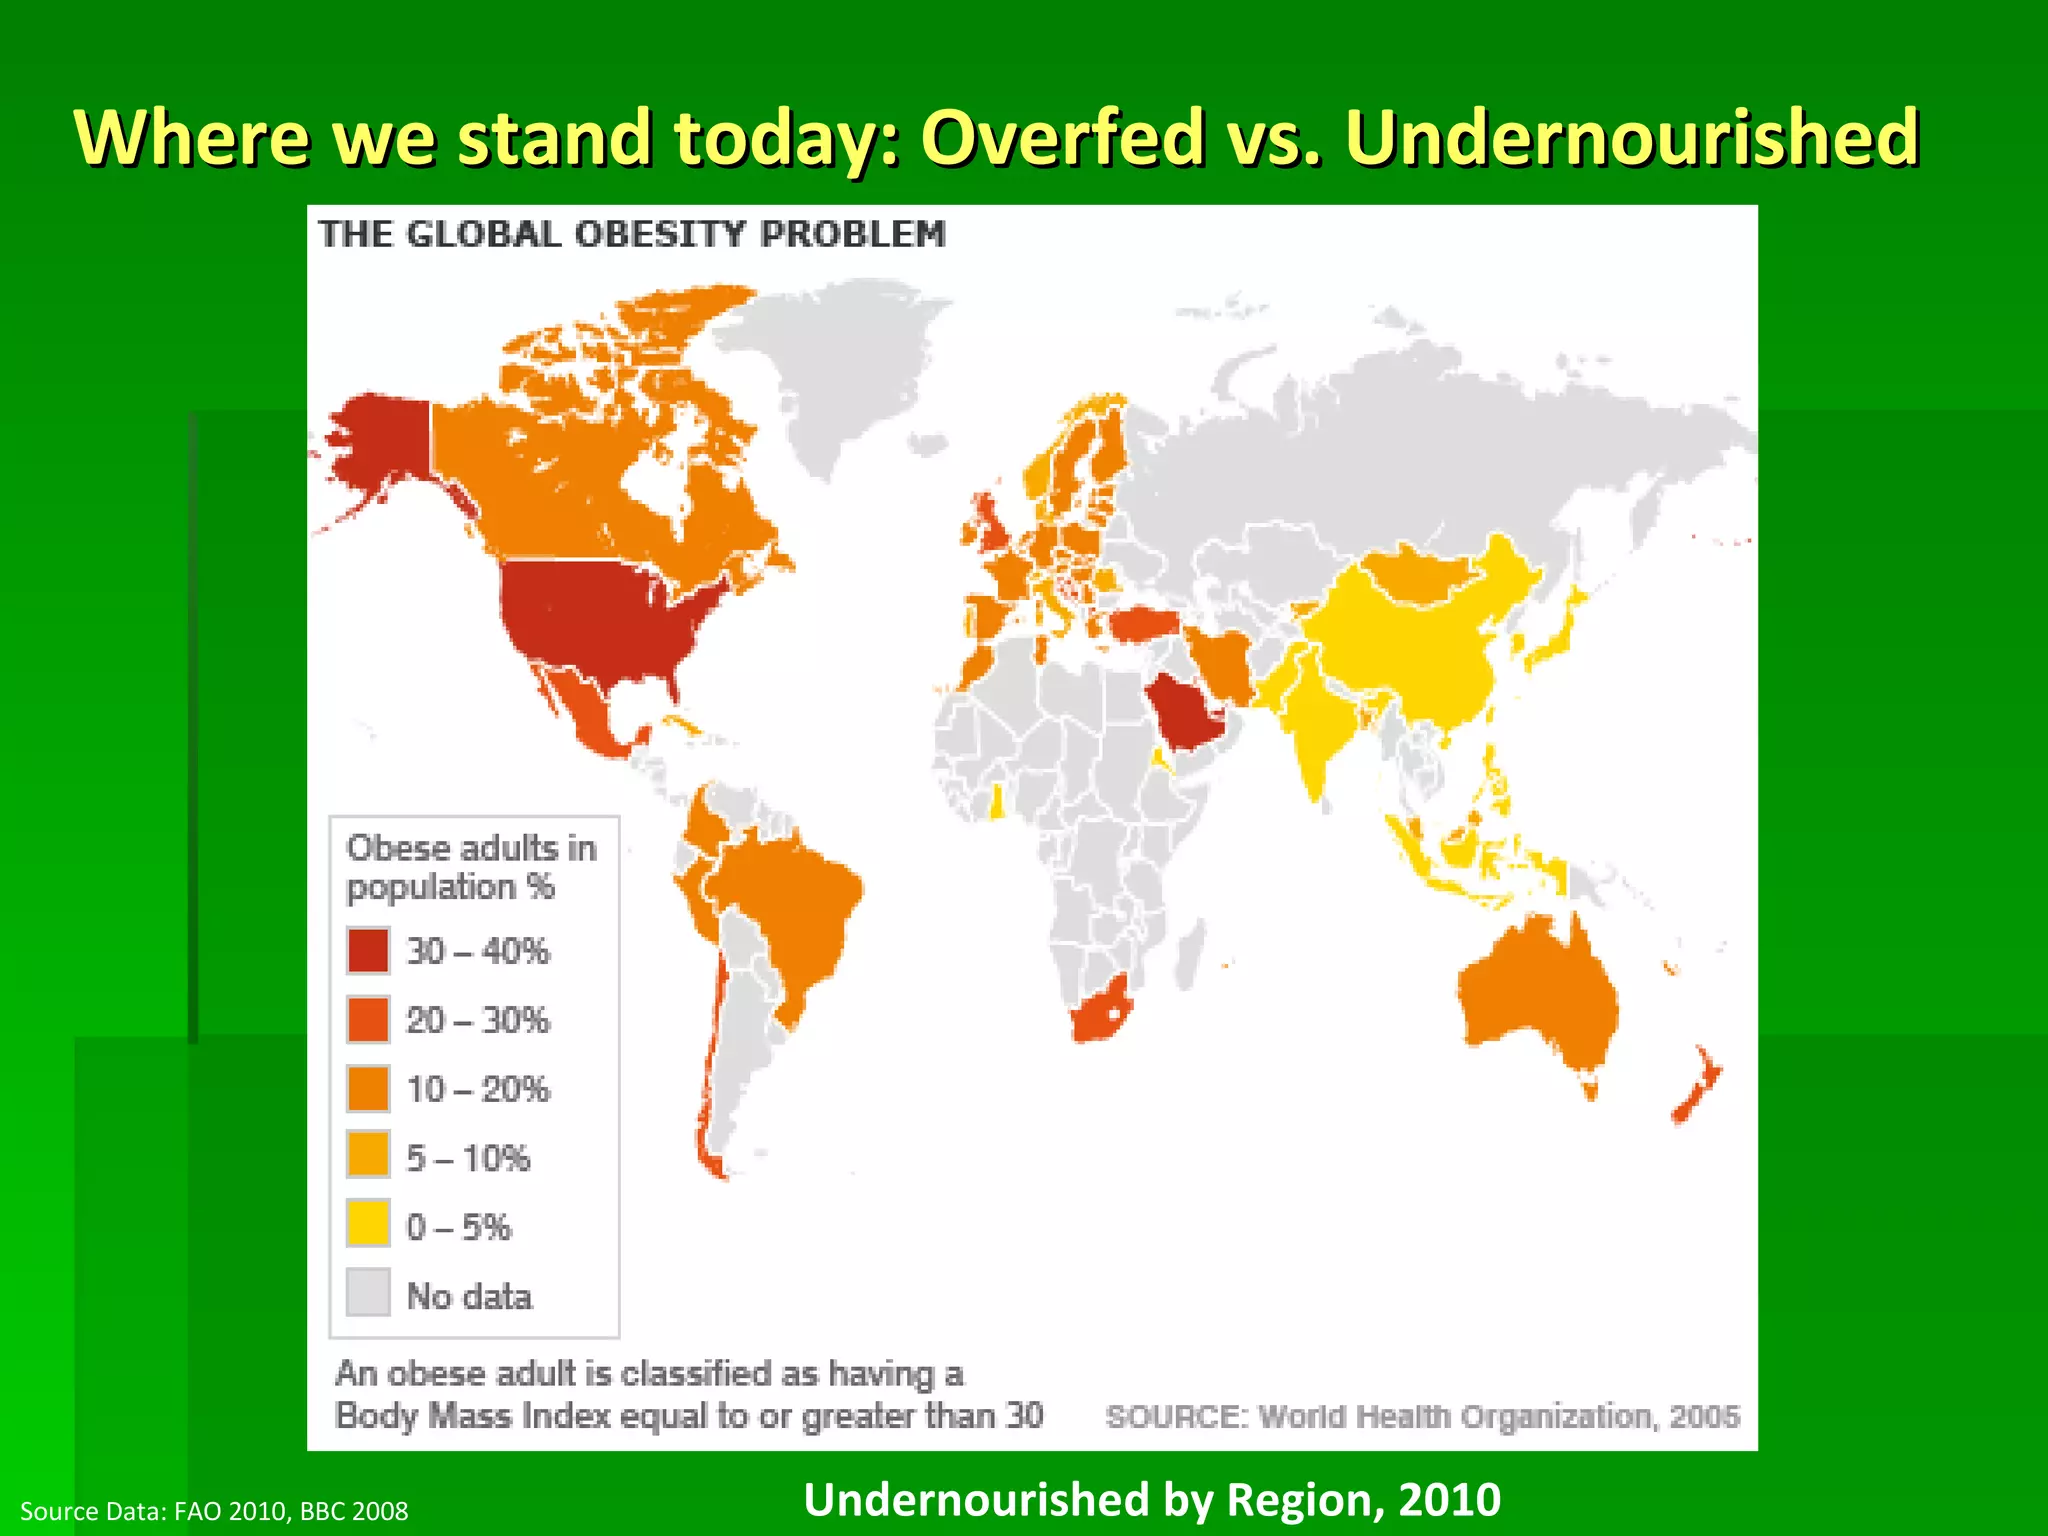
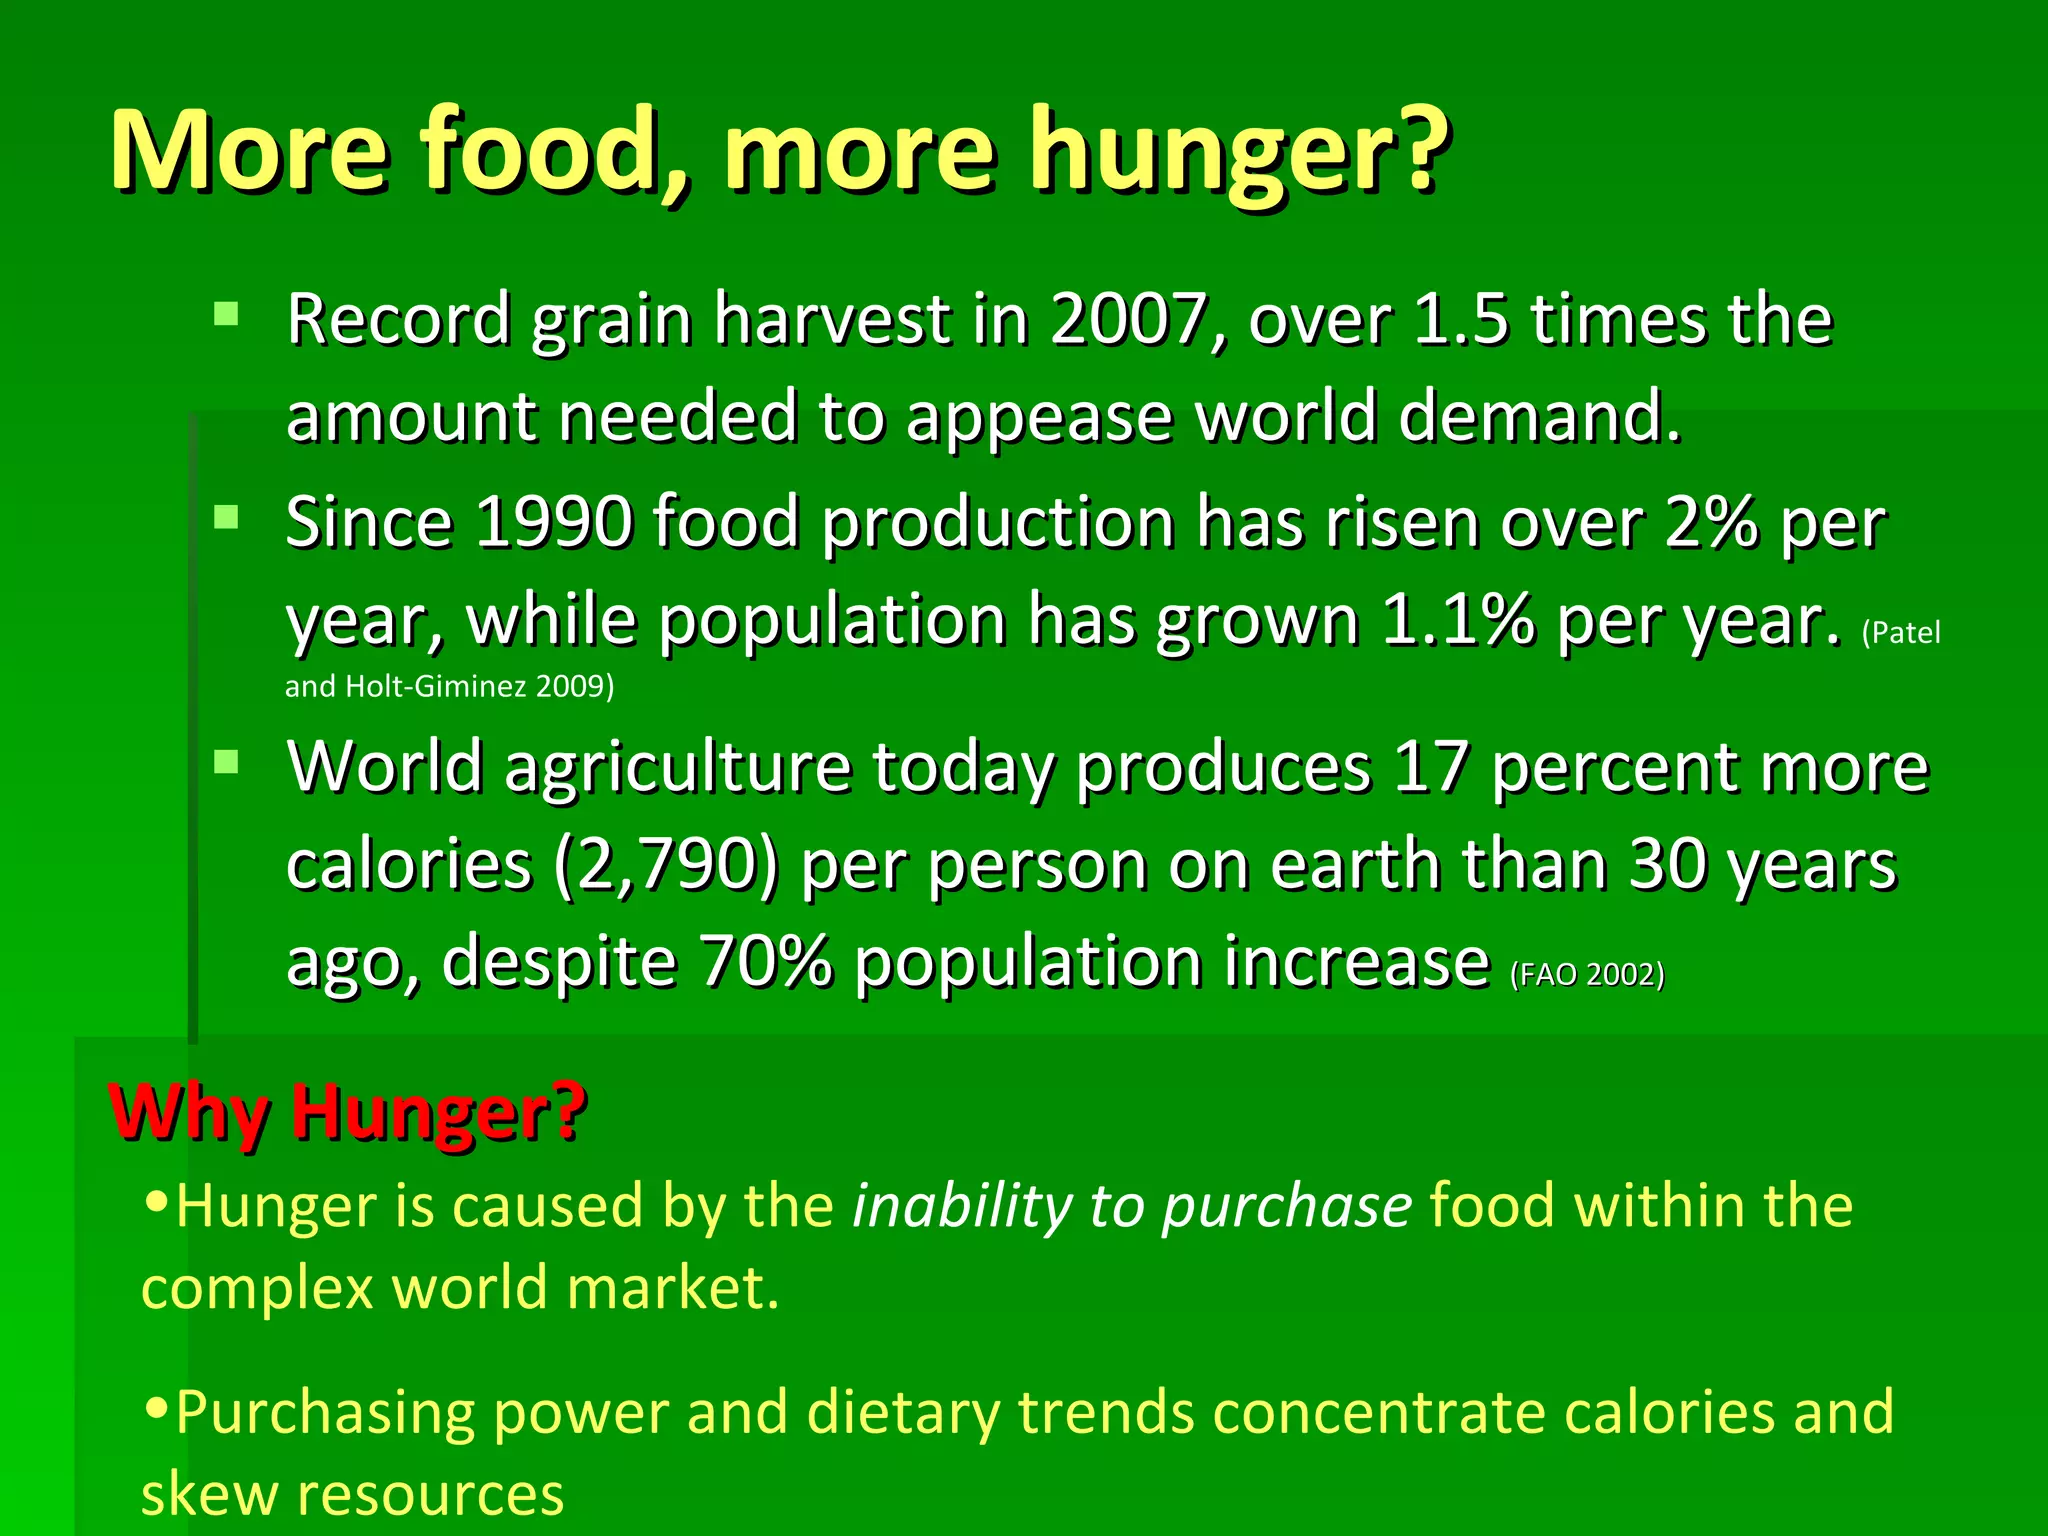
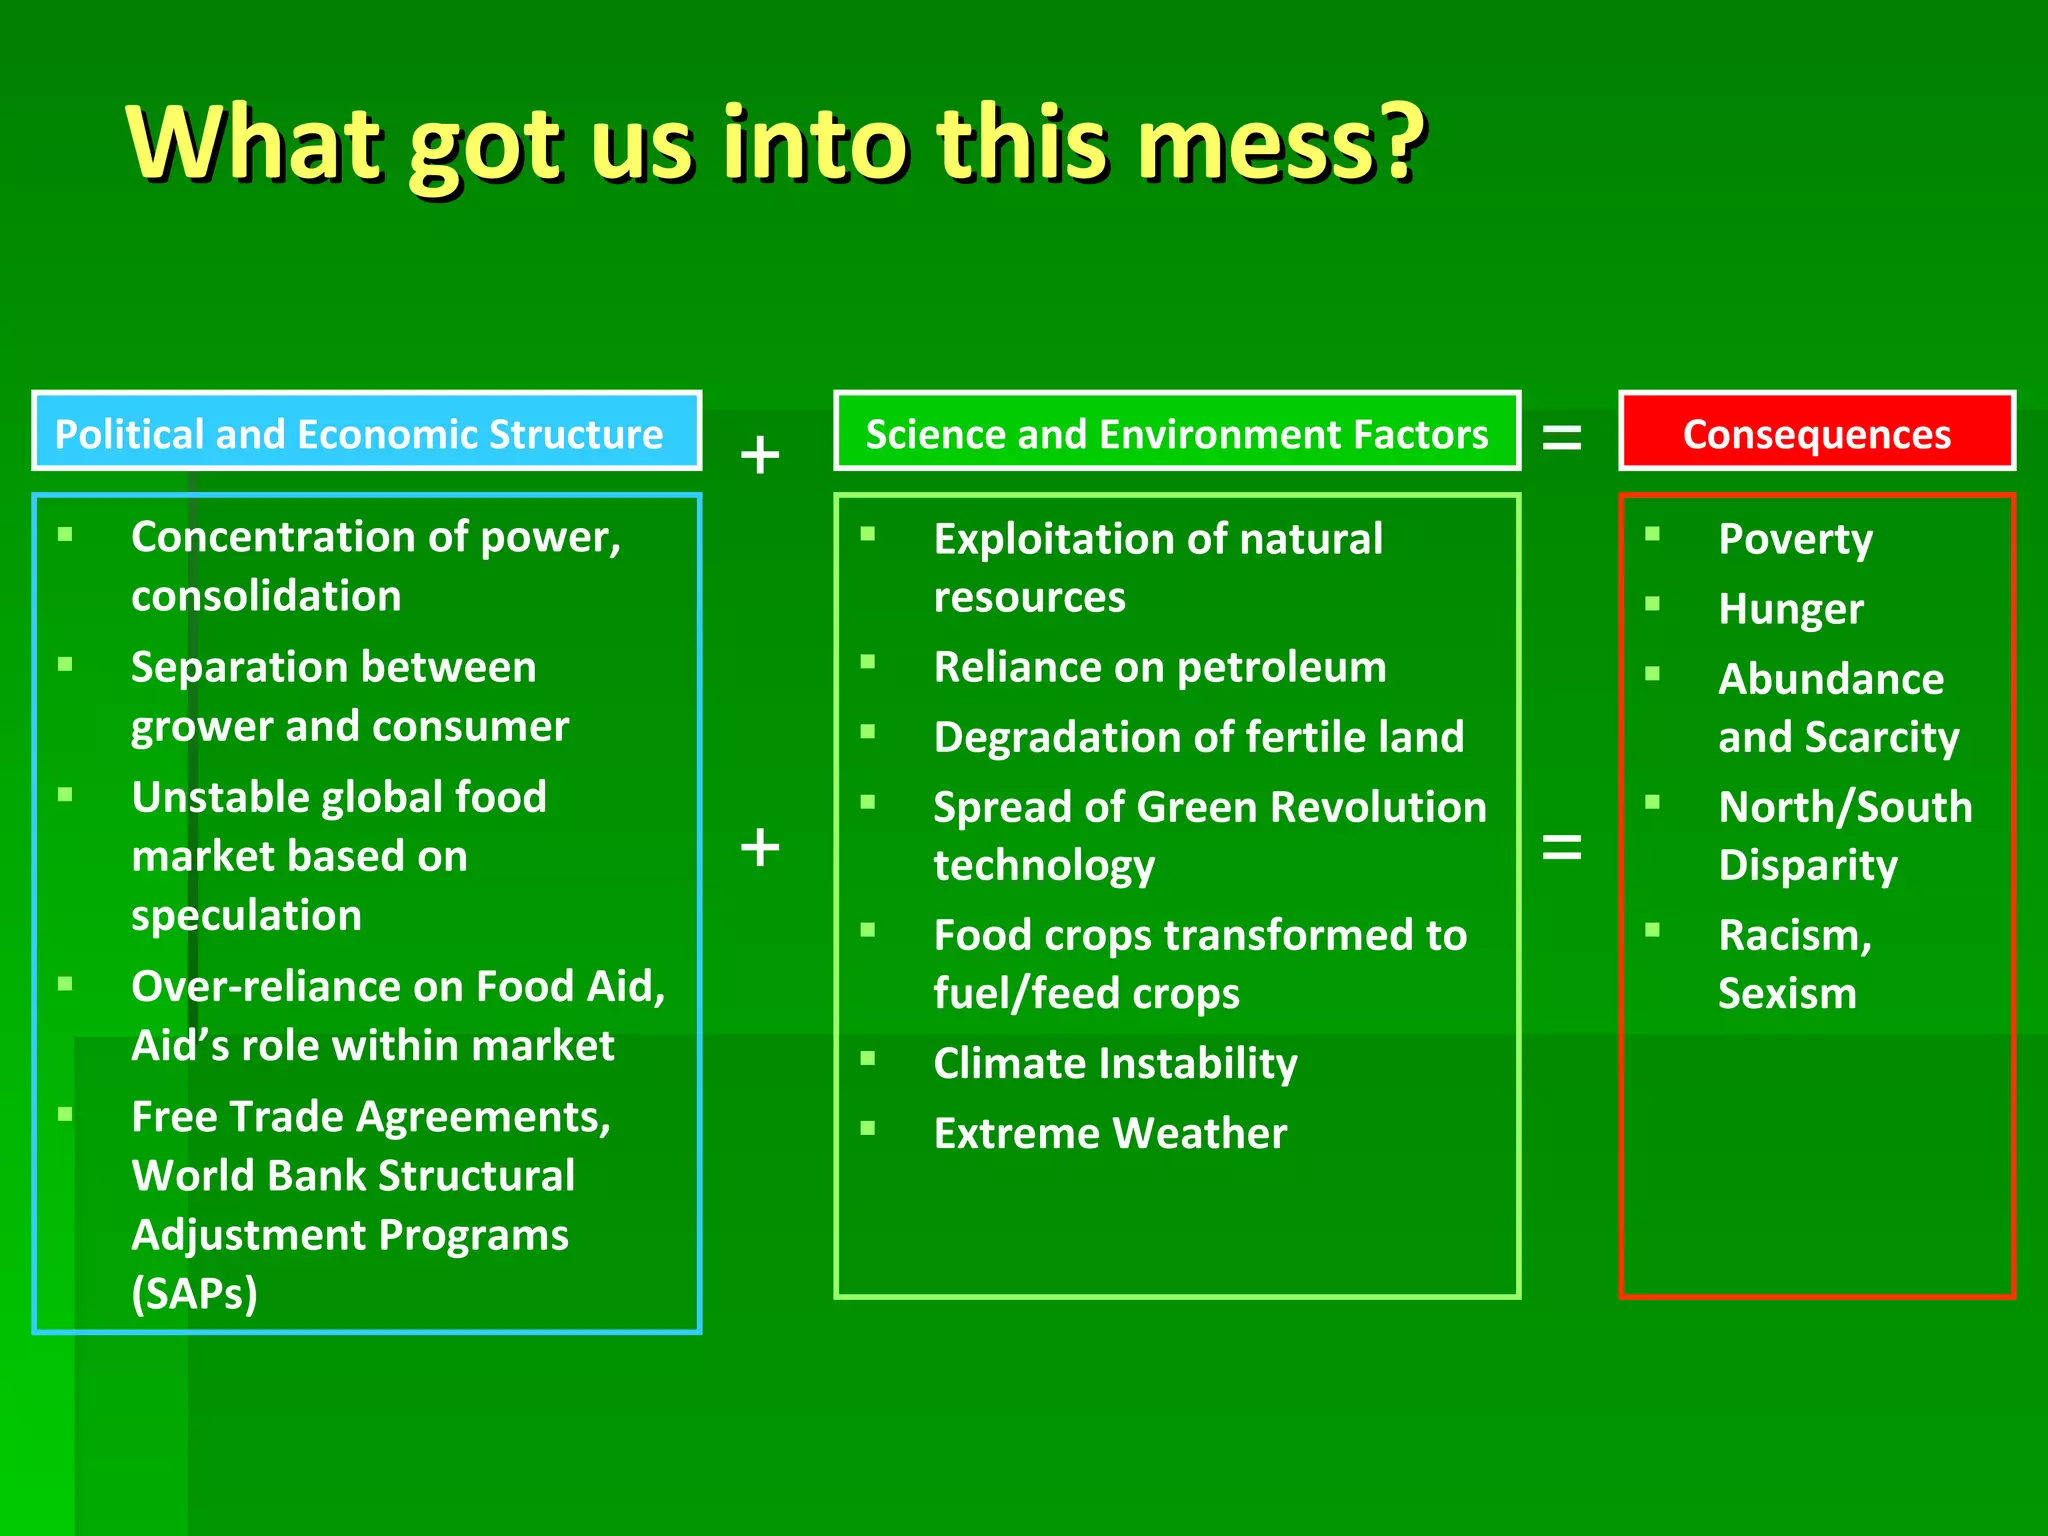
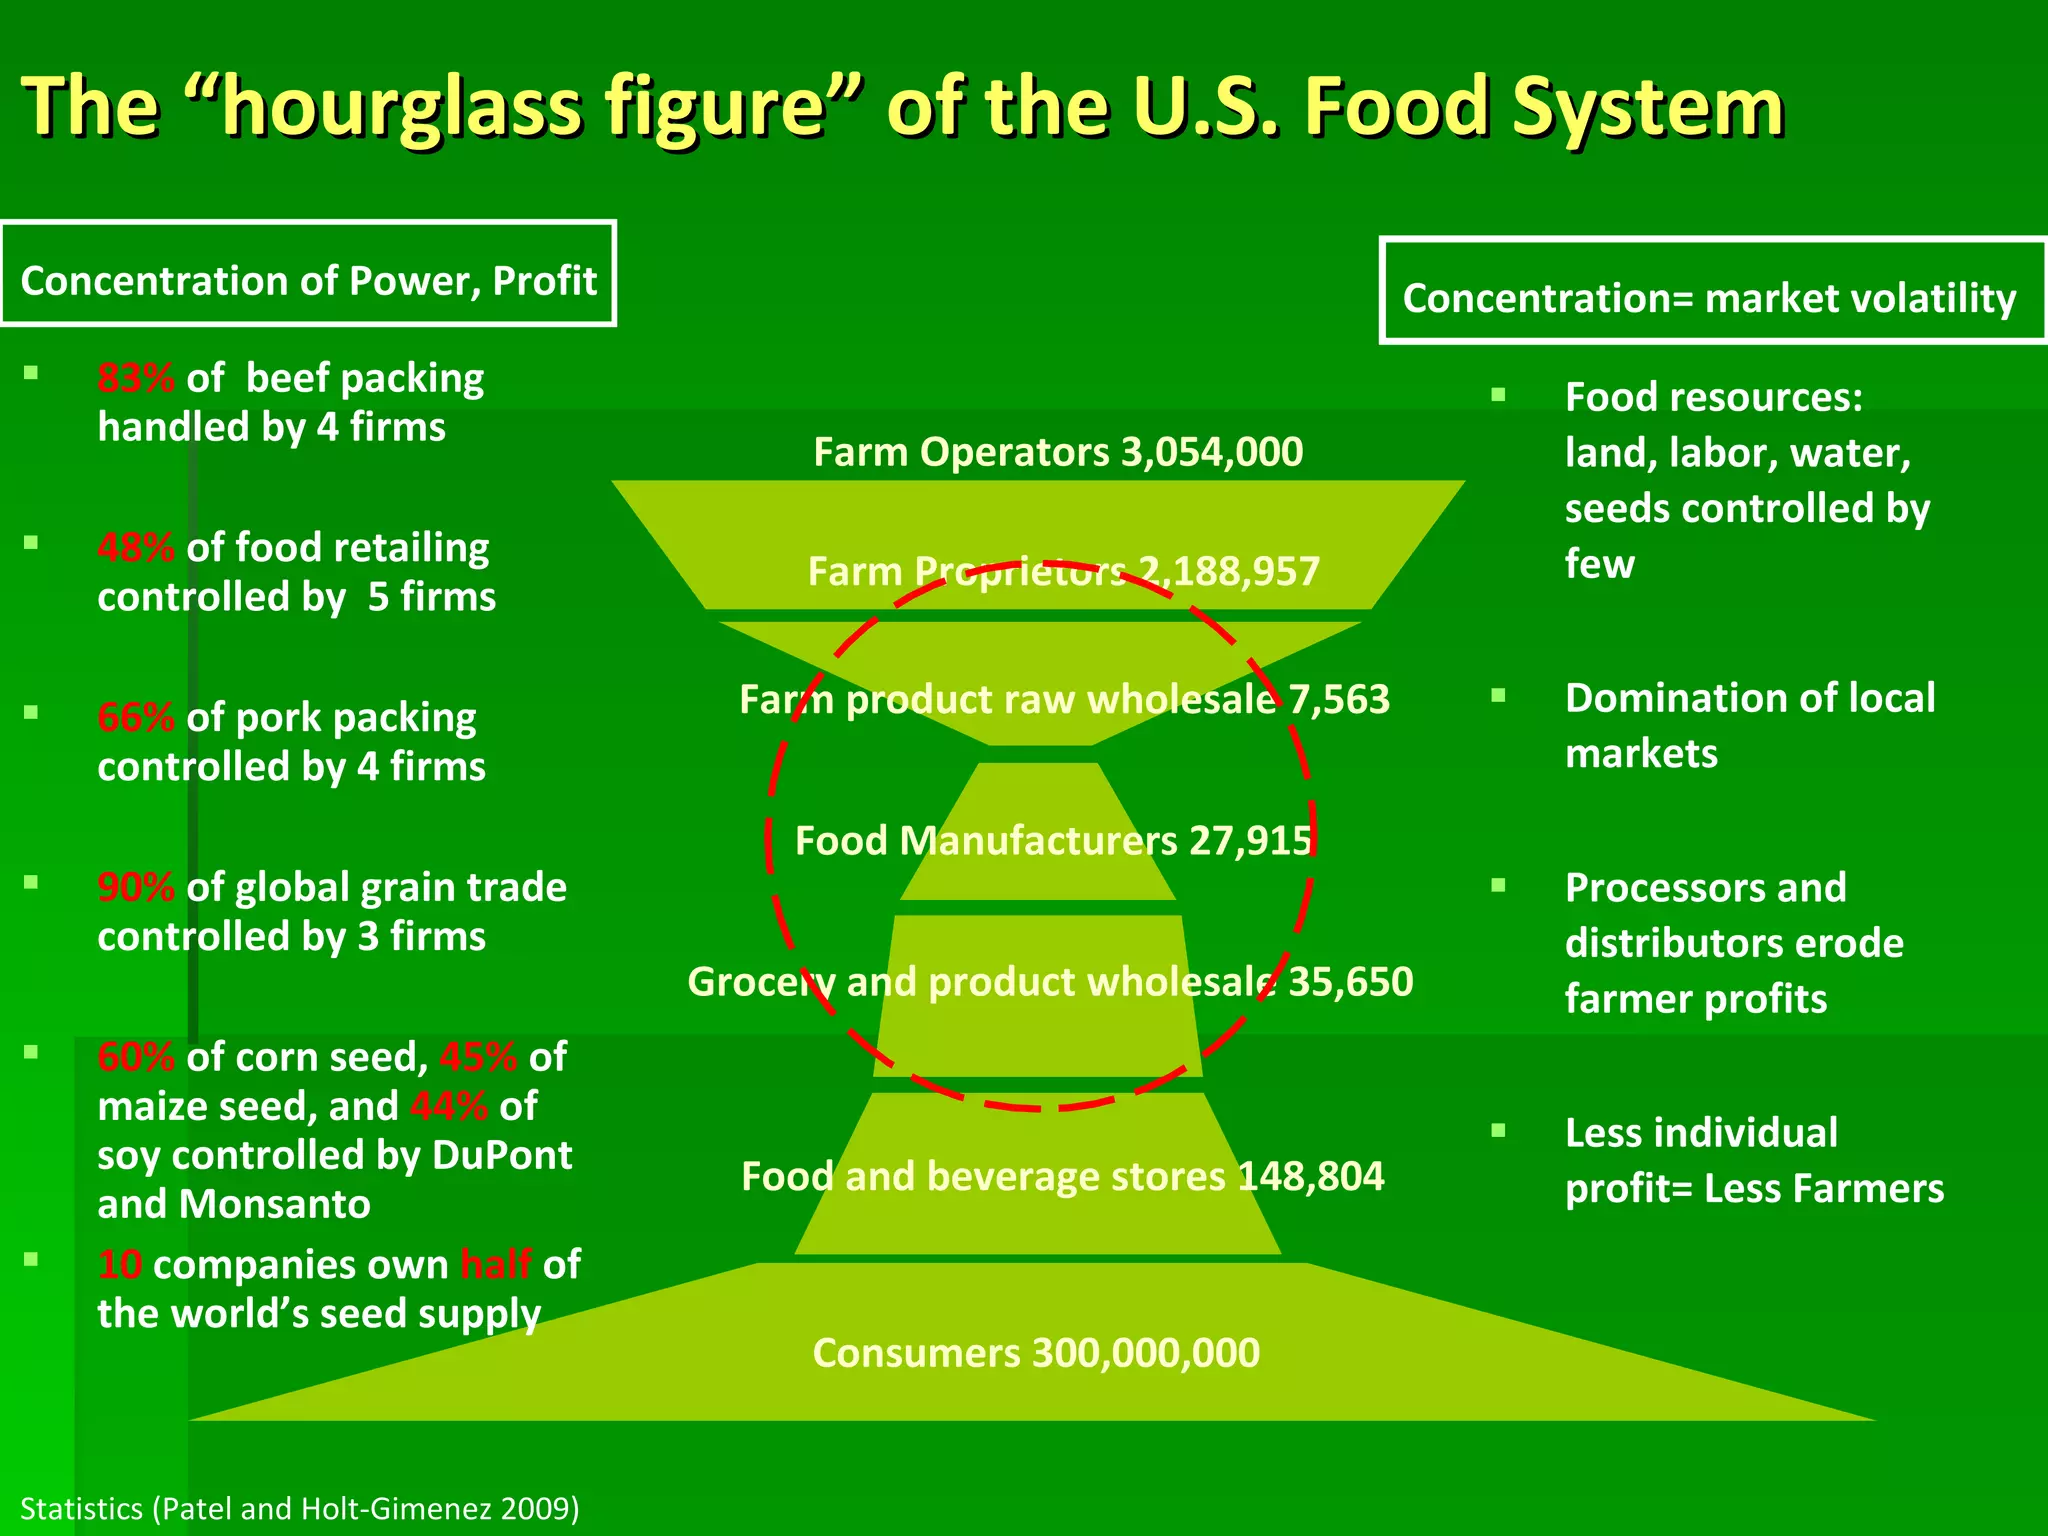
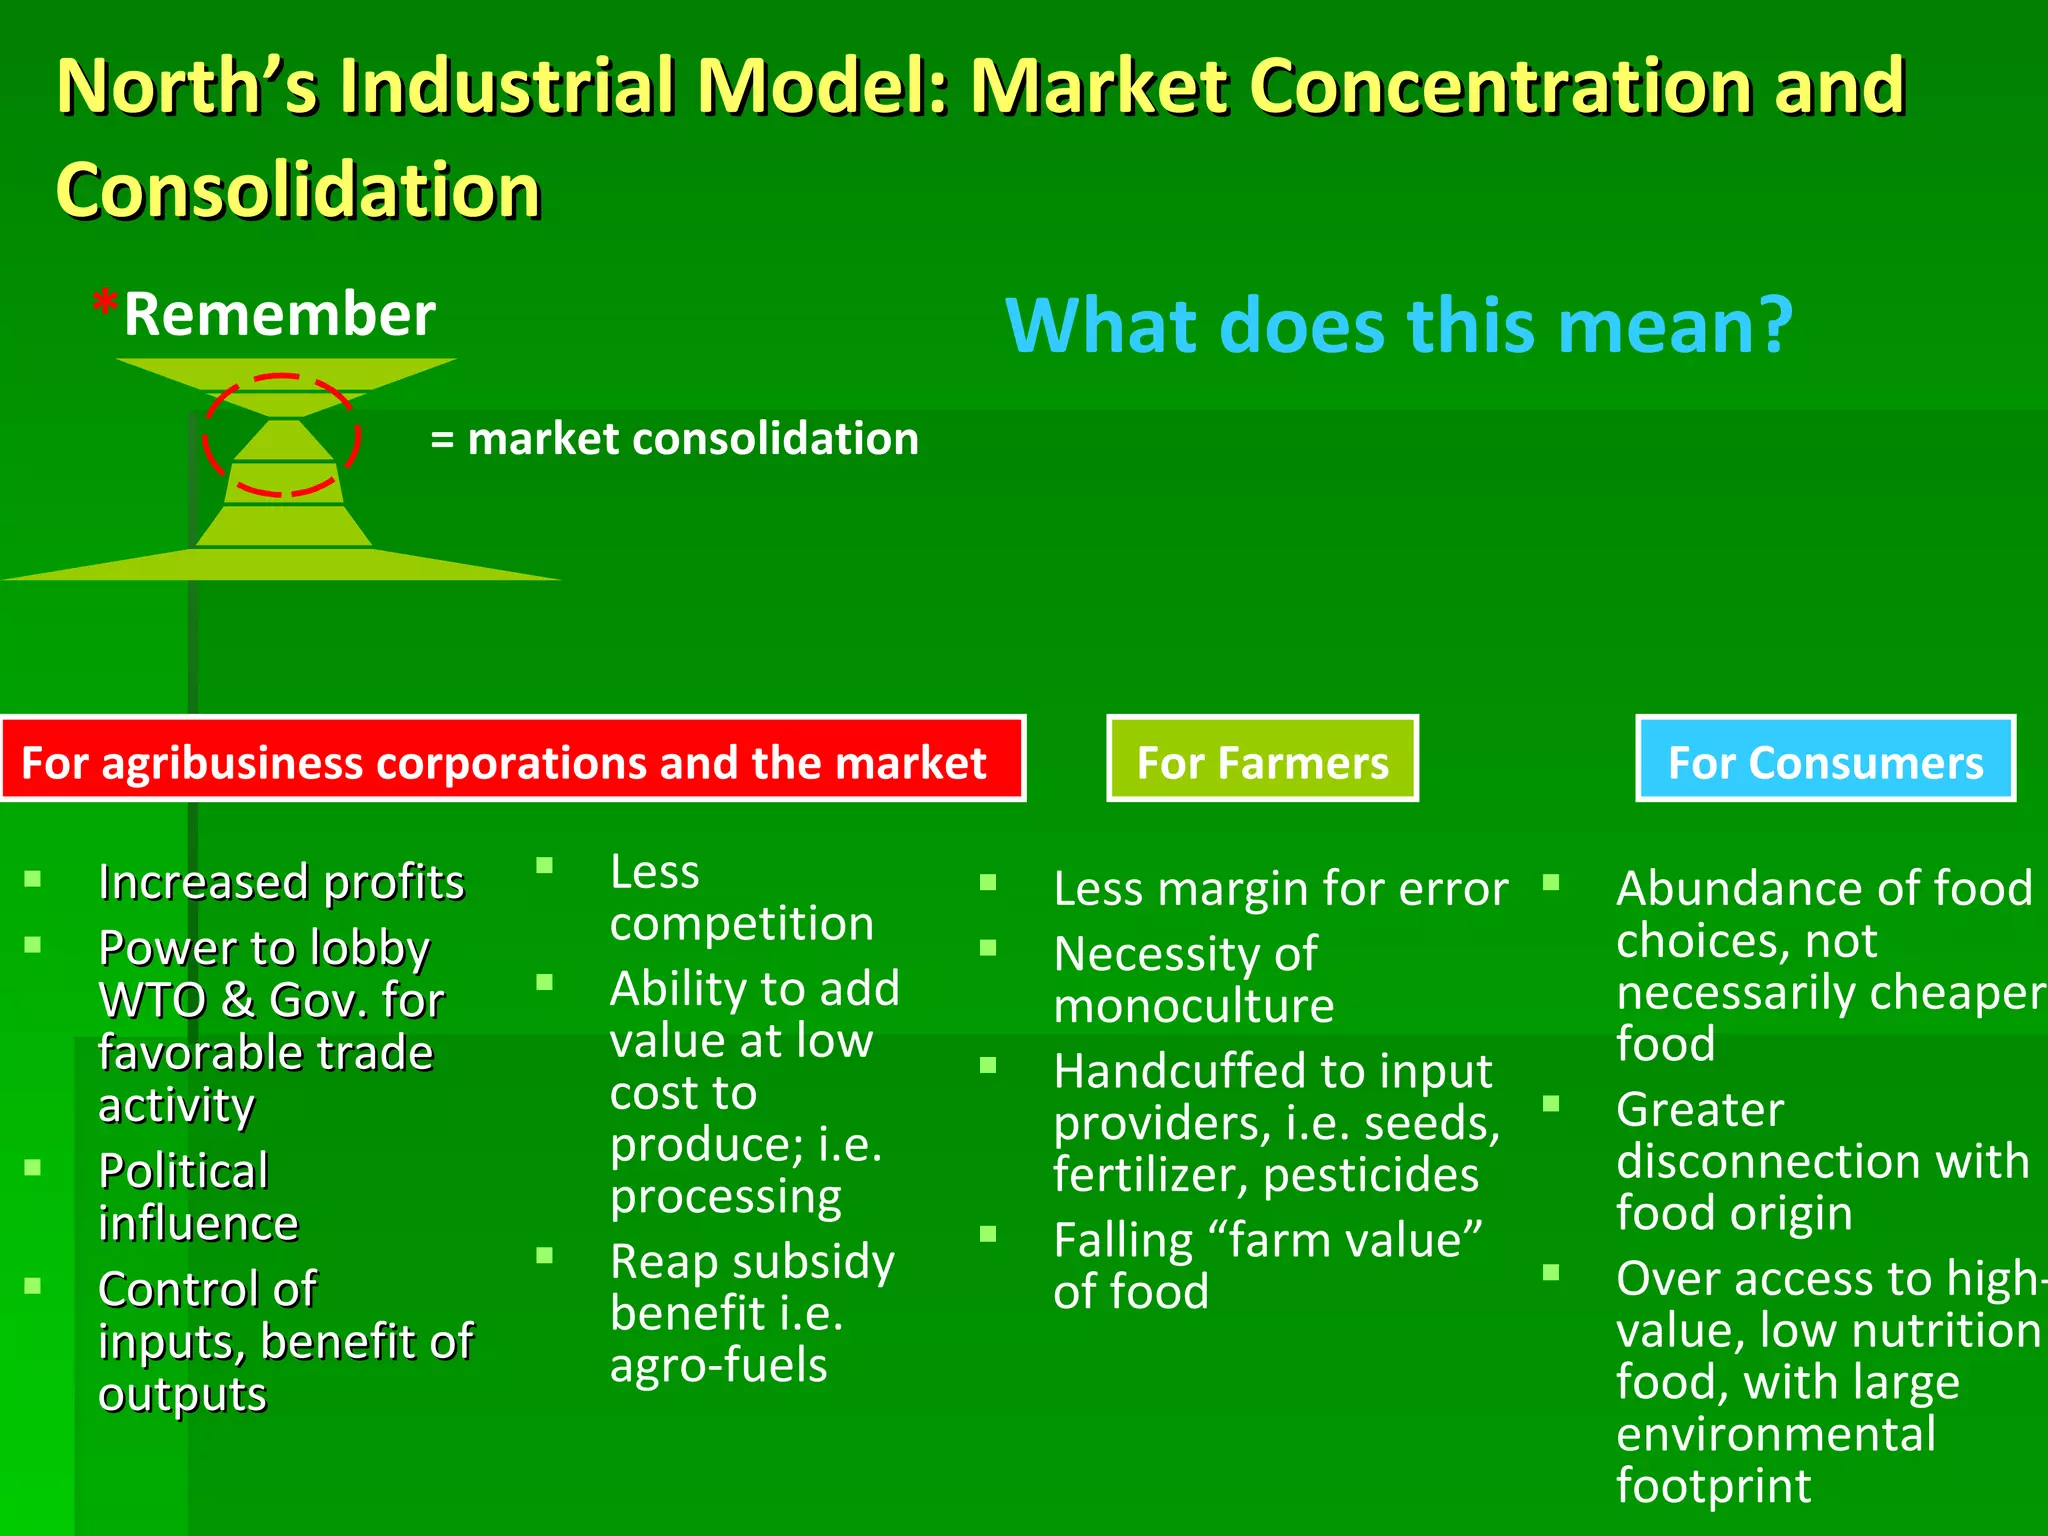
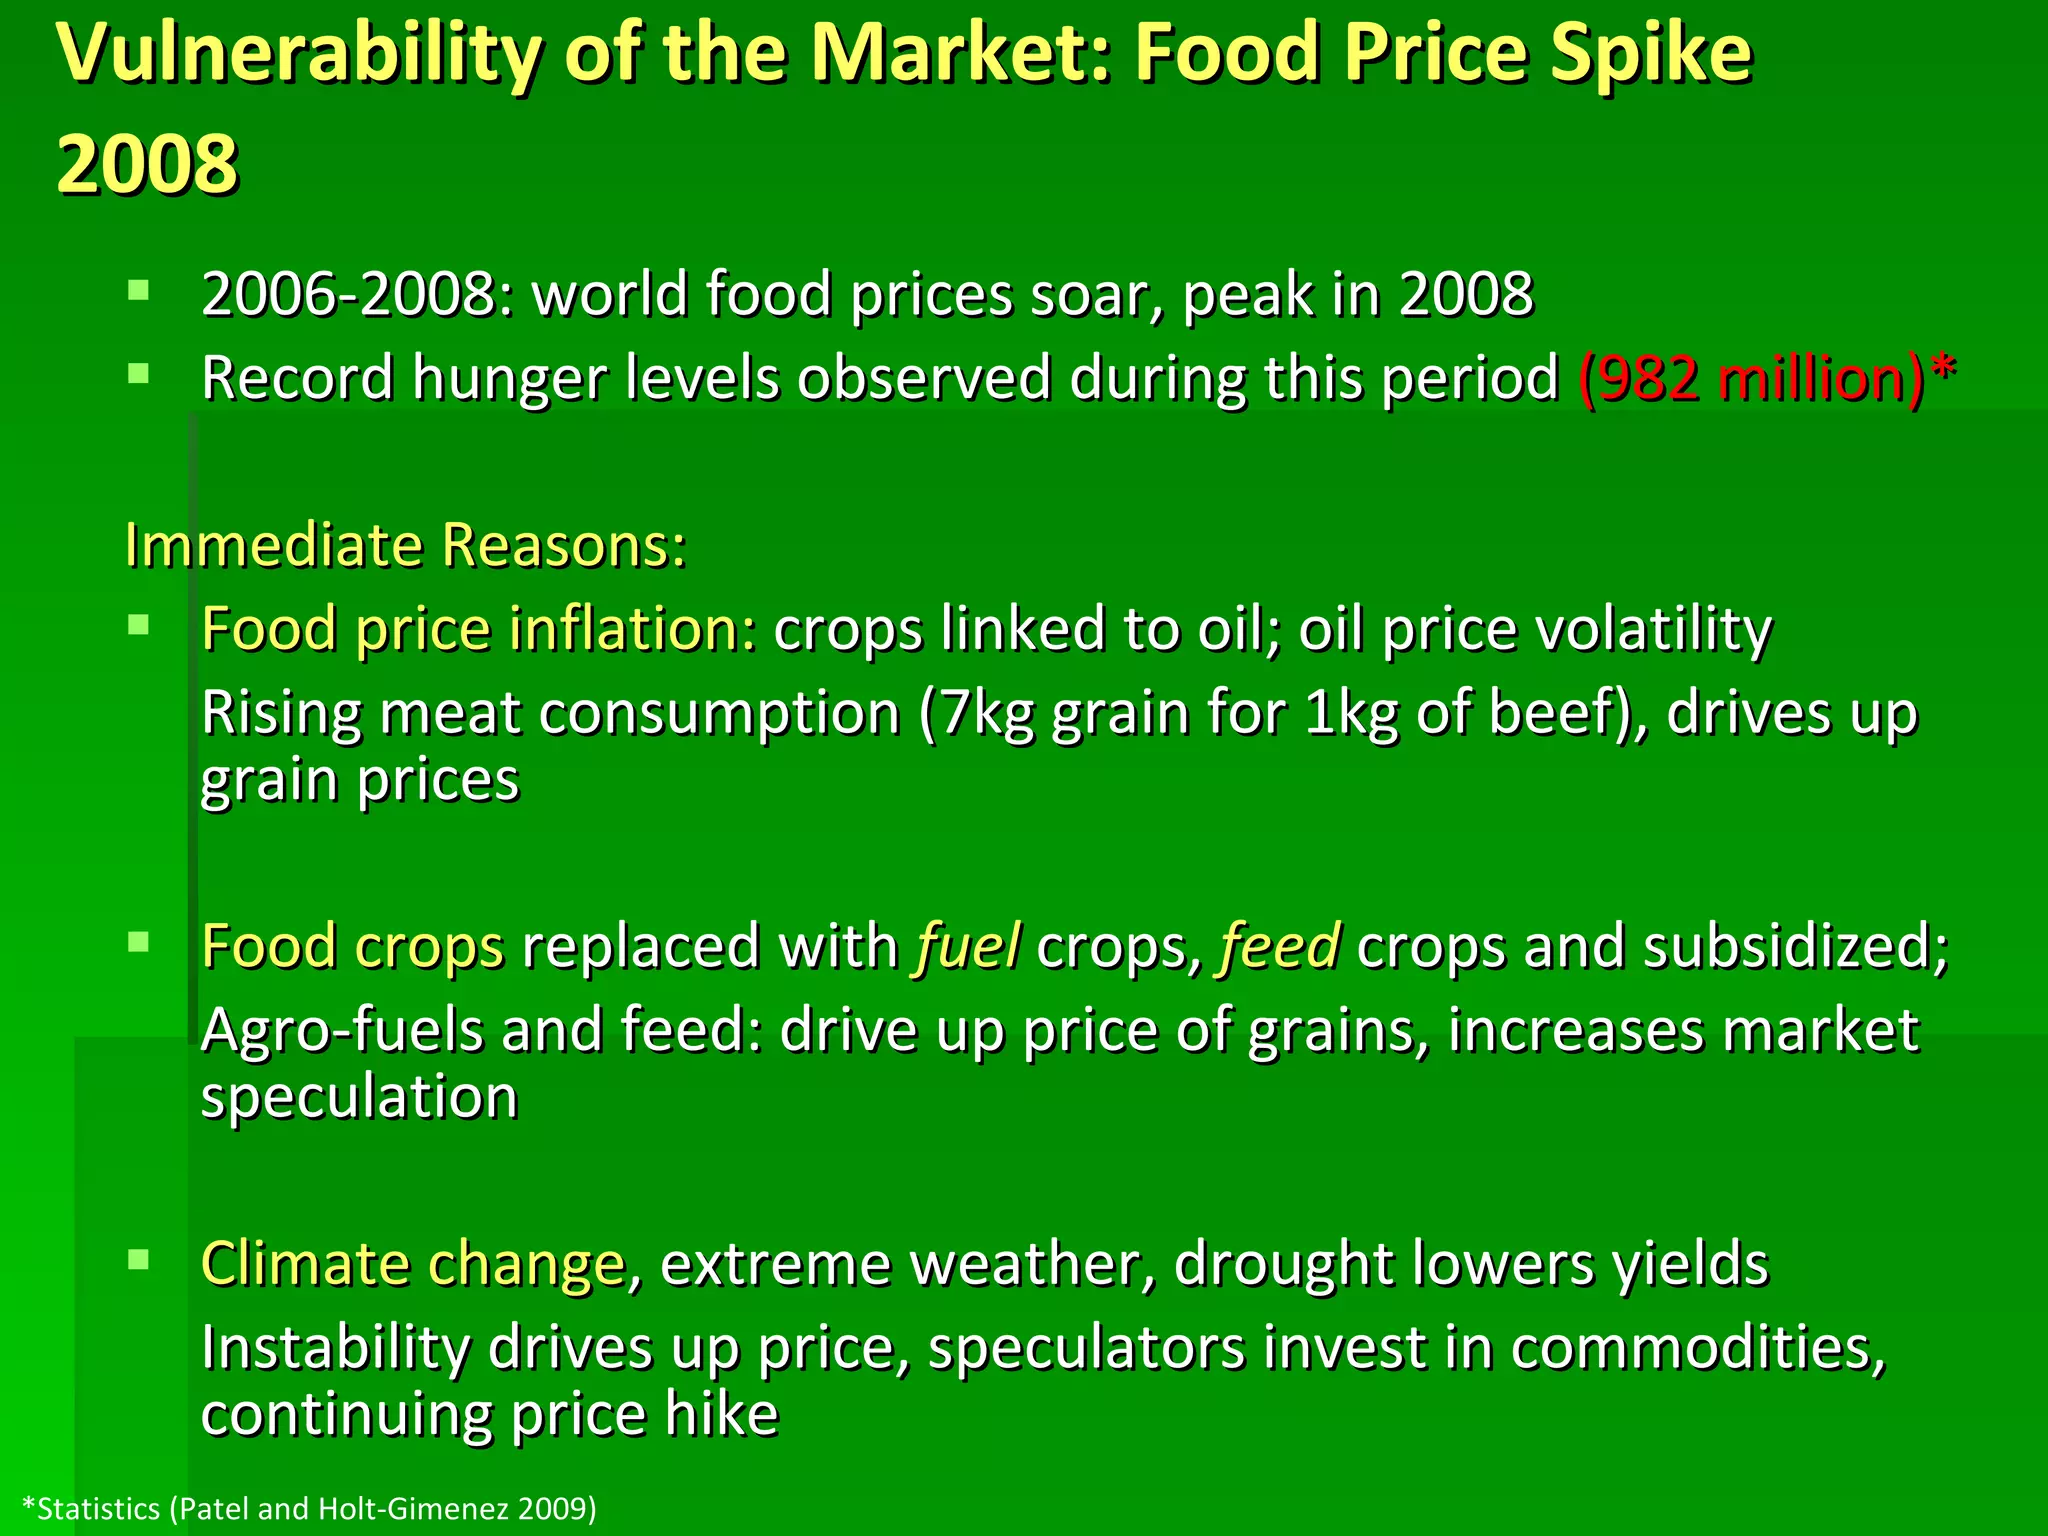
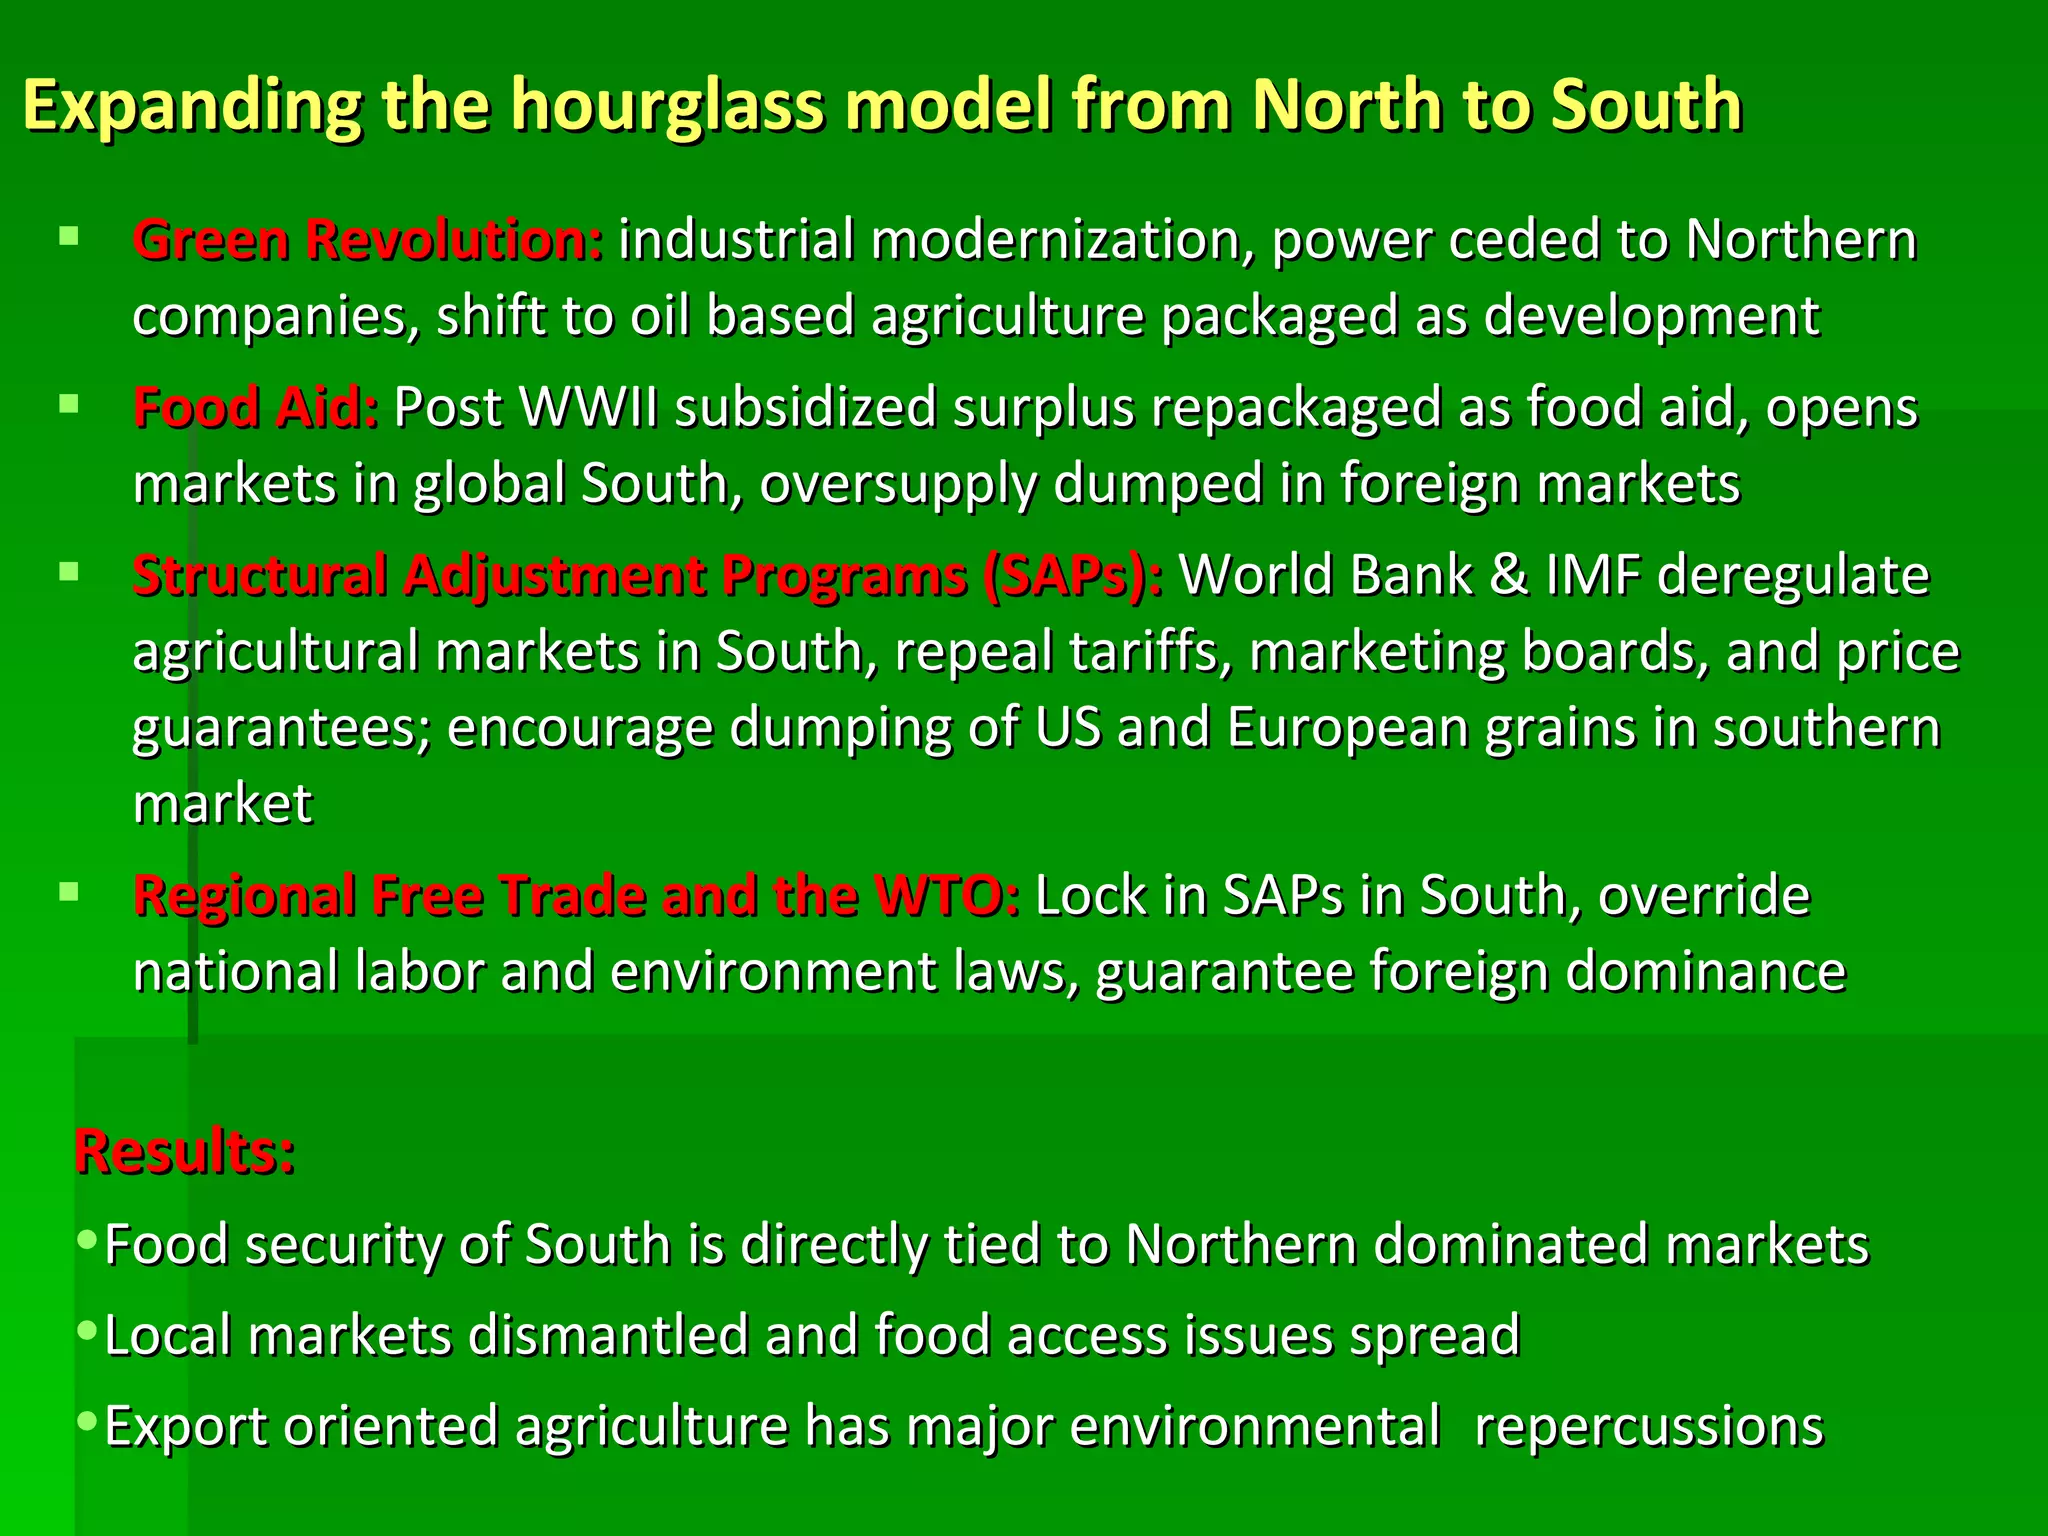
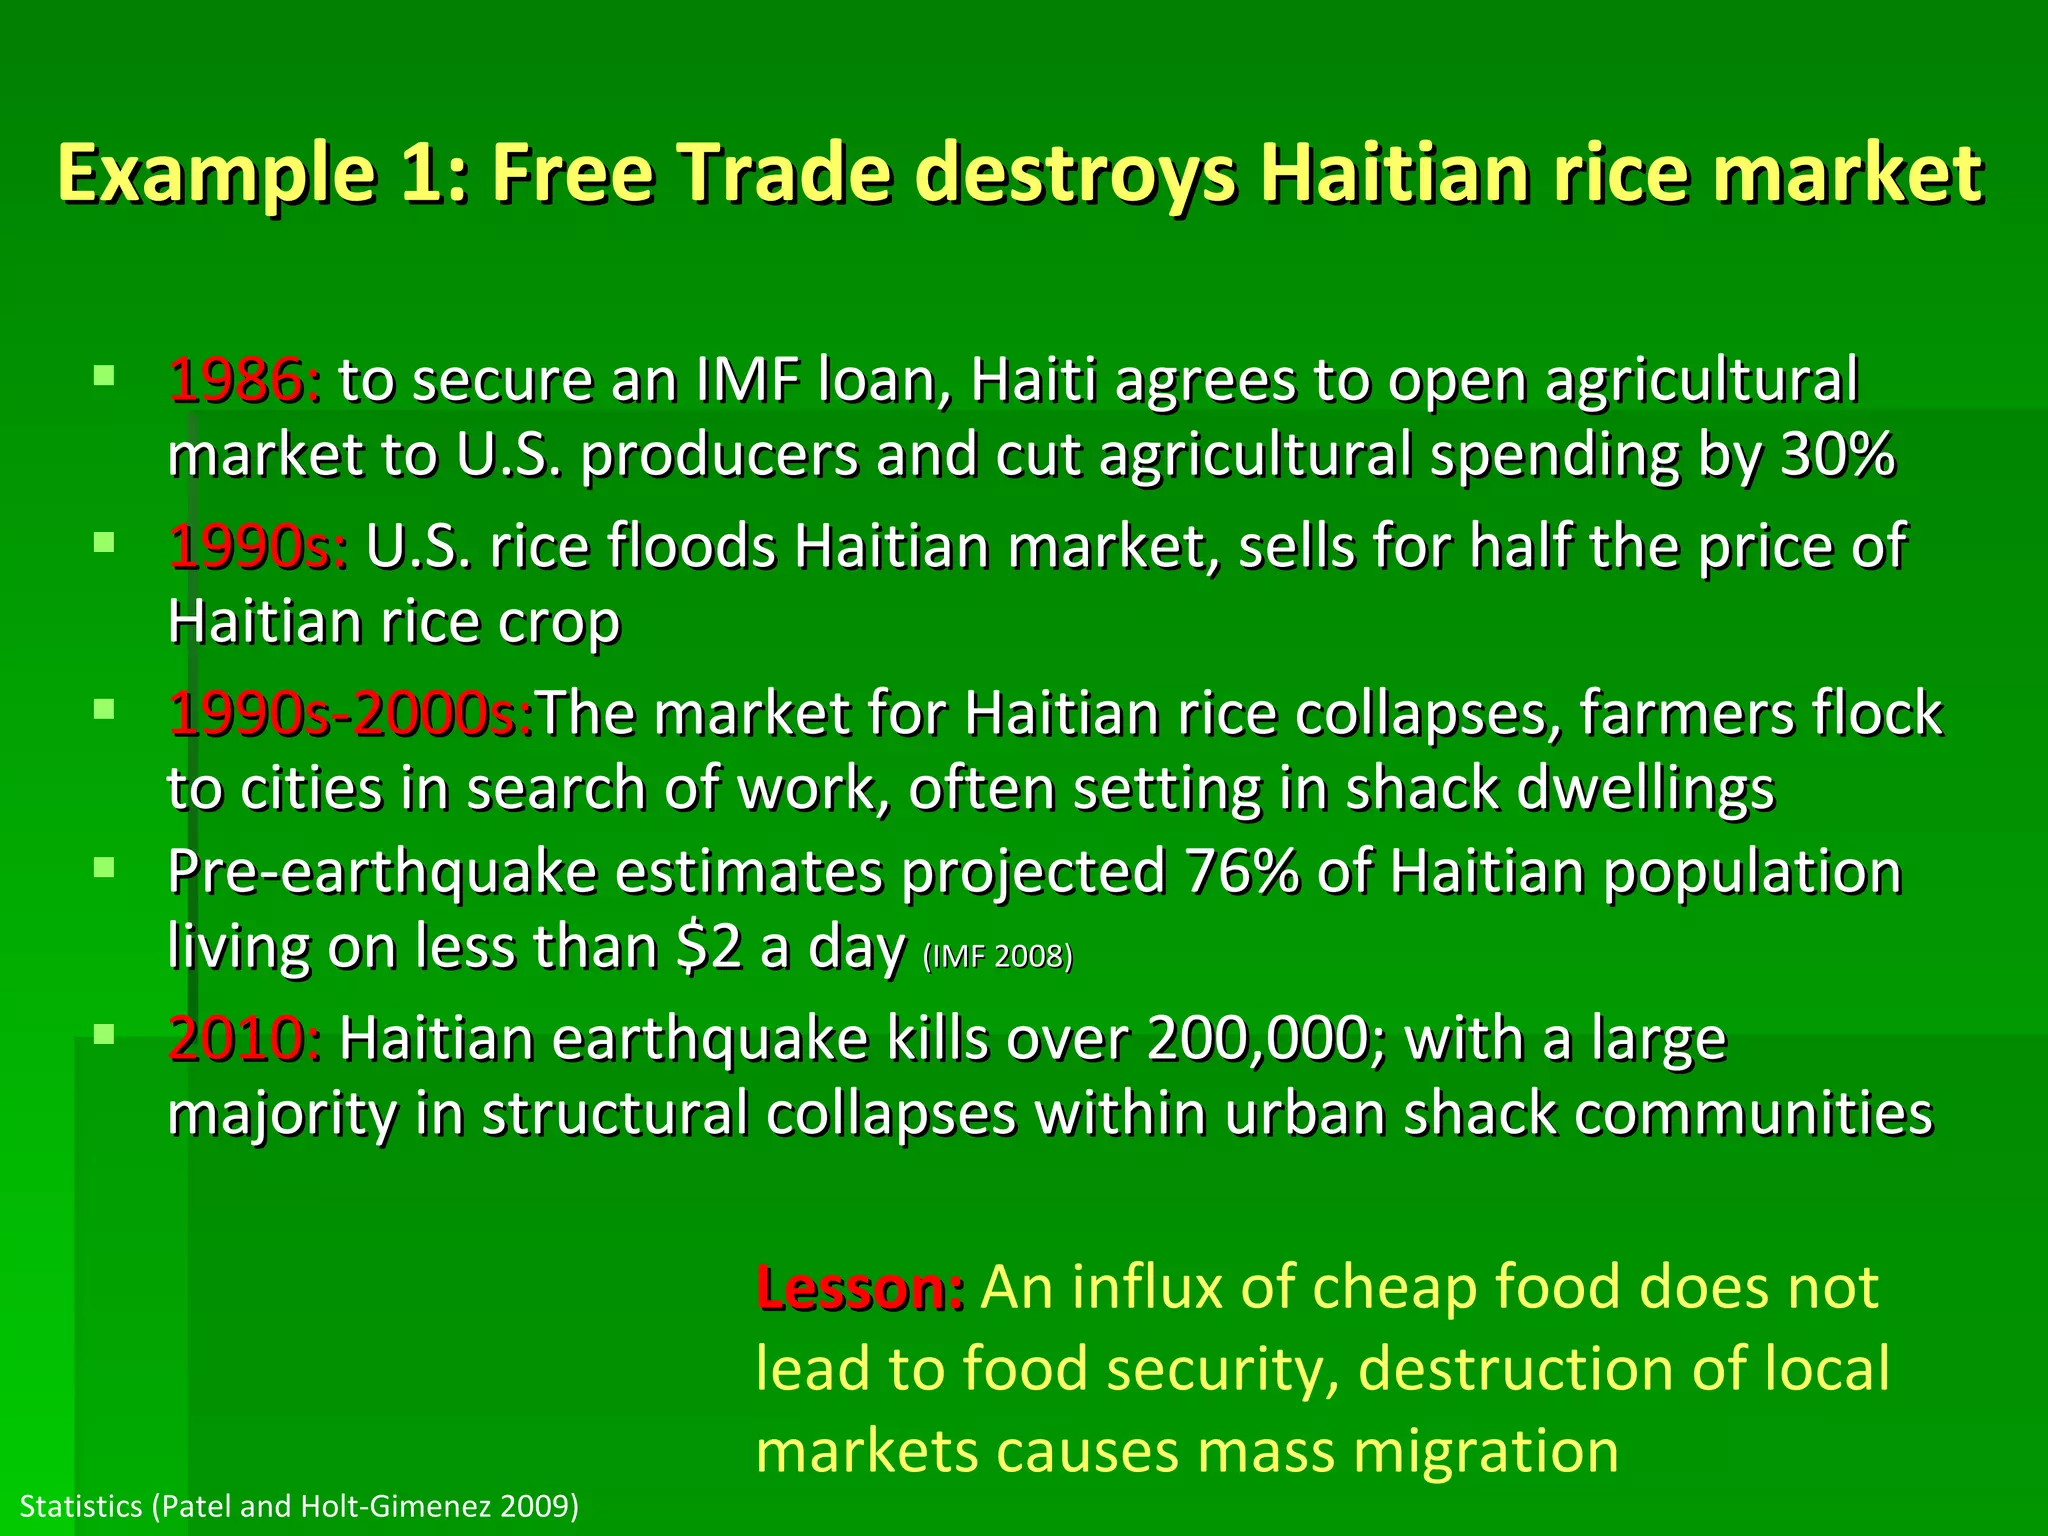
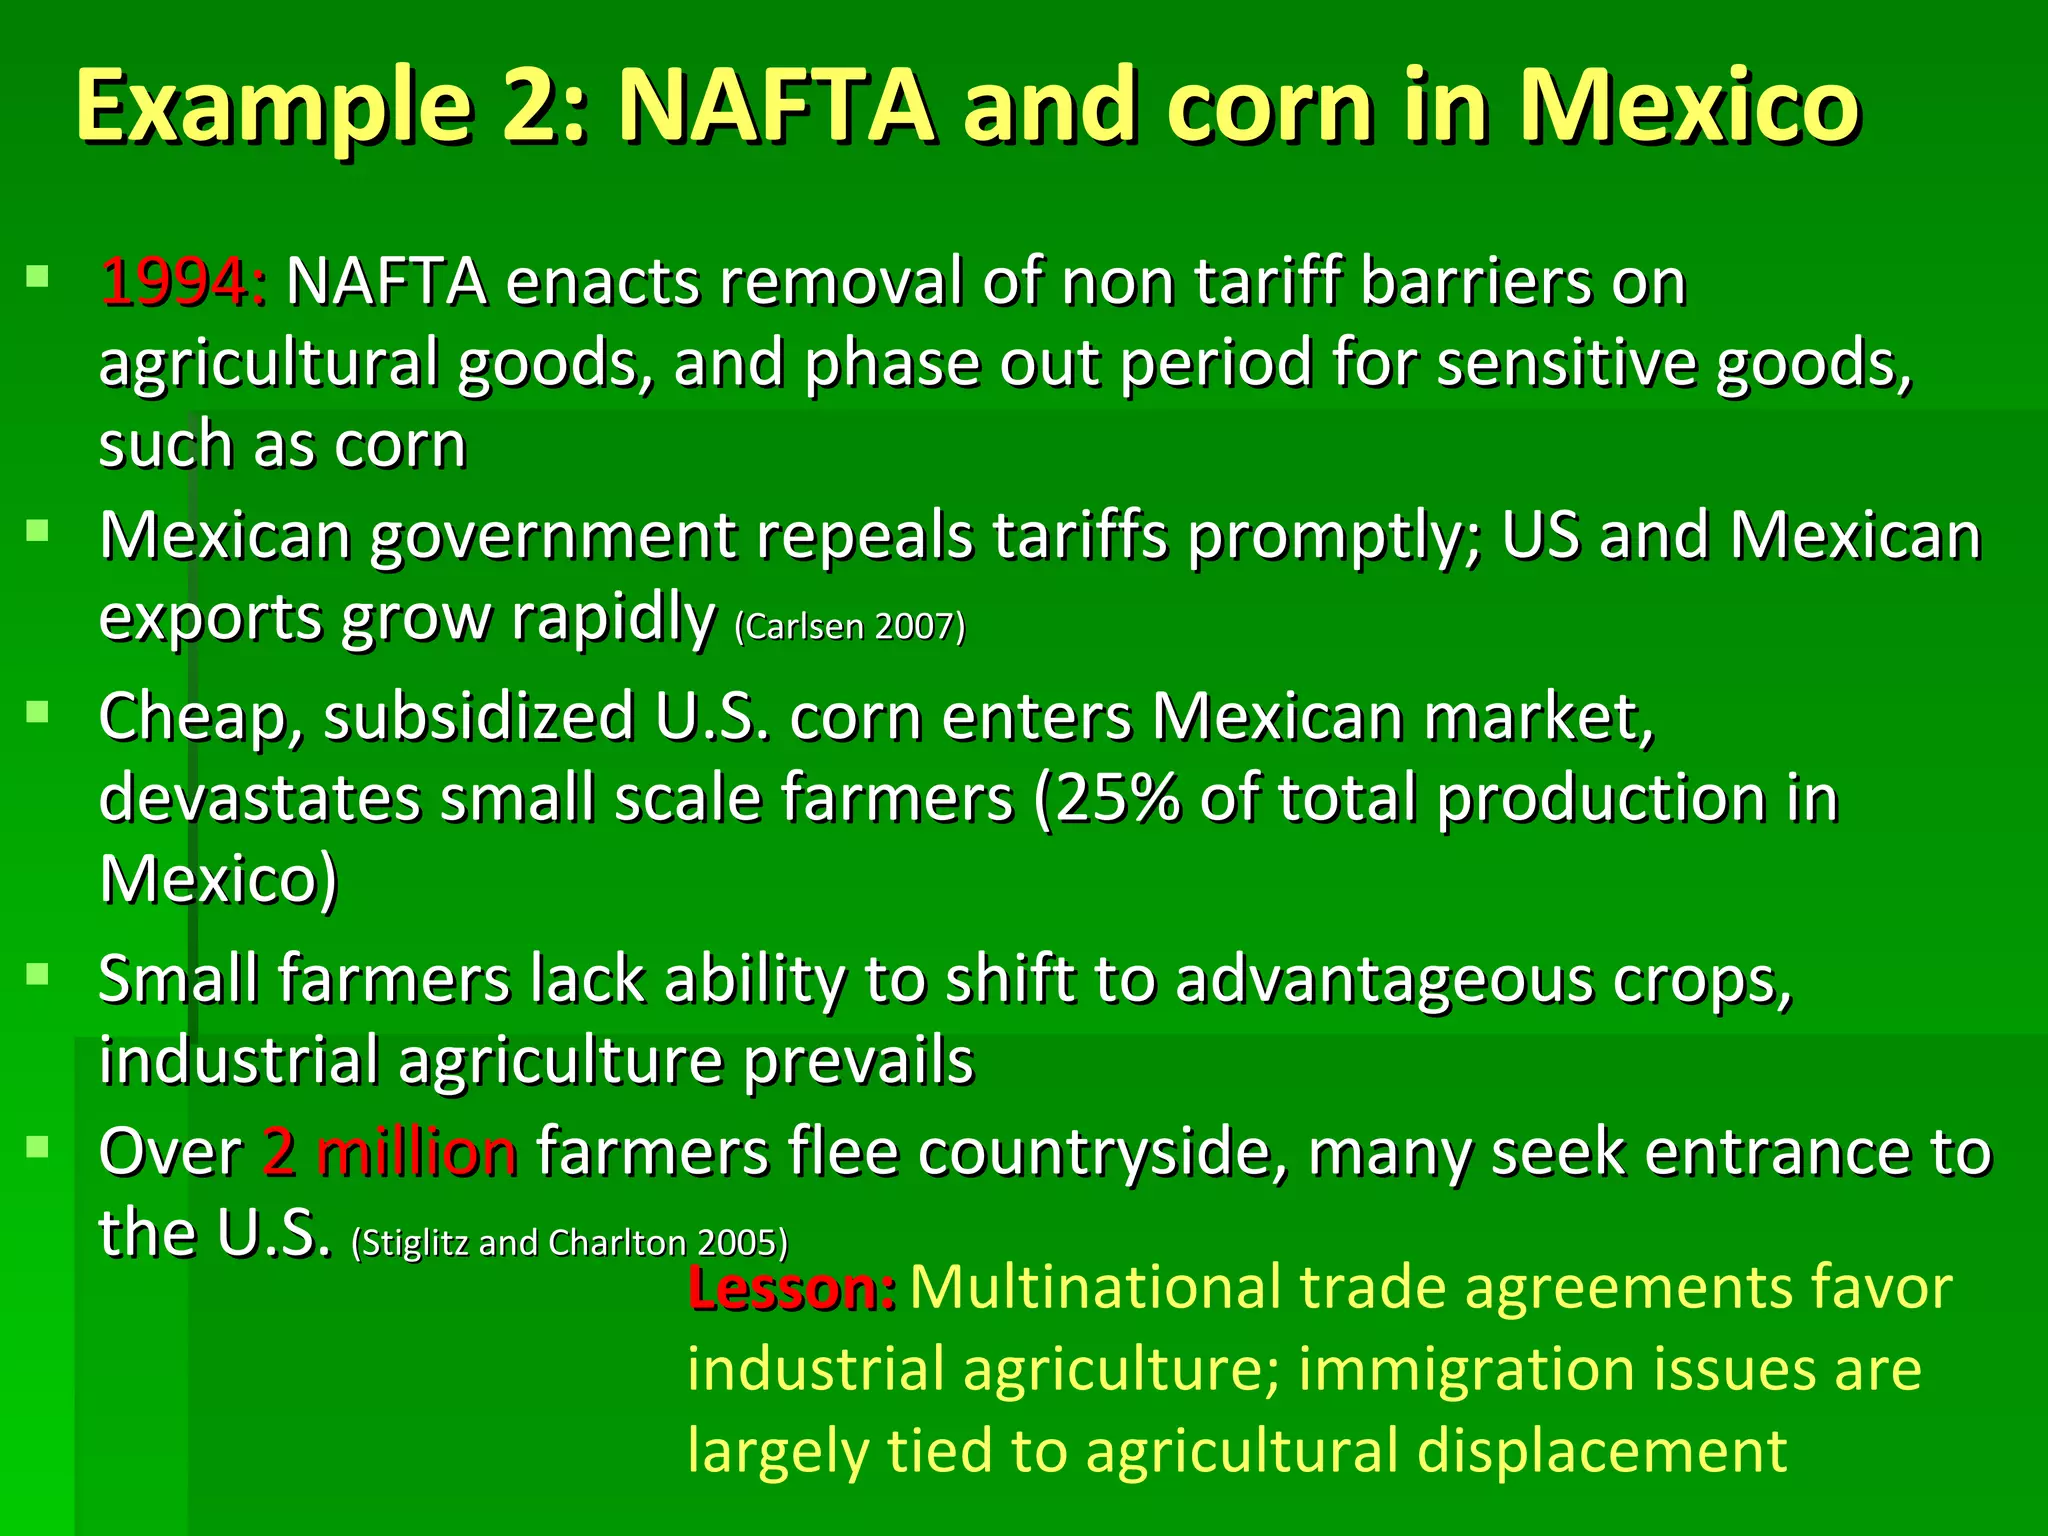
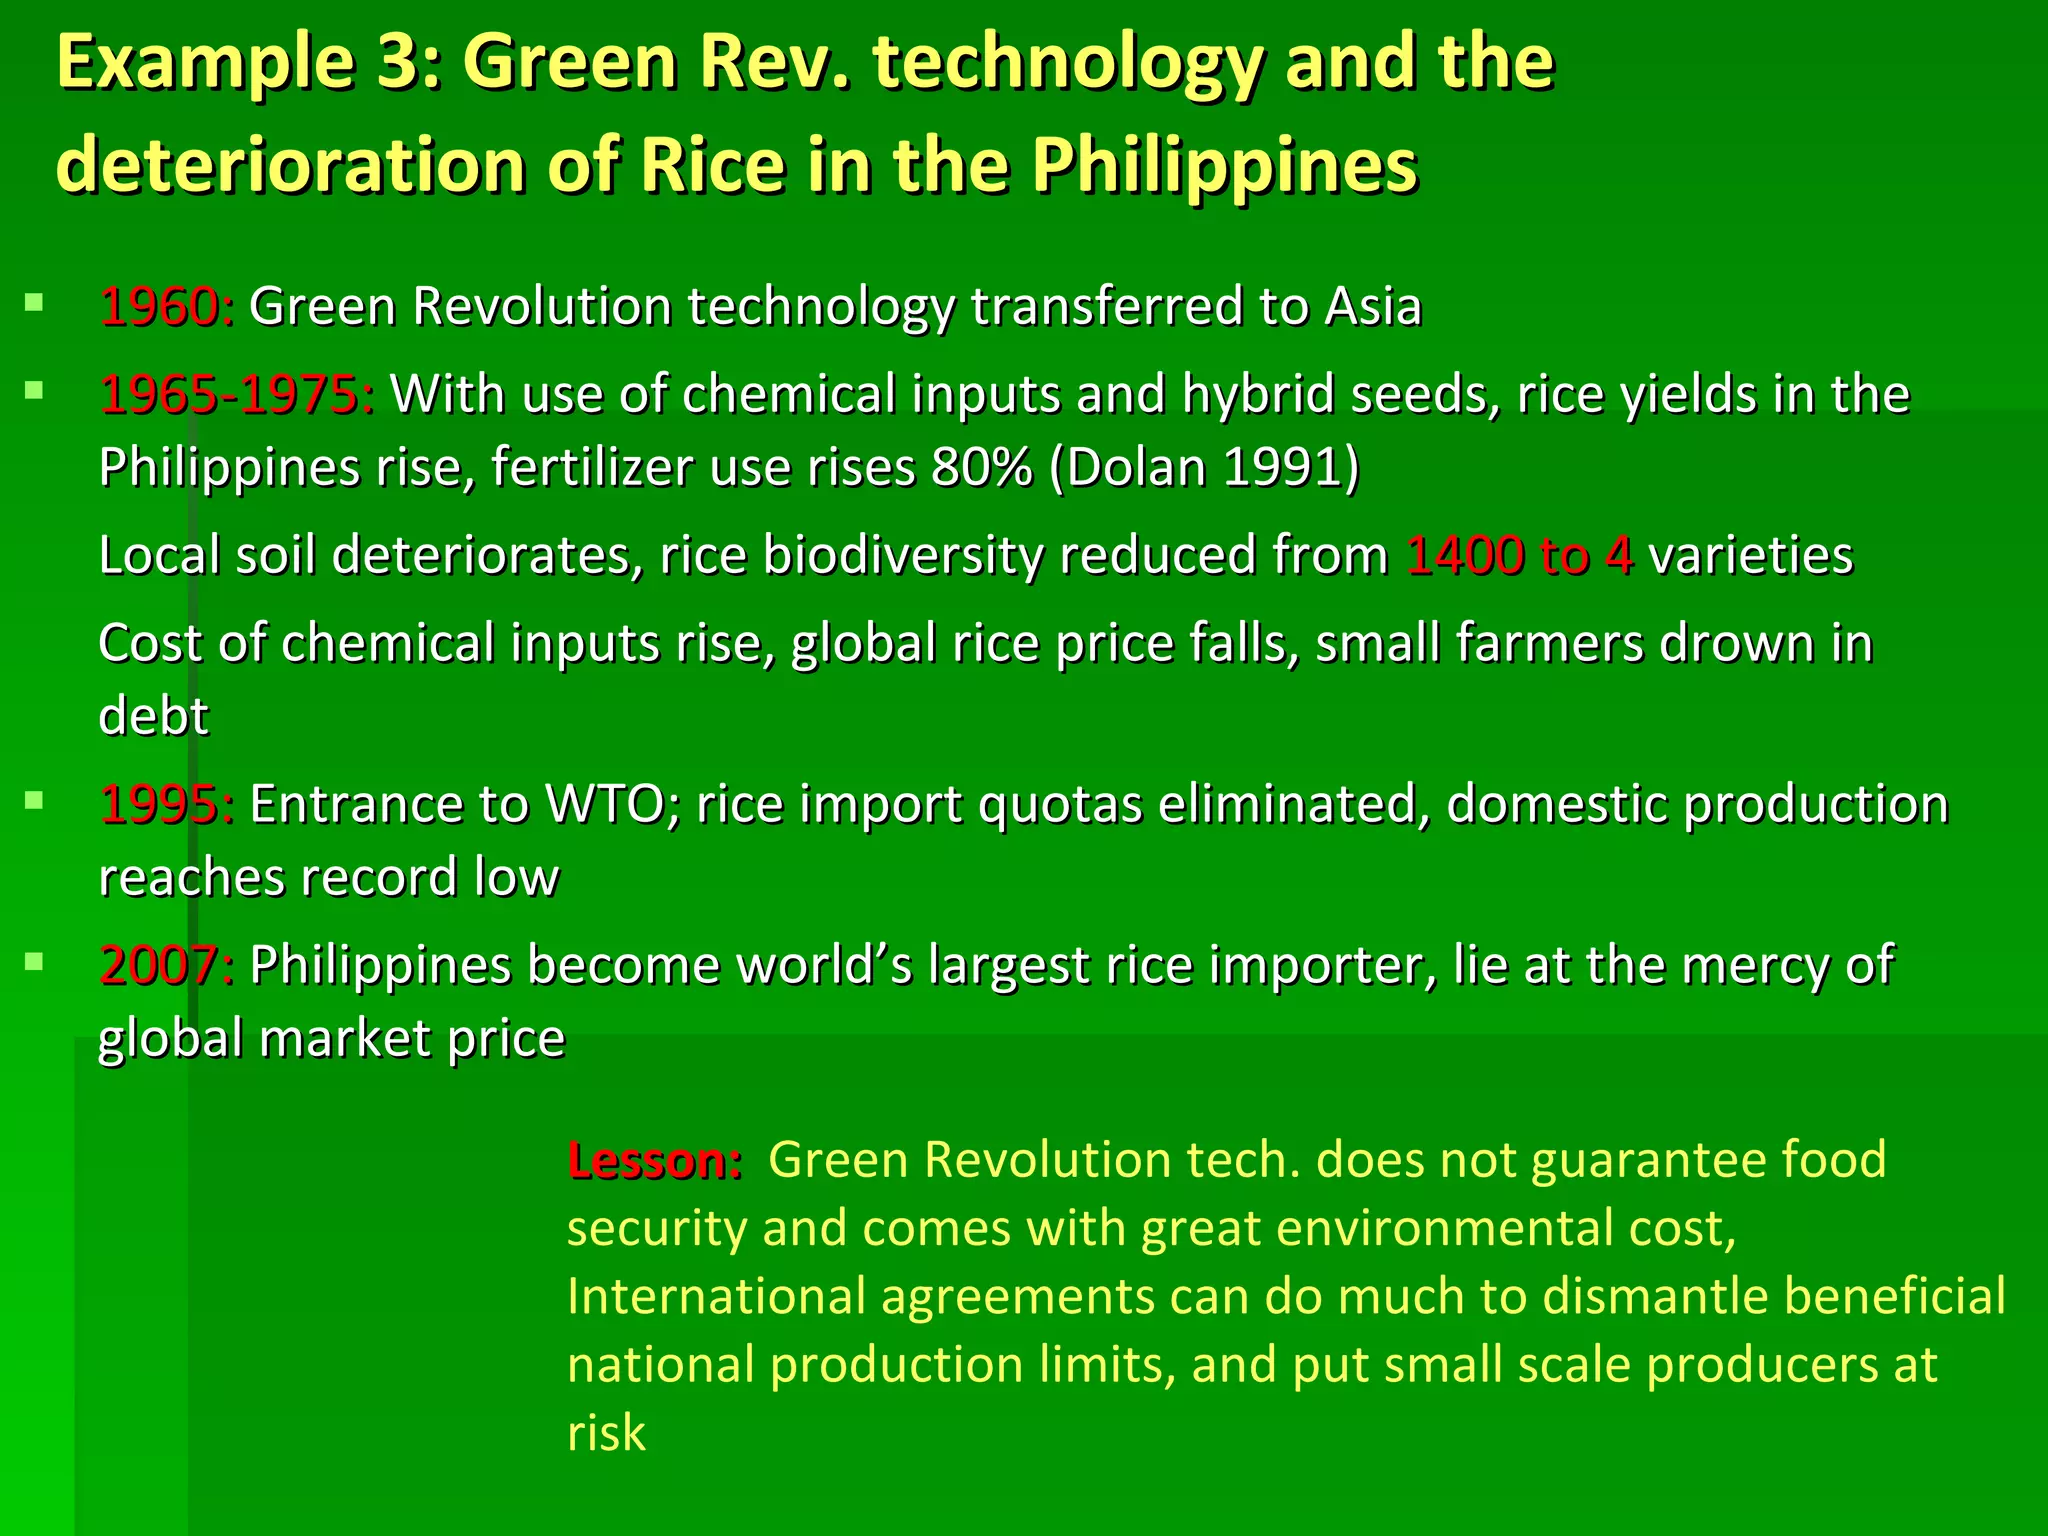
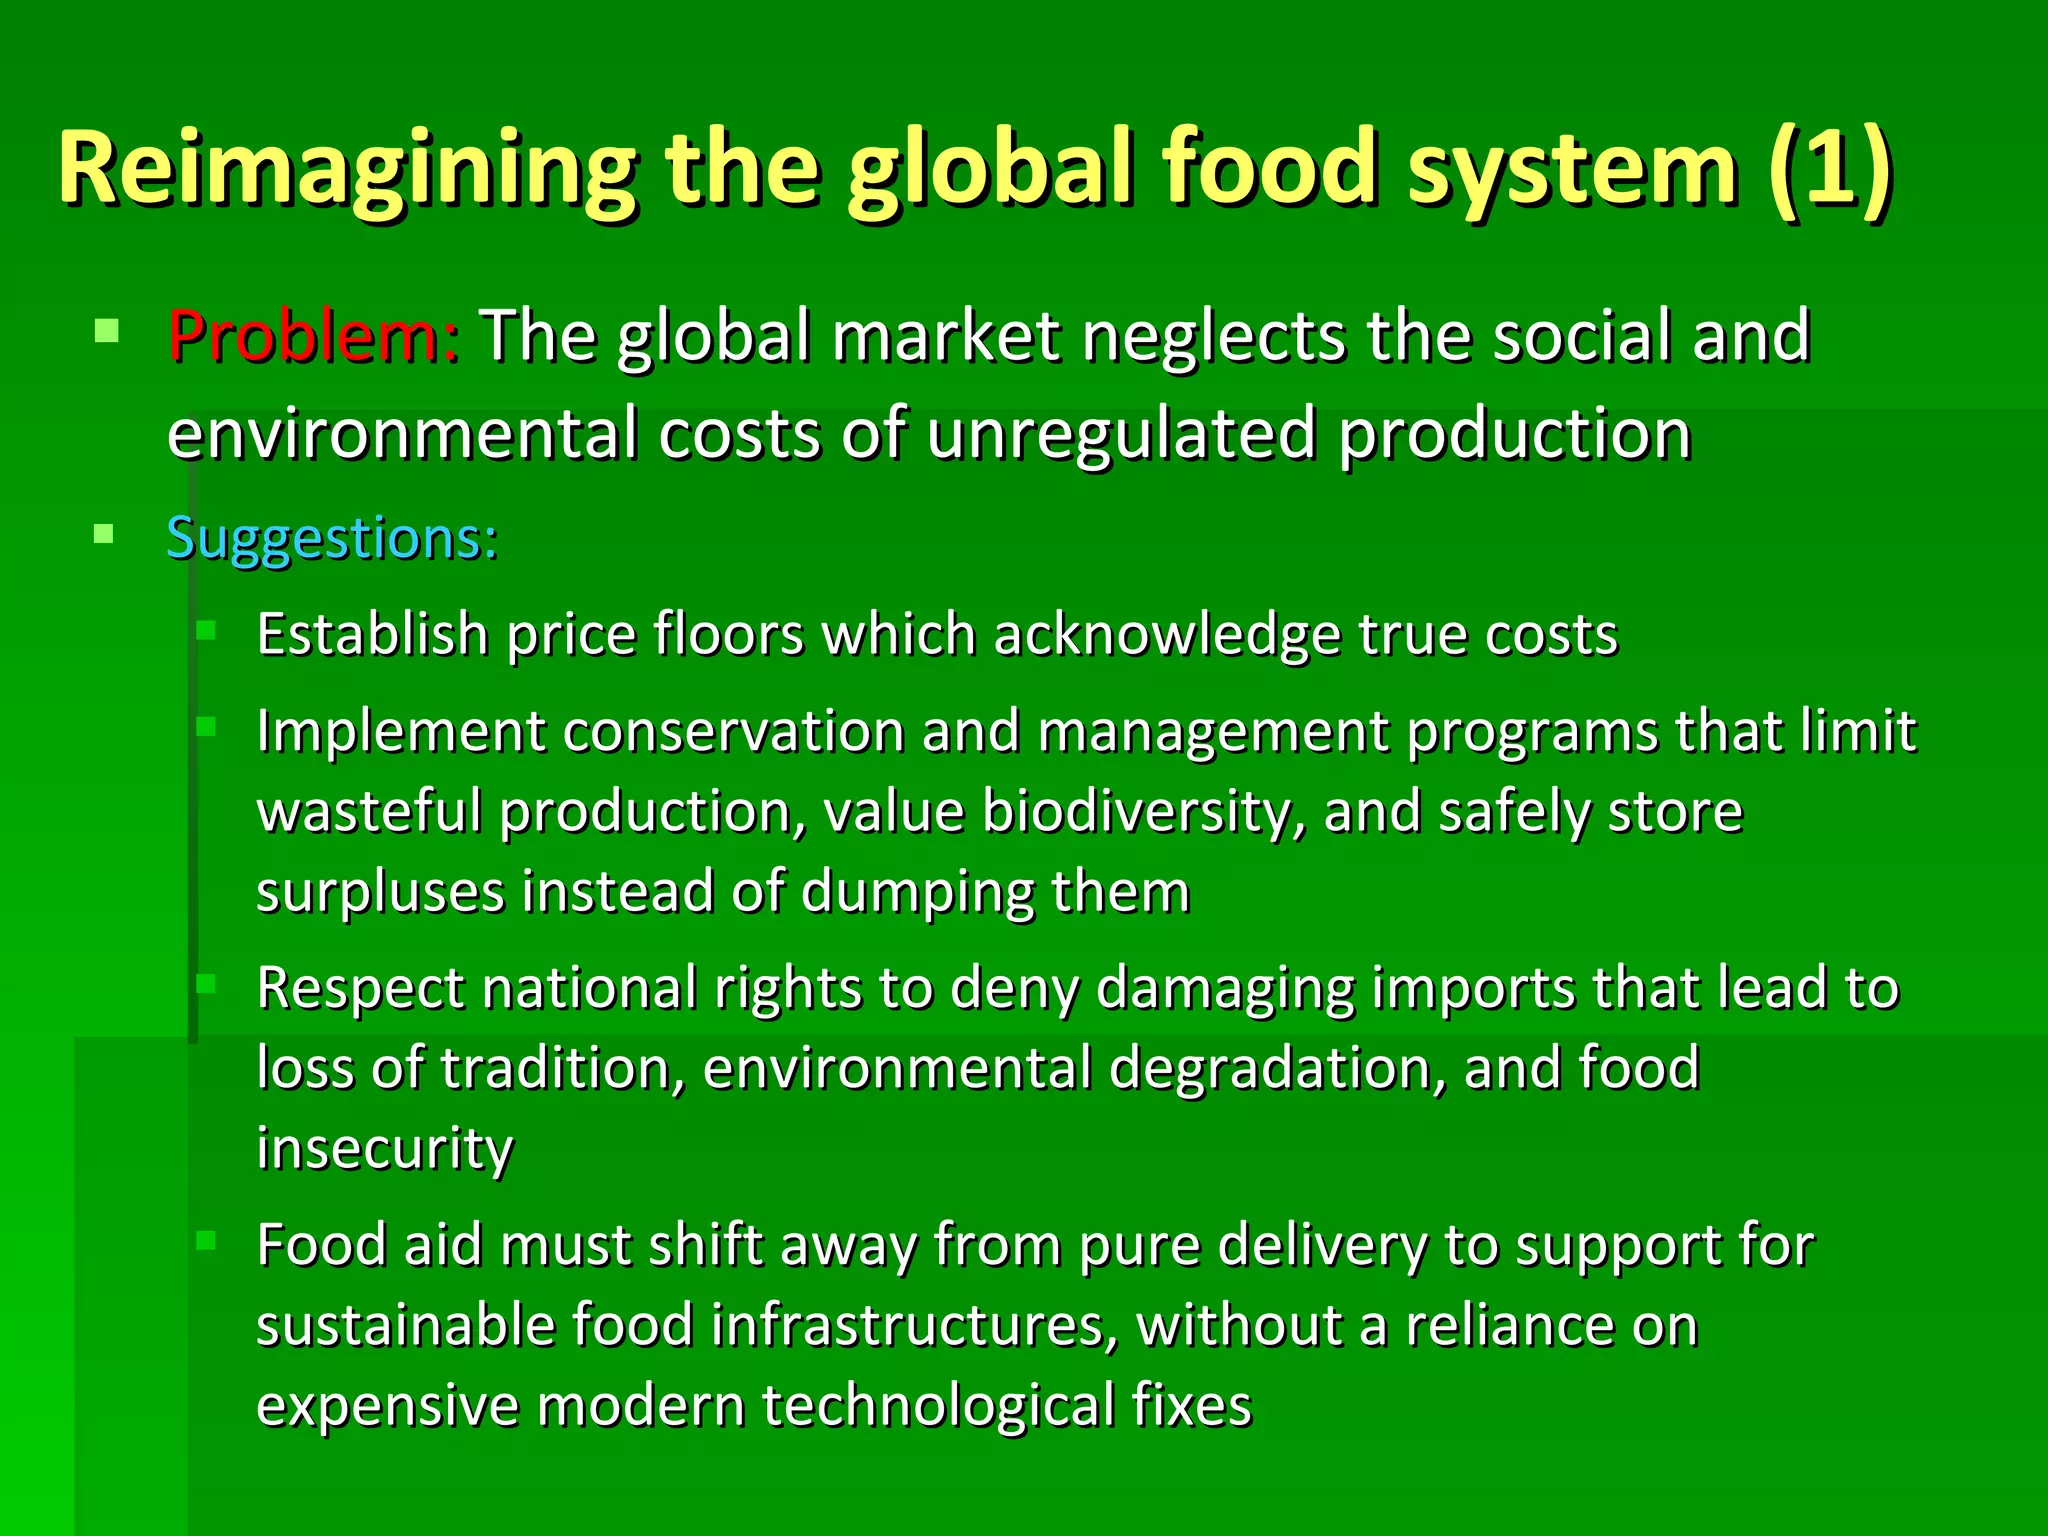
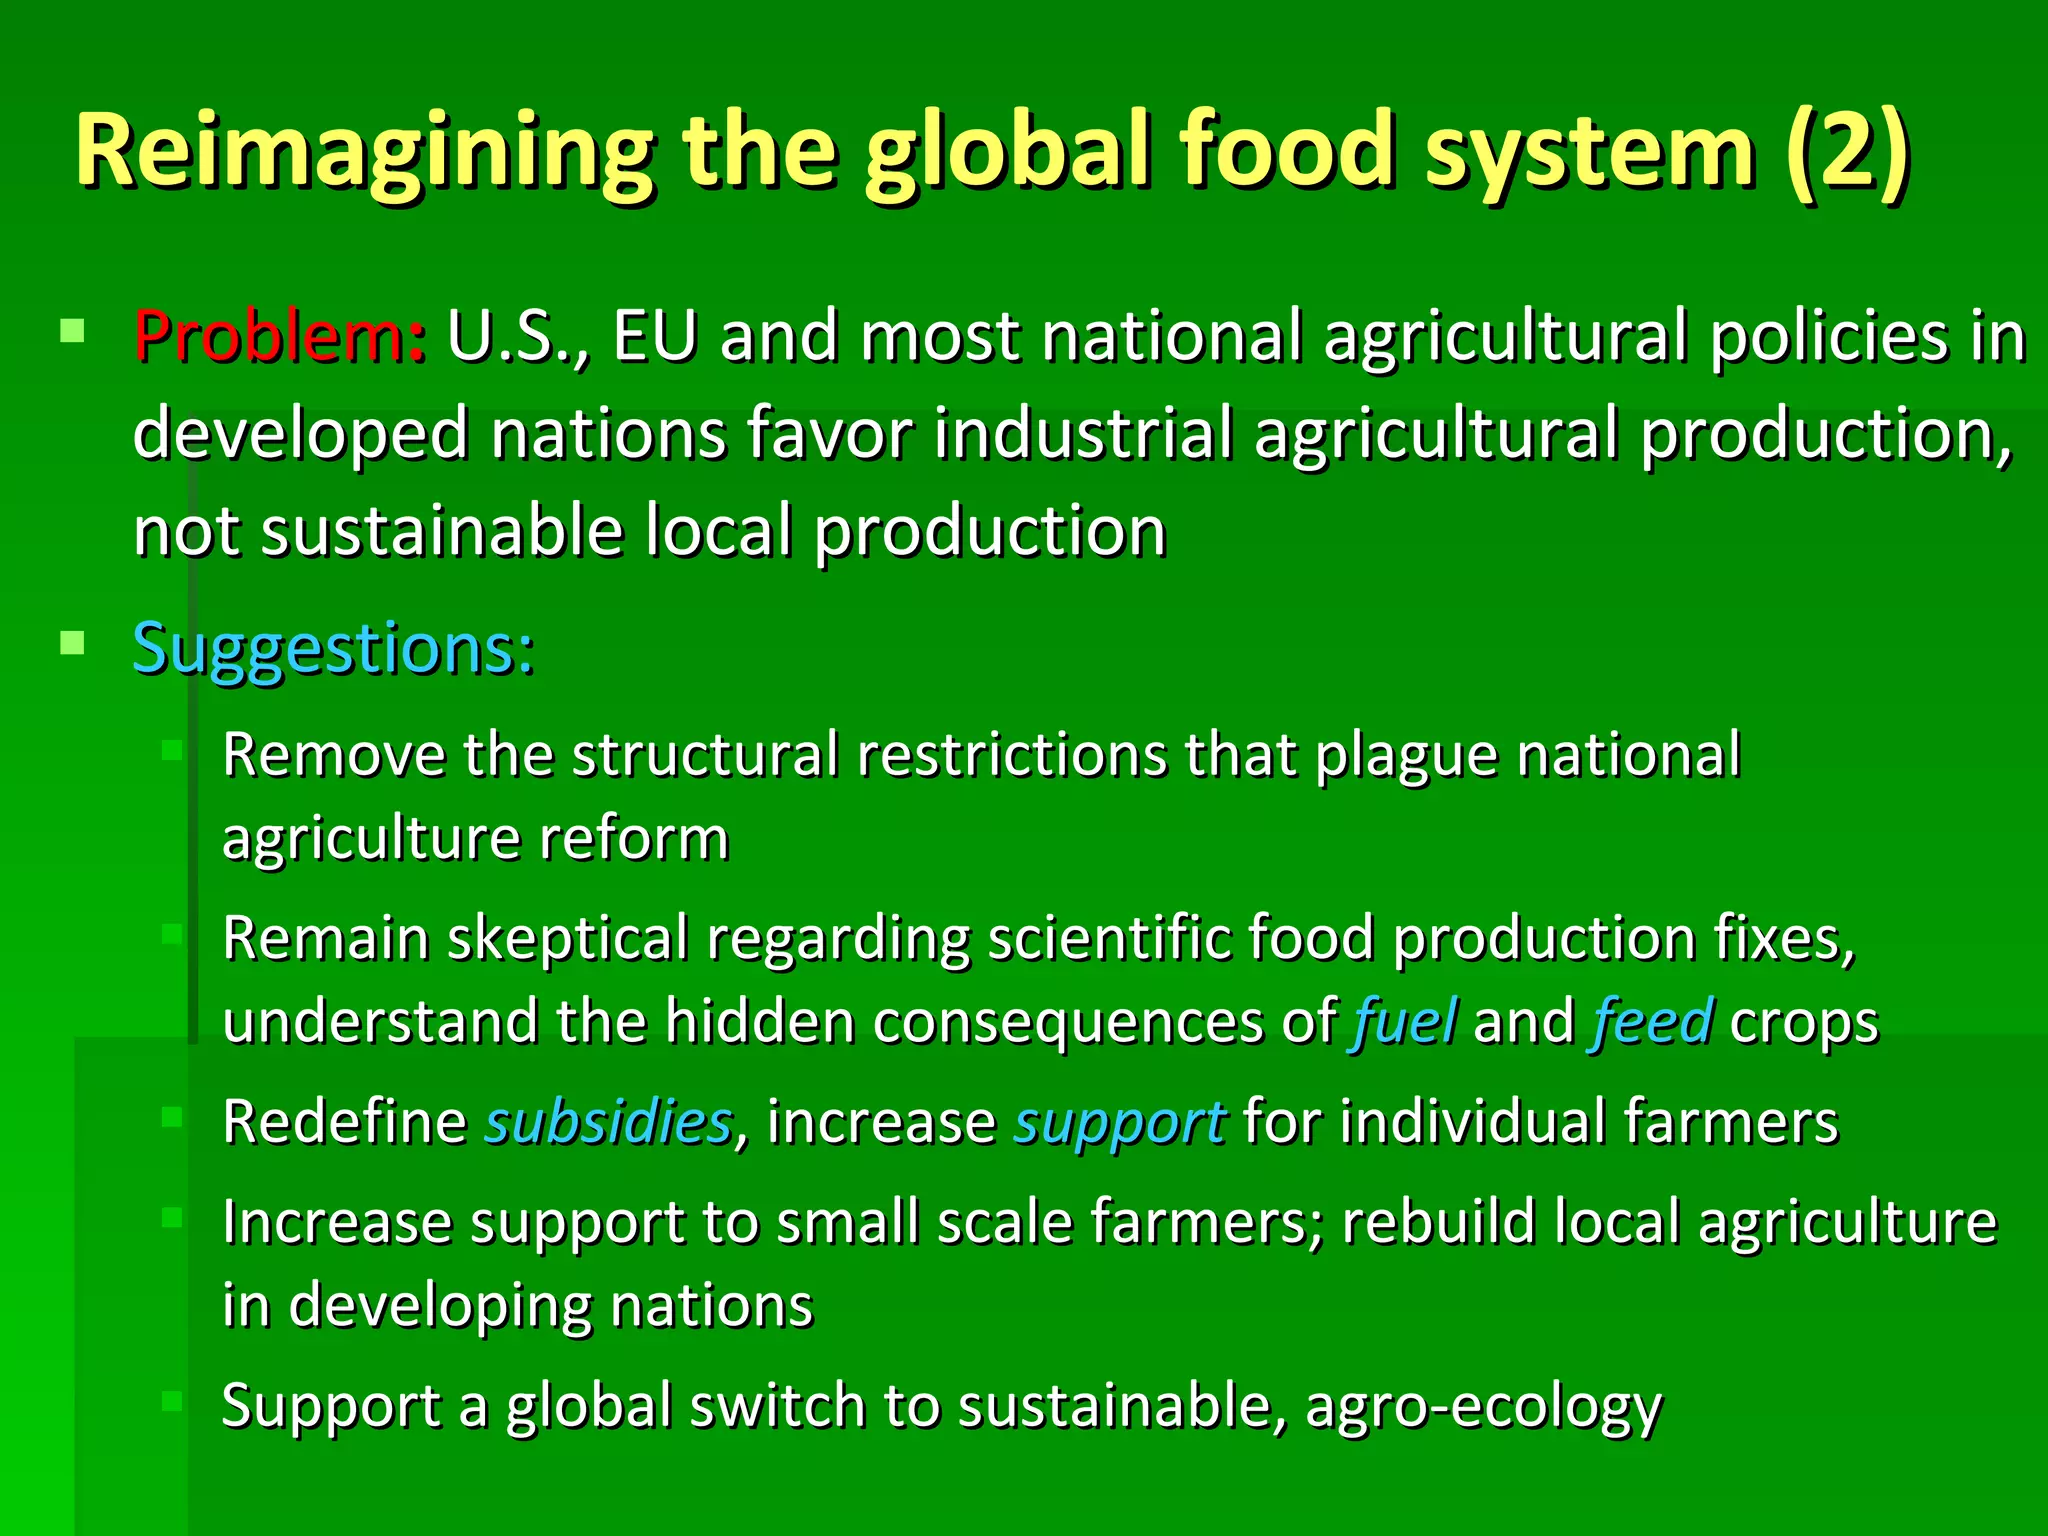
The document analyzes the global food system, highlighting the disparities and costs associated with industrial agriculture, food sovereignty, and the environmental impact of food production. It emphasizes the concentration of power in the market, leading to both food scarcity and obesity, and explores historical examples of how trade policies have disrupted local food systems. Recommendations include supporting sustainable agriculture practices, reforming agricultural policies, and promoting local food sovereignty to address these issues.

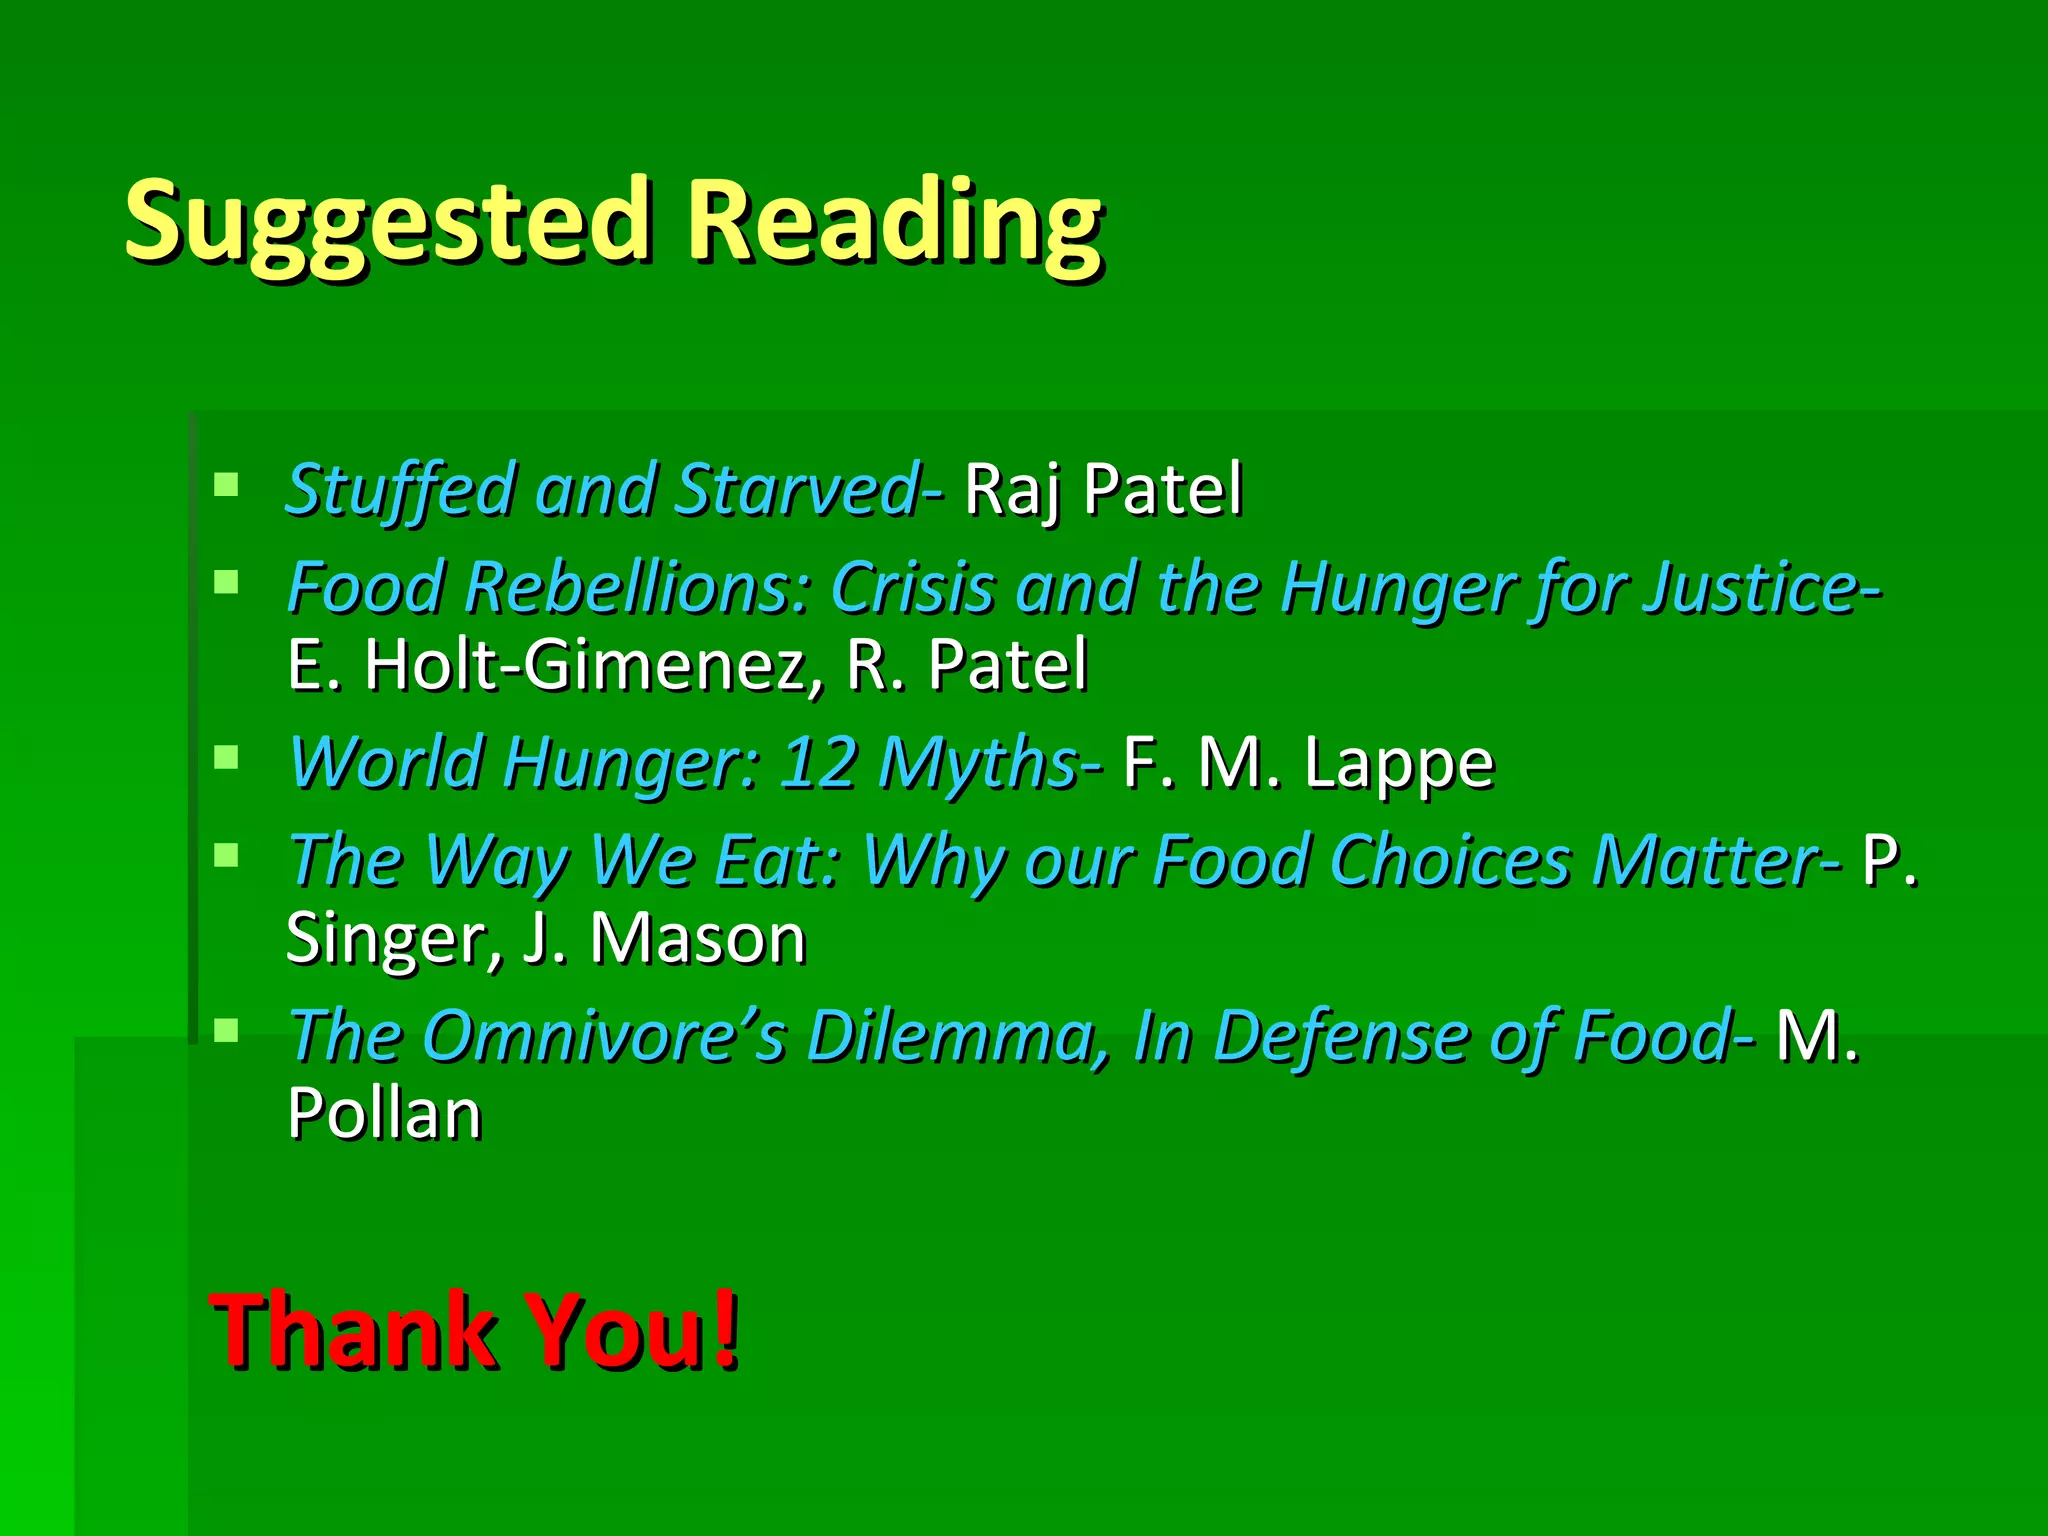
![Sources (1) Altieri, M. 1995. Agroecology: the Science of Sustainable Agriculture. Boulder: Westview Press. Badgley, C., Moghtader, J.K., Quintero, E., Zakem, E., Chappell, M.J., Aviles, K.R., Samulon, A., and Perfecto, I. 2007. Organic Agriculture and the Global Food Supply. Renewable Agriculture and Food Systems 22 (2): 86-108. British Broadcasting Company (BBC) 2008. Obesity in statistics. URL: http://news.bbc.co.uk/2/hi/health/7151813.stm [Consulted 13 January 2011] Carlsen, L. 2007. NAFTA Inequality and Immigration: Americas Policy Program. Mexico City: Interhemispheric Resources Center. Dolan, R.E., 1991. Philippines: A Country Study. Washington DC: GPO for the Library of Congress. Integrated Regional Information Networks (IRIN) 2009. Global: Feeding the world without harming it. URL: http:// www.irinnews.org/report.aspx?ReportID =86857 [Consulted 13 January 2011] International Monetary Fund (IMF) 2008. Haiti: Joint Staff Advisory Note of the Poverty Reduction Strategy Paper. IMF Country Report 08/114. Washington DC: International Monetary Fund Organization for Economic Co-operation and Development (OECD) 2010. Obesity and the Economics of Prevention: Fit not Fat. URL: http://www.oecd.org/document/31/0,3343,en_2649_33929_45999775_1_1_1_37407,00.html [Consulted 13 January 2011] Patel, R. 2007. Stuffed and Starved: The Hidden Battle for the World Food System. New York: Melville House Publishing](https://image.slidesharecdn.com/scifoodlecture-110217061538-phpapp01/75/Scifood-lecture-37-2048.jpg)
![Sources (2) Patel, R., and Holt-Giminez, E. 2009. Food Rebellions! Crisis and the Hunger for Justice. Cape Town: Pambazuka Press Steinfeld, H., Gerber, P., Wassenaar, T., Castel, V., Rosales, M., and de Haan, C. 2006. Livestock’s Long Shadow; Environmental Issues and Options. Edited by LEAD. Rome: Food and Agriculture Organization. Stiglitz, J. and Charlton, A. 2005. Fair Trade for All: How Trade Can Promote Development. New York: Oxford University Press. United Nations Food and Agriculture Organization (FAO) 2002. Reducing poverty and hunger: The critical role of financing for food, agriculture and rural development. URL: http://www.fao.org/docrep/003/Y6265e/y6265e00.htm [Consulted 13 January 2011] ____2008. Estimated World Water Use. URL: http://www.fao.org/nr/water/art/2008/wateruse.htm [Consulted 13 January 2011] ____ 2010. Global hunger declining, but still unacceptably high: Internation hunger targets still difficult to reach. URL: http://www.fao.org/docrep/012/al390e/al390e00.pdf [Consulted 13 January 2011]](https://image.slidesharecdn.com/scifoodlecture-110217061538-phpapp01/75/Scifood-lecture-38-2048.jpg)


