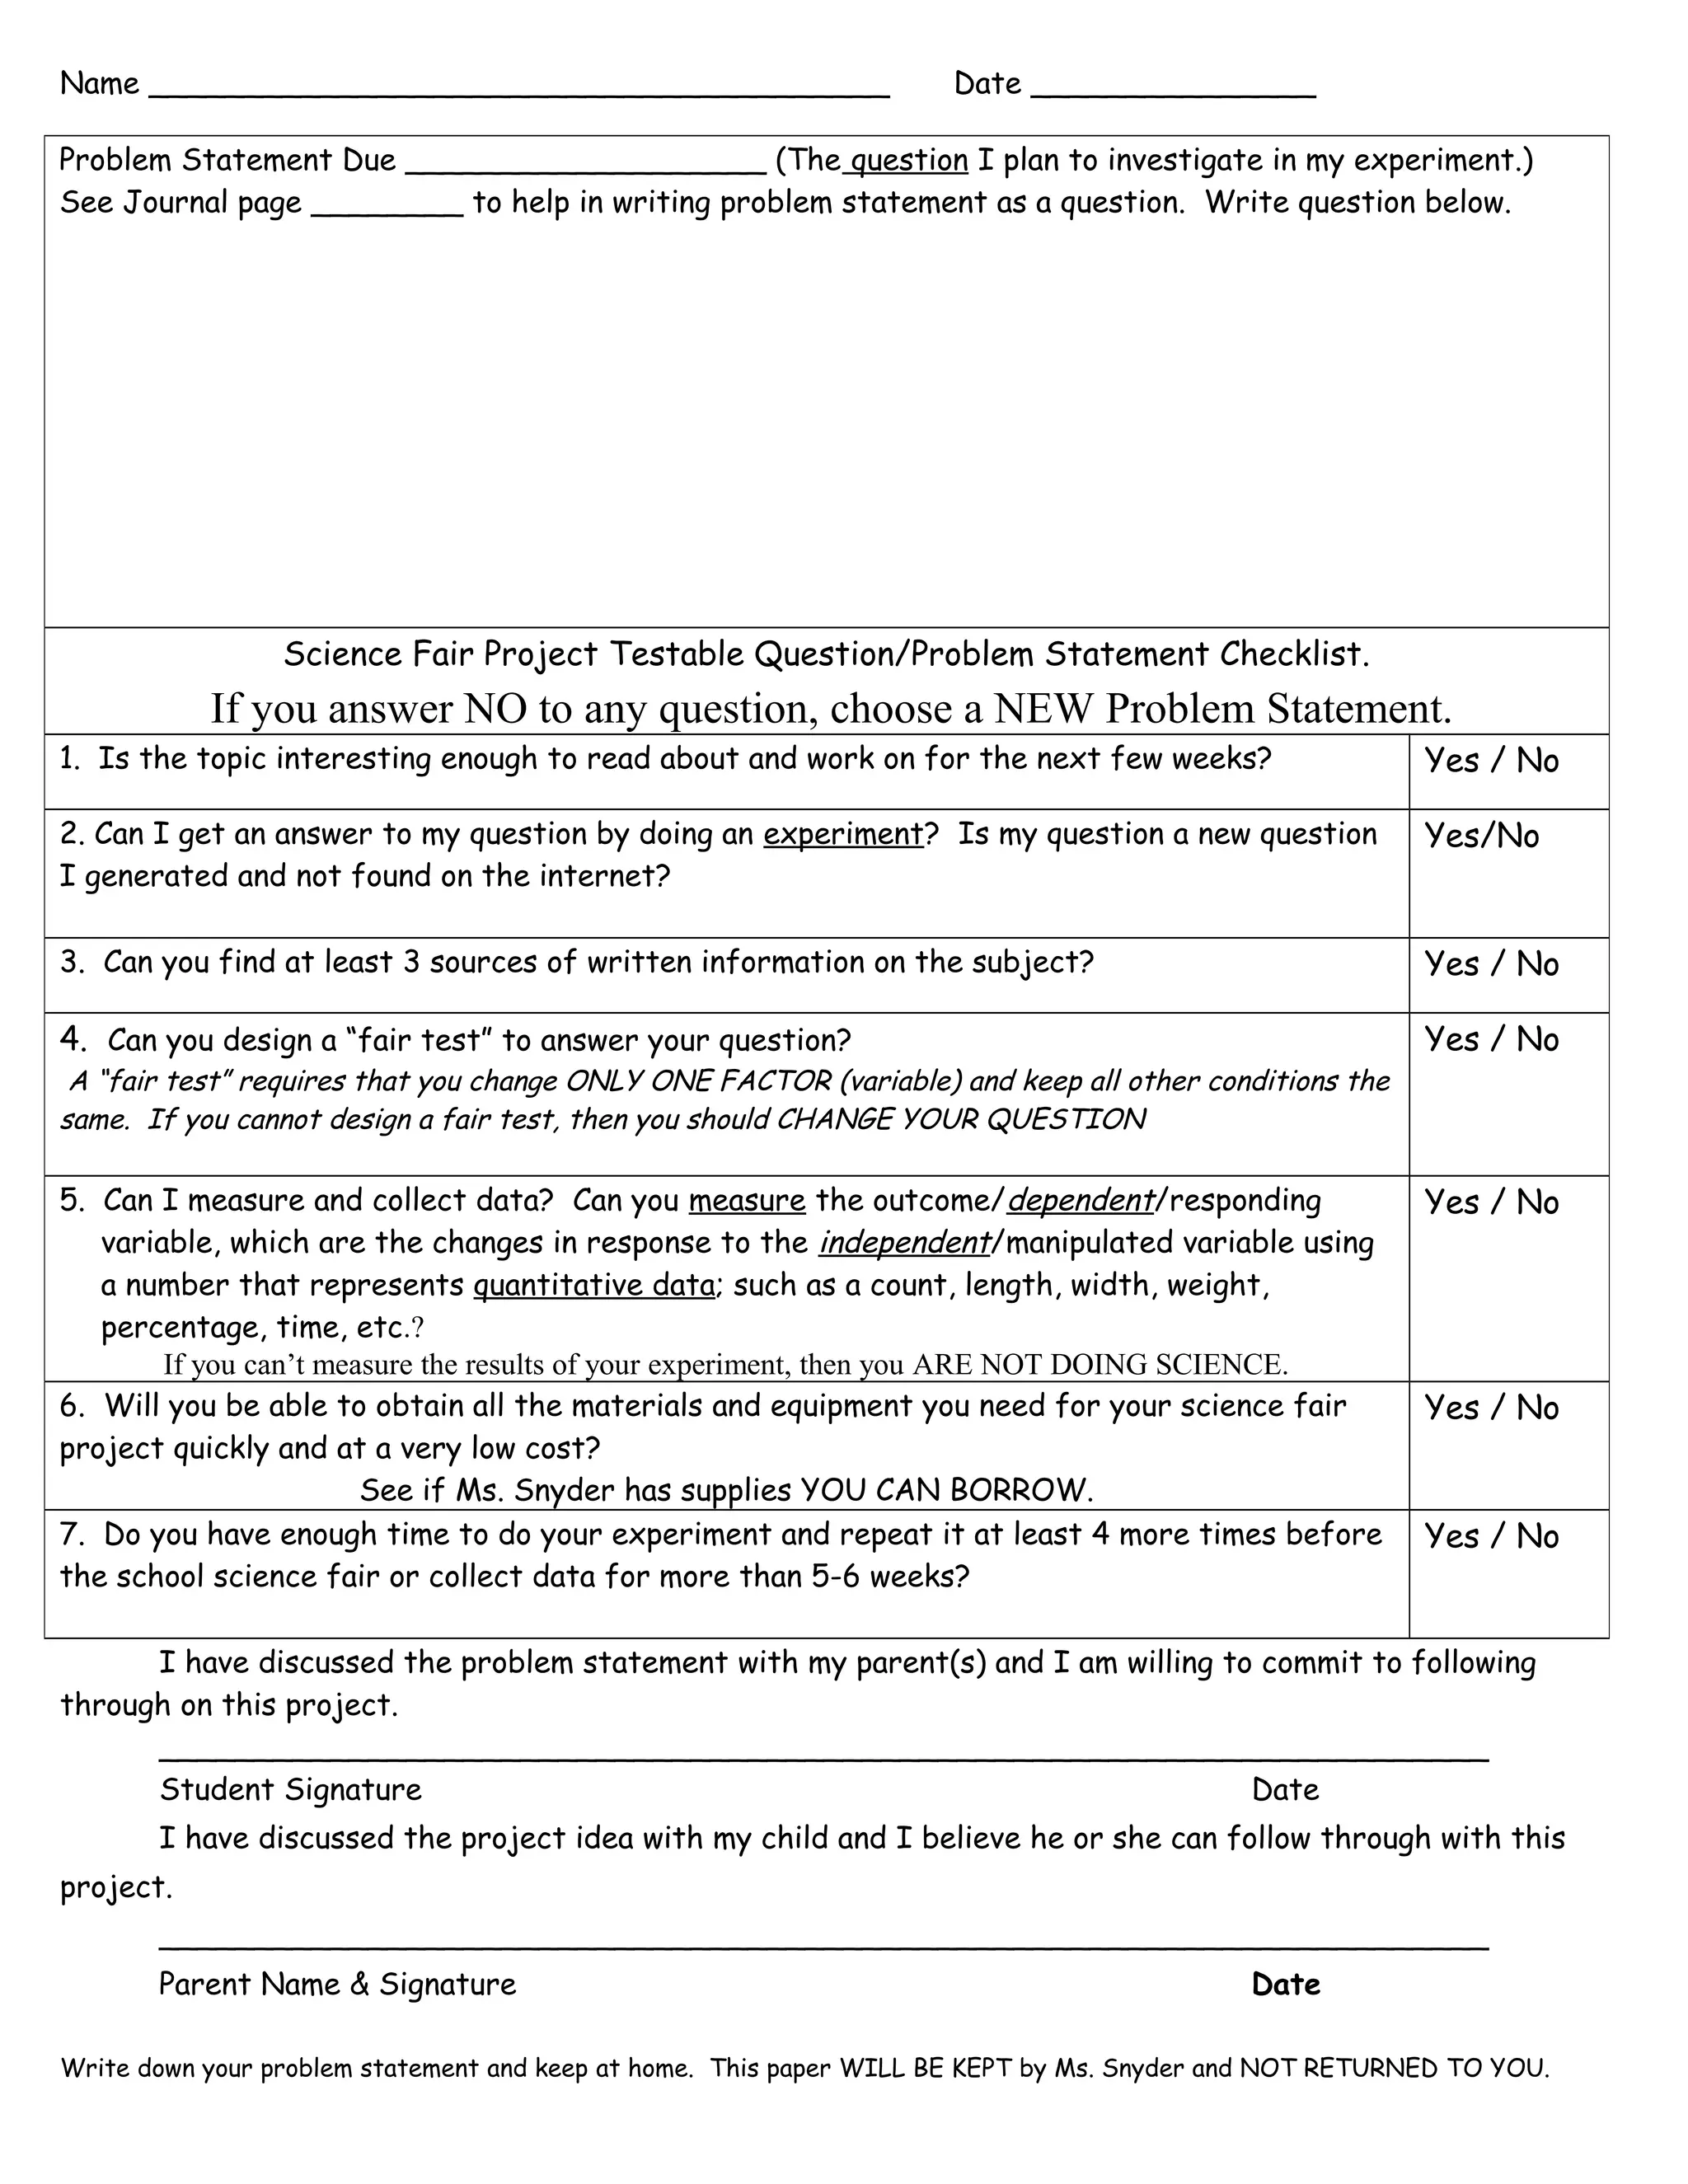
Name _______________________________________ Date _______________
I have discussed the problem statement with my parent(s) and I am willing to commit to following
through on this project.
______________________________________________________________________
Student Signature Date
I have discussed the project idea with my child and I believe he or she can follow through with this
project.
______________________________________________________________________
Parent Name & Signature Date
Write down your problem statement and keep at home. This paper WILL BE KEPT by Ms. Snyder and NOT RETURNED TO YOU.
Problem Statement Due ___________________ (The question I plan to investigate in my experiment.)
See Journal page ________ to help in writing problem statement as a question. Write question below.
Science Fair Project Testable Question/Problem Statement Checklist.
If you answer NO to any question, choose a NEW Problem Statement.
1. Is the topic interesting enough to read about and work on for the next few weeks? Yes / No
2. Can I get an answer to my question by doing an experiment? Is my question a new question
I generated and not found on the internet?
Yes/No
3. Can you find at least 3 sources of written information on the subject? Yes / No
4. Can you design a “fair test” to answer your question?
A “fair test” requires that you change ONLY ONE FACTOR (variable) and keep all other conditions the
same. If you cannot design a fair test, then you should CHANGE YOUR QUESTION
Yes / No
5. Can I measure and collect data? Can you measure the outcome/dependent/responding
variable, which are the changes in response to the independent/manipulated variable using
a number that represents quantitative data; such as a count, length, width, weight,
percentage, time, etc.?
If you can’t measure the results of your experiment, then you ARE NOT DOING SCIENCE.
Yes / No
6. Will you be able to obtain all the materials and equipment you need for your science fair
project quickly and at a very low cost?
See if Ms. Snyder has supplies YOU CAN BORROW.
Yes / No
7. Do you have enough time to do your experiment and repeat it at least 4 more times before
the school science fair or collect data for more than 5-6 weeks?
Yes / No
Name ______________________________ Date ___________
Variables and hypothesis due ______________________
Write down your variables and hypothesis and keep at home. This paper WILL
BE KEPT by Ms. Snyder and NOT RETURNED TO YOU.
VARIABLES:
Independent Variable: __________________________________________
____________________________________________________________
Dependent Variable: ____________________________________________
____________________________________________________________
Constants/controlled Variables: ___________________________________
___________________________________________________________
Control Group (if applicable) ______________________________________
Hypothesis (*This MUST also be the hypothesis written on your backboard)
____________________________________________________________
____________________________________________________________
____________________________________________________________
Materials: List on another sheet of paper and attach.
Gr. 5 Science Fair Project Timeline 2015 – Due Thursday, December 3rd
Student:
Parent Signature ________________________________________
Task 1, 2, 3, and 4 are part of homework and required to be turned in to Ms. Snyder
prior to each deadline or your homework grade will be recorded as a 0.
Task Due Date
1. Testable Question/Problem Statement – Determine
project topic. Write in the form of a question and give to Ms. Snyder for
approval.
NOTE: Any plant project needs at least 5 weeks of data
collection. If not, NO plant projects will be accepted.
See Science Journal for HOW to write a problem statement.
Turn in to Ms. Snyder
any time prior to:
Fri., Oct. 16th
2. Research– Research related topics and write a paper. At
least 2 paragraphs and include a Bibliography. EasyBib.com
(then export to Word). See project guidelines for more information.
Turn in to Ms. Snyder by
Fri., Oct 23rd
3. Variables – Controlled/Constants, independent, and
dependent variables determined along with identifying a control
group(if applicable)
Turn in to Ms. Snyder by
Thu., Oct 29th
4. Hypothesis and Materials List– Form your hypothesis as
“If…, then…” statement. Must be same hypothesis also
submitted with your FINAL PROJECT. Include a materials list.
Turn in to Ms. Snyder by
Thu., Oct 29th
Experiment Steps and Performance – Experiment steps
numbered and complete.* Complete a minimum of 5 trials of experiment
OR data collection over time period of 5 - 6 weeks. Take pictures (no
faces) of set-up, materials, experiment, results.
Complete week of
Nov. 2nd
– Nov,
13th
Data Gathering and Recording – Gather data as experiment is
performed. Finalize in a table or chart. Graph your results.
Complete week of
Nov. 16th
– Nov.
27th
Data Analysis, Conclusion, and Abstract – Write about
results in analysis. See Journal on How to Write a
Conclusion and directions in Project Guidelines on How to
write an Abstract
* See directions for how to correctly set-up for
backboard with Scientific Method steps*
Complete week of
Nov 30th
FINAL Project
Due
Thursday, Dec 3rd
Grade your own project using Science Fair grading rubric on the back to make sure ALL
elements are included in your project to receive the MOST points possible in each category.
ELEMENTARY SCIENCE FAIR 2015 GRADING RUBRIC FOR SCIENCE PROJECTS
Problem Statement 0 = No Problem Statement included
1 = Poorly written or not in a question form
2 = Complete well-written Problem Statement in question form
0 1 2
Hypothesis 0 = No hypothesis is included
1 = Complete hypothesis but not written correctly
2 = Hypothesis is complete and written as an If…, then… statement.
0 1 2
Procedures
- Numbered step by step
- Sentences begin with verbs
- Quantities to measure are
listed in metric units
0 = No overall procedural plan to confirm hypothesis
1 = Partial procedural plan to confirm hypothesis
2 = Sufficient procedural plan to confirm hypothesis
3 = Well-written plan, numbered step by step, sentences beginning with verbs
4 = Well-written as above and detailed including repeatability and specified measurements of
materials used in experiment
0 1 2 3 4
How well are all variables
recognized?
-Test (independent/manipulated)
-Outcome (dependent/responding)
-Control (if applicable)
-Constants/Controlled Variables
0 = No variables or constants are recognized
1 = Some variables or some constants are recognized
2 = All variables are recognized, but not all constants and controls (if applicable)
3 = All variables & constants and controls (if applicable) are recognized; IV or DV
incorrect
4 = All variables & constants and controls (if applicable) are clearly and appropriately
recognized in project log notebook
0 1 2 3 4
Materials and Equipment
Were the items:
- listed in column form
- equipment specifically named
- metric units are used
0 = No materials identified or used
1 = Materials not specifically identified and/or used properly
2 = Materials specifically identified but used improperly
3 = Materials specifically identified in column form and used properly
4 = Materials specifically identified in column form & metric units used properly
0 1 2 3 4
Results
To what degree have the results been
interpreted?
0 = No written narrative interpretation of data
1 = Partial written narrative interpretation of data
2 = Correct written narrative interpretation of data
3 = Comprehensive narrative interpretation of data including averaging
4 = Comprehensive and clear interpretation of data above expectations
0 1 2 3 4
Conclusion
To what degree are the conclusions
recognized and interpreted? Including:
- the purpose of the experiment
- hypothesis supported/not
supported
- the major findings
0 = No conclusion of data.
1 = Incomplete conclusion of data. Did not reference hypothesis
2 = Correct/complete conclusion/interpretation of data with reference to hypothesis
3 = Well-written conclusion/interpretation of data with reference to hypothesis
4 = Well-written conclusion/interpretation of data with reference to hypothesis with major
findings and possible explanations for them; states if data supports or does not support
hypothesis
0 1 2 3 4
Application
To what degree are the applications
recognized and interpreted?
- Use of the findings
0 = No application included in project log notebook
1 = Application included in project log notebook
2 = Well written application with new questions recognized included in project log
notebook
0 1 2
Display Attributes(see display
board for attributes requirements)
- free standing
- correct grammar/ spelling
- clear and legible
- attractive visual display
0 = Unsatisfactory quality of display - more than three attributes are missing
1 = Poor quality of display - only two or three attributes are missing
2 = Average quality- only one attribute missing with minor errors and of fair quality
3 = Good quality – all attributes present and with few if any minor errors
4= Superior display – all attributes present and of exemplary quality
0 1 2 3 4
Creativeness and Level of
Difficulty
0 = Project does not provide new insights and is not creative
1 = Project does not provide any new insights and is a low level project
2= Project is creative and is above a low level project
3= Project is creative and is above a moderate project
4= Project and idea is very creative, provides new insights and the information generated is
new; a high level project
0 1 2 3 4
Trials and/or Data over time
* To receive credit for each trial data
MUST be included, easily read, and well
documented
0 = Less than 3 trials and/or less than three weeks of data collection
1 = Less than 4 trials and/or less than 4 weeks of data collection
2 = Less than 5 trials and/or less than 5 weeks of data collection
3 = At least 5 trials included but data is not clearly communicated and recorded
4 = More than 5 trials and/or over 5 weeks of data collected. Evidence is clearly communicated
and recorded to make results more valid.
0 1 2 3 4
Abstract & Bibliography
To what degree does the abstract and
bibliography describe the project and
support the research?
0 = No Abstract/No documentation of research
1 = Poorly written and one paragraph ONLY
2 = Poorly written and two paragraphs
3 = Well-written but does not describe all components of the required abstract
4 = Well-written and completely describes the project using the abstract guidelines
0 1 2 3 4
Oral Presentation
-How clear, well prepared and organized is
the presentation?
-How complete is the student’s
understanding of the experimental work
completed for their project?
0 = Poor presentation; cannot answer questions
1 = Poor presentation; partially answers questions
2 = Fair presentation; adequately answers most questions
3 = Good presentation; precisely answers most questions
4 = Exemplary presentation and knowledge; precisely answers all questions
0 1 2 3 4
Project Log Notebook 0= No project log notebook included
1= Only information on backboard included in notebook
2= All information including variables and application included in log notebook
0 1 2
Total Points Received __________
Total Points Possible 48
  
Science Project Guidelines
Step 1 Problem Statement (Topic) Due Friday, October 16th
Step 2 Background Information/Research Due Friday, October 23rd
Once you have chosen your topic, it is important to research the materials on your
subject. By finding out information about the subject, you will gain a better
understanding of your problem. Look for information that will help you understand
your topic better and will help you design your experiment, as well as help form a more
educated hypothesis.
*Follow these guidelines for conducting your research:
1. Read books and articles on your subject. Make sure this information is up to date (not
older than 5-10 years).
2. Interview and talk with people who are knowledgeable about your subject.
3. Submit to Ms. Snyder, at least 2 paragraphs of what you learned about your topic.
****RESEARCH is not included on your Display Board******
Step 3 Identify Variables Due Thu., Oct 29th
(turn in on form which also includes your Problem
Statement and Hypothesis)
Scientists use an experiment to search for cause and effect relationships in nature. In
other words, they design an experiment so that changes to one item cause something
else to vary in a predictable way. An experiment has 3 variables:
• independent – What is being changed?
• dependent – What is responding to the change? This is what you
MEASURE
• controlled variables: What stays the same? List EVERYTHING
Step 4 Hypothesis and Materials Due Thursday, Oct 29th
1. A hypothesis states what you think is going to happen when you investigate a
question.
2. A good hypothesis is able to be tested. The hypothesis should NOT start with
the words, “I think” or “I hope” because it should be stated as a FACT. It should
be an If…, then… statement.
Materials Due Thursday, Oct 29th
List all the materials used in your experiment. Include specific details such as size and
quantity. Remember scientists ONLY USE METRIC units.
Good Example: Poor Example:
1. 3 – 15x15 cm. sheets of each paper 1. Paper Towels
Towel: Brawny, Viva, and Bounty. 2. Measuring Cup
2. 1 20x20 cm. square cake pan 3. Water
3. 750 ml water, 20° Celsius 4. Container
4. Celsius thermometer 5. Thermometer
5. Clock with a second hand 6. Clock
Step 5: Procedures complete week of November 2nd
–Nov. 13th
(DO NOT HAVE TO TURN IN)
List your step-by-step directions like a recipe. Anyone who reads them should be able to duplicate
your experiment. You CANNOT do an experiment only once and must perform a sufficient number of
TRIALS or tests. You must complete at least 5 trials for full credit. Include the trials you are
planning in your procedures. Do not write what YOU did (avoid words such as “I” and “me”)
Example:
1. Cut 3 – 15x15 cm. Sq. from each brand of paper towels.
2. Label each cut piece with brand name.
3. Pour 50 ml. of 20° Celsius water into 20x20 cm. sq. pan
4. Place 1 square of generic brand paper towel into the water and pan
5. Leave for 30 seconds
6. Remove paper towel
7. Measure water remaining in pan and record
8. Dry the cake pan
9. Repeat steps 4 through 8 for each brand of paper towel
10. Repeat entire process four more times for each brand of paper towel
Step 6 Data Collection Complete week of November 16th
–Nov. 27th
Data refers to information gathered during your experiment. Writing in a spiral
notebook is the most convenient way to keep a log.
*Your log should include:
1. A list of all materials you use.
2. Notes on the preparations you made prior to starting your experiment.
3. Information about the resources you use (books, people, library, museum,
universities, etc.)
4. Detailed day-by-day notes on the progress of your project.
a. What you are actually doing
b. Problems you have with your experiment
c. Things you would change if you were doing this experiment again.
5. Any drawings that you feel might help explain your work.
6. Data that you gather from your experiment (notes, table, charts, graphs).
7. Be sure that you date each entry in your log. *The data collected during the course
of your experiment needs to be quantitative (measurable). *All measurements in your
experiment must be made in metric units.
Volume: milliliter (ml) 1000 mL = 1L Liter (L)
Length: millimeter (mm) 10mm=1cm Centimeter (cm), Meter (m) 1000m =1km Kilometer (km)
Mass: milligram (mg) 10mg=1cg Centigram (cg) 100cg=1g Gram (g) 1000g=1kg Kilogram (kg)
Step 7 Results and Conclusion Due with FINAL Project on Thursday, December 3rd
Examples: See How to Write a GREAT Conclusion handout in interactive journal on
page 37. Before you write your conclusion, carefully examine all your data (graphs,
charts, tables).
As yourself these questions:
1. Did you get the results you expected to get? If not-how were the results different?
2. Were there any unexpected problems or occurrences that may have affected the results of your
experiment?
3. Do you think you collected sufficient data? (Were there enough trials? Samples?)
Your conclusion should include:
1. Restatement of your original hypothesis
2. Statement of support or non-support of the original hypothesis (see journal page 33)
3. Description of any problems or unusual events that occurred during your experiment.
4. What you would do differently next time.
Step 8 Title and Abstract Due with FINAL Project on Thursday, December 3rd
Choose a title for your project that tells what your project is about. It could be “catchy” and get a
viewer’s attention. Example: “A Mixing Mystery” “Density Dilemma” “Let’s Play Ball!”
*THE TITLE CAN BE THE SAME AS THE PROBLEM STATEMENT or You can write a catchy title.
HOW TO WRITE AN ABSTRACT:
The abstract is a summary of the entire project. It is written in three paragraphs.
Paragraph #1 Purpose of the experiment and the Hypothesis
Paragraph #2 Procedures
Paragraph #3 Results and the Conclusion
Sample Abstract:
The purpose of this project is to determine under which colored lights a bean plant grows the tallest. It is
hypothesized that the bean plant will grow the tallest under blue light.
Three different colored lights were used in this experiment, white, blue and green. Fifteen bean plants were
bought at Home Depot. All plants were measured initially and were all 15cm tall. The plants were labeled A, B and
C then the trial number (A1, A2, A3, A4, A5, B1, B2, B3, B4, B5, C1, C2, C3, C4, C5). Five plants were then placed
under each of the three colored lights. Every day for 5 weeks at 3:30pm I would examine each bean plant, measure
and record the growth.
The results showed that the bean plants under the green light grew the tallest. The hypothesis was not
supported. To improve this study, I would collect data at different times of the day. I would also use bean seeds next
time to make sure each plant is starting at the same initial size.
Step 9 Application DUE WITH FINAL PROJECT on Thursday, December 3rd
• An application is how the project relates to real life.
o How can you use the findings from this experiment in your day-to-day life?
o What new question(s) has your experiment lead you to ask that could be tested in a new
experiment?
Example of an Application:
Having tested three brands of paper towels, Brawny, Viva, and Bounty for the best absorbency, it is now
known from this experiment that the from these three branded paper towels Bounty paper towel has the most
absorbency. With this information consumers may now be able to make a more scientific decision when choosing the
brand of paper towel. If the consumer wishes to purchase a paper towel product with more absorbency then Bounty is
the paper towel to purchase. However, not always does a consumer want the most absorbent paper towel and
therefore knowing this information the consumer will not purchase the Bounty paper towel but rather another brand,
perhaps Viva which absorbed the least from the three tested
Helpful Websites
http://science.dadeschools.net/scifair http://scienceprojects.com
http://rossarts.org/naples/ideas.htm http://terimore.com
http://www.all-science-fair-projects.com http://www.factmonster.com
http://www.sciencebuddies.org
REVISED FROM: http://drek8.dadeschools.net/Newsite/Docs/11-12_Docs/Science%20Fair%20Packet%202011-12.pdf
Project Notebook to include:
*Data collected during
each trial to include
quantitative and
qualitative data (see JP
15)
*All backboard data
*Variables
* Application
Title of the Project
Problem
Statement
Hypothesis
Abstract
Charts, graphs, surveys,
sketches, or photographs
Materials
Conclusion
Procedures
Data
Log Book Includes:
*Observations and
Data collected
Variables

Science fair packet

  • 1.
    Name _______________________________________ Date_______________ I have discussed the problem statement with my parent(s) and I am willing to commit to following through on this project. ______________________________________________________________________ Student Signature Date I have discussed the project idea with my child and I believe he or she can follow through with this project. ______________________________________________________________________ Parent Name & Signature Date Write down your problem statement and keep at home. This paper WILL BE KEPT by Ms. Snyder and NOT RETURNED TO YOU. Problem Statement Due ___________________ (The question I plan to investigate in my experiment.) See Journal page ________ to help in writing problem statement as a question. Write question below. Science Fair Project Testable Question/Problem Statement Checklist. If you answer NO to any question, choose a NEW Problem Statement. 1. Is the topic interesting enough to read about and work on for the next few weeks? Yes / No 2. Can I get an answer to my question by doing an experiment? Is my question a new question I generated and not found on the internet? Yes/No 3. Can you find at least 3 sources of written information on the subject? Yes / No 4. Can you design a “fair test” to answer your question? A “fair test” requires that you change ONLY ONE FACTOR (variable) and keep all other conditions the same. If you cannot design a fair test, then you should CHANGE YOUR QUESTION Yes / No 5. Can I measure and collect data? Can you measure the outcome/dependent/responding variable, which are the changes in response to the independent/manipulated variable using a number that represents quantitative data; such as a count, length, width, weight, percentage, time, etc.? If you can’t measure the results of your experiment, then you ARE NOT DOING SCIENCE. Yes / No 6. Will you be able to obtain all the materials and equipment you need for your science fair project quickly and at a very low cost? See if Ms. Snyder has supplies YOU CAN BORROW. Yes / No 7. Do you have enough time to do your experiment and repeat it at least 4 more times before the school science fair or collect data for more than 5-6 weeks? Yes / No
  • 2.
    Name ______________________________ Date___________ Variables and hypothesis due ______________________ Write down your variables and hypothesis and keep at home. This paper WILL BE KEPT by Ms. Snyder and NOT RETURNED TO YOU. VARIABLES: Independent Variable: __________________________________________ ____________________________________________________________ Dependent Variable: ____________________________________________ ____________________________________________________________ Constants/controlled Variables: ___________________________________ ___________________________________________________________ Control Group (if applicable) ______________________________________ Hypothesis (*This MUST also be the hypothesis written on your backboard) ____________________________________________________________ ____________________________________________________________ ____________________________________________________________ Materials: List on another sheet of paper and attach.
  • 3.
    Gr. 5 ScienceFair Project Timeline 2015 – Due Thursday, December 3rd Student: Parent Signature ________________________________________ Task 1, 2, 3, and 4 are part of homework and required to be turned in to Ms. Snyder prior to each deadline or your homework grade will be recorded as a 0. Task Due Date 1. Testable Question/Problem Statement – Determine project topic. Write in the form of a question and give to Ms. Snyder for approval. NOTE: Any plant project needs at least 5 weeks of data collection. If not, NO plant projects will be accepted. See Science Journal for HOW to write a problem statement. Turn in to Ms. Snyder any time prior to: Fri., Oct. 16th 2. Research– Research related topics and write a paper. At least 2 paragraphs and include a Bibliography. EasyBib.com (then export to Word). See project guidelines for more information. Turn in to Ms. Snyder by Fri., Oct 23rd 3. Variables – Controlled/Constants, independent, and dependent variables determined along with identifying a control group(if applicable) Turn in to Ms. Snyder by Thu., Oct 29th 4. Hypothesis and Materials List– Form your hypothesis as “If…, then…” statement. Must be same hypothesis also submitted with your FINAL PROJECT. Include a materials list. Turn in to Ms. Snyder by Thu., Oct 29th Experiment Steps and Performance – Experiment steps numbered and complete.* Complete a minimum of 5 trials of experiment OR data collection over time period of 5 - 6 weeks. Take pictures (no faces) of set-up, materials, experiment, results. Complete week of Nov. 2nd – Nov, 13th Data Gathering and Recording – Gather data as experiment is performed. Finalize in a table or chart. Graph your results. Complete week of Nov. 16th – Nov. 27th Data Analysis, Conclusion, and Abstract – Write about results in analysis. See Journal on How to Write a Conclusion and directions in Project Guidelines on How to write an Abstract * See directions for how to correctly set-up for backboard with Scientific Method steps* Complete week of Nov 30th FINAL Project Due Thursday, Dec 3rd Grade your own project using Science Fair grading rubric on the back to make sure ALL elements are included in your project to receive the MOST points possible in each category.
  • 4.
    ELEMENTARY SCIENCE FAIR2015 GRADING RUBRIC FOR SCIENCE PROJECTS Problem Statement 0 = No Problem Statement included 1 = Poorly written or not in a question form 2 = Complete well-written Problem Statement in question form 0 1 2 Hypothesis 0 = No hypothesis is included 1 = Complete hypothesis but not written correctly 2 = Hypothesis is complete and written as an If…, then… statement. 0 1 2 Procedures - Numbered step by step - Sentences begin with verbs - Quantities to measure are listed in metric units 0 = No overall procedural plan to confirm hypothesis 1 = Partial procedural plan to confirm hypothesis 2 = Sufficient procedural plan to confirm hypothesis 3 = Well-written plan, numbered step by step, sentences beginning with verbs 4 = Well-written as above and detailed including repeatability and specified measurements of materials used in experiment 0 1 2 3 4 How well are all variables recognized? -Test (independent/manipulated) -Outcome (dependent/responding) -Control (if applicable) -Constants/Controlled Variables 0 = No variables or constants are recognized 1 = Some variables or some constants are recognized 2 = All variables are recognized, but not all constants and controls (if applicable) 3 = All variables & constants and controls (if applicable) are recognized; IV or DV incorrect 4 = All variables & constants and controls (if applicable) are clearly and appropriately recognized in project log notebook 0 1 2 3 4 Materials and Equipment Were the items: - listed in column form - equipment specifically named - metric units are used 0 = No materials identified or used 1 = Materials not specifically identified and/or used properly 2 = Materials specifically identified but used improperly 3 = Materials specifically identified in column form and used properly 4 = Materials specifically identified in column form & metric units used properly 0 1 2 3 4 Results To what degree have the results been interpreted? 0 = No written narrative interpretation of data 1 = Partial written narrative interpretation of data 2 = Correct written narrative interpretation of data 3 = Comprehensive narrative interpretation of data including averaging 4 = Comprehensive and clear interpretation of data above expectations 0 1 2 3 4 Conclusion To what degree are the conclusions recognized and interpreted? Including: - the purpose of the experiment - hypothesis supported/not supported - the major findings 0 = No conclusion of data. 1 = Incomplete conclusion of data. Did not reference hypothesis 2 = Correct/complete conclusion/interpretation of data with reference to hypothesis 3 = Well-written conclusion/interpretation of data with reference to hypothesis 4 = Well-written conclusion/interpretation of data with reference to hypothesis with major findings and possible explanations for them; states if data supports or does not support hypothesis 0 1 2 3 4 Application To what degree are the applications recognized and interpreted? - Use of the findings 0 = No application included in project log notebook 1 = Application included in project log notebook 2 = Well written application with new questions recognized included in project log notebook 0 1 2 Display Attributes(see display board for attributes requirements) - free standing - correct grammar/ spelling - clear and legible - attractive visual display 0 = Unsatisfactory quality of display - more than three attributes are missing 1 = Poor quality of display - only two or three attributes are missing 2 = Average quality- only one attribute missing with minor errors and of fair quality 3 = Good quality – all attributes present and with few if any minor errors 4= Superior display – all attributes present and of exemplary quality 0 1 2 3 4 Creativeness and Level of Difficulty 0 = Project does not provide new insights and is not creative 1 = Project does not provide any new insights and is a low level project 2= Project is creative and is above a low level project 3= Project is creative and is above a moderate project 4= Project and idea is very creative, provides new insights and the information generated is new; a high level project 0 1 2 3 4 Trials and/or Data over time * To receive credit for each trial data MUST be included, easily read, and well documented 0 = Less than 3 trials and/or less than three weeks of data collection 1 = Less than 4 trials and/or less than 4 weeks of data collection 2 = Less than 5 trials and/or less than 5 weeks of data collection 3 = At least 5 trials included but data is not clearly communicated and recorded 4 = More than 5 trials and/or over 5 weeks of data collected. Evidence is clearly communicated and recorded to make results more valid. 0 1 2 3 4 Abstract & Bibliography To what degree does the abstract and bibliography describe the project and support the research? 0 = No Abstract/No documentation of research 1 = Poorly written and one paragraph ONLY 2 = Poorly written and two paragraphs 3 = Well-written but does not describe all components of the required abstract 4 = Well-written and completely describes the project using the abstract guidelines 0 1 2 3 4 Oral Presentation -How clear, well prepared and organized is the presentation? -How complete is the student’s understanding of the experimental work completed for their project? 0 = Poor presentation; cannot answer questions 1 = Poor presentation; partially answers questions 2 = Fair presentation; adequately answers most questions 3 = Good presentation; precisely answers most questions 4 = Exemplary presentation and knowledge; precisely answers all questions 0 1 2 3 4 Project Log Notebook 0= No project log notebook included 1= Only information on backboard included in notebook 2= All information including variables and application included in log notebook 0 1 2 Total Points Received __________ Total Points Possible 48   
  • 5.
    Science Project Guidelines Step1 Problem Statement (Topic) Due Friday, October 16th Step 2 Background Information/Research Due Friday, October 23rd Once you have chosen your topic, it is important to research the materials on your subject. By finding out information about the subject, you will gain a better understanding of your problem. Look for information that will help you understand your topic better and will help you design your experiment, as well as help form a more educated hypothesis. *Follow these guidelines for conducting your research: 1. Read books and articles on your subject. Make sure this information is up to date (not older than 5-10 years). 2. Interview and talk with people who are knowledgeable about your subject. 3. Submit to Ms. Snyder, at least 2 paragraphs of what you learned about your topic. ****RESEARCH is not included on your Display Board****** Step 3 Identify Variables Due Thu., Oct 29th (turn in on form which also includes your Problem Statement and Hypothesis) Scientists use an experiment to search for cause and effect relationships in nature. In other words, they design an experiment so that changes to one item cause something else to vary in a predictable way. An experiment has 3 variables: • independent – What is being changed? • dependent – What is responding to the change? This is what you MEASURE • controlled variables: What stays the same? List EVERYTHING Step 4 Hypothesis and Materials Due Thursday, Oct 29th 1. A hypothesis states what you think is going to happen when you investigate a question. 2. A good hypothesis is able to be tested. The hypothesis should NOT start with the words, “I think” or “I hope” because it should be stated as a FACT. It should be an If…, then… statement. Materials Due Thursday, Oct 29th
  • 6.
    List all thematerials used in your experiment. Include specific details such as size and quantity. Remember scientists ONLY USE METRIC units. Good Example: Poor Example: 1. 3 – 15x15 cm. sheets of each paper 1. Paper Towels Towel: Brawny, Viva, and Bounty. 2. Measuring Cup 2. 1 20x20 cm. square cake pan 3. Water 3. 750 ml water, 20° Celsius 4. Container 4. Celsius thermometer 5. Thermometer 5. Clock with a second hand 6. Clock Step 5: Procedures complete week of November 2nd –Nov. 13th (DO NOT HAVE TO TURN IN) List your step-by-step directions like a recipe. Anyone who reads them should be able to duplicate your experiment. You CANNOT do an experiment only once and must perform a sufficient number of TRIALS or tests. You must complete at least 5 trials for full credit. Include the trials you are planning in your procedures. Do not write what YOU did (avoid words such as “I” and “me”) Example: 1. Cut 3 – 15x15 cm. Sq. from each brand of paper towels. 2. Label each cut piece with brand name. 3. Pour 50 ml. of 20° Celsius water into 20x20 cm. sq. pan 4. Place 1 square of generic brand paper towel into the water and pan 5. Leave for 30 seconds 6. Remove paper towel 7. Measure water remaining in pan and record 8. Dry the cake pan 9. Repeat steps 4 through 8 for each brand of paper towel 10. Repeat entire process four more times for each brand of paper towel Step 6 Data Collection Complete week of November 16th –Nov. 27th Data refers to information gathered during your experiment. Writing in a spiral notebook is the most convenient way to keep a log. *Your log should include: 1. A list of all materials you use. 2. Notes on the preparations you made prior to starting your experiment. 3. Information about the resources you use (books, people, library, museum, universities, etc.) 4. Detailed day-by-day notes on the progress of your project. a. What you are actually doing b. Problems you have with your experiment c. Things you would change if you were doing this experiment again. 5. Any drawings that you feel might help explain your work. 6. Data that you gather from your experiment (notes, table, charts, graphs).
  • 7.
    7. Be surethat you date each entry in your log. *The data collected during the course of your experiment needs to be quantitative (measurable). *All measurements in your experiment must be made in metric units. Volume: milliliter (ml) 1000 mL = 1L Liter (L) Length: millimeter (mm) 10mm=1cm Centimeter (cm), Meter (m) 1000m =1km Kilometer (km) Mass: milligram (mg) 10mg=1cg Centigram (cg) 100cg=1g Gram (g) 1000g=1kg Kilogram (kg) Step 7 Results and Conclusion Due with FINAL Project on Thursday, December 3rd Examples: See How to Write a GREAT Conclusion handout in interactive journal on page 37. Before you write your conclusion, carefully examine all your data (graphs, charts, tables). As yourself these questions: 1. Did you get the results you expected to get? If not-how were the results different? 2. Were there any unexpected problems or occurrences that may have affected the results of your experiment? 3. Do you think you collected sufficient data? (Were there enough trials? Samples?) Your conclusion should include: 1. Restatement of your original hypothesis 2. Statement of support or non-support of the original hypothesis (see journal page 33) 3. Description of any problems or unusual events that occurred during your experiment. 4. What you would do differently next time. Step 8 Title and Abstract Due with FINAL Project on Thursday, December 3rd Choose a title for your project that tells what your project is about. It could be “catchy” and get a viewer’s attention. Example: “A Mixing Mystery” “Density Dilemma” “Let’s Play Ball!” *THE TITLE CAN BE THE SAME AS THE PROBLEM STATEMENT or You can write a catchy title. HOW TO WRITE AN ABSTRACT: The abstract is a summary of the entire project. It is written in three paragraphs. Paragraph #1 Purpose of the experiment and the Hypothesis Paragraph #2 Procedures Paragraph #3 Results and the Conclusion Sample Abstract: The purpose of this project is to determine under which colored lights a bean plant grows the tallest. It is hypothesized that the bean plant will grow the tallest under blue light. Three different colored lights were used in this experiment, white, blue and green. Fifteen bean plants were bought at Home Depot. All plants were measured initially and were all 15cm tall. The plants were labeled A, B and C then the trial number (A1, A2, A3, A4, A5, B1, B2, B3, B4, B5, C1, C2, C3, C4, C5). Five plants were then placed under each of the three colored lights. Every day for 5 weeks at 3:30pm I would examine each bean plant, measure and record the growth. The results showed that the bean plants under the green light grew the tallest. The hypothesis was not supported. To improve this study, I would collect data at different times of the day. I would also use bean seeds next time to make sure each plant is starting at the same initial size.
  • 8.
    Step 9 ApplicationDUE WITH FINAL PROJECT on Thursday, December 3rd • An application is how the project relates to real life. o How can you use the findings from this experiment in your day-to-day life? o What new question(s) has your experiment lead you to ask that could be tested in a new experiment? Example of an Application: Having tested three brands of paper towels, Brawny, Viva, and Bounty for the best absorbency, it is now known from this experiment that the from these three branded paper towels Bounty paper towel has the most absorbency. With this information consumers may now be able to make a more scientific decision when choosing the brand of paper towel. If the consumer wishes to purchase a paper towel product with more absorbency then Bounty is the paper towel to purchase. However, not always does a consumer want the most absorbent paper towel and therefore knowing this information the consumer will not purchase the Bounty paper towel but rather another brand, perhaps Viva which absorbed the least from the three tested Helpful Websites http://science.dadeschools.net/scifair http://scienceprojects.com http://rossarts.org/naples/ideas.htm http://terimore.com http://www.all-science-fair-projects.com http://www.factmonster.com http://www.sciencebuddies.org REVISED FROM: http://drek8.dadeschools.net/Newsite/Docs/11-12_Docs/Science%20Fair%20Packet%202011-12.pdf Project Notebook to include: *Data collected during each trial to include quantitative and qualitative data (see JP 15) *All backboard data *Variables * Application
  • 10.
    Title of theProject Problem Statement Hypothesis Abstract Charts, graphs, surveys, sketches, or photographs Materials Conclusion Procedures Data Log Book Includes: *Observations and Data collected Variables