
Download to read offline


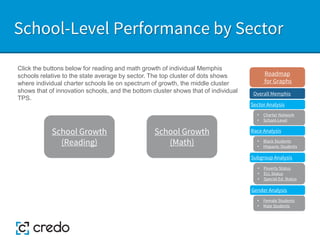
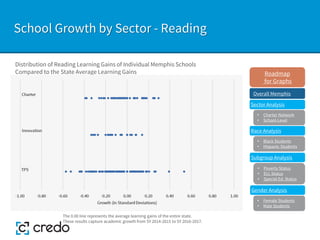
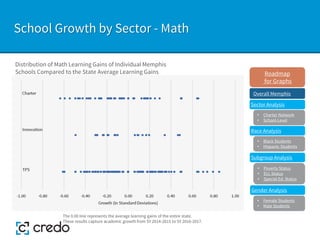
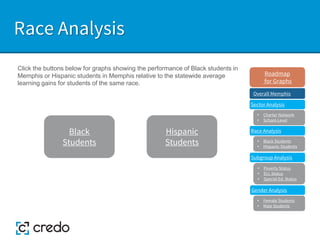
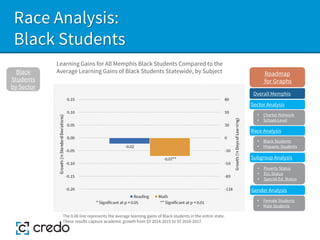
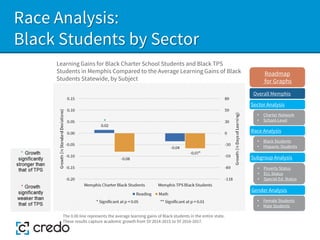
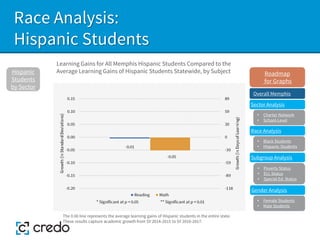
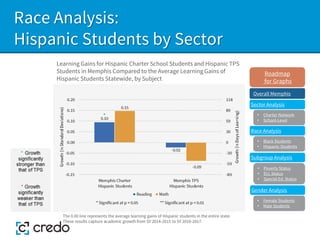
The document presents a study on student academic growth in Memphis, benchmarking against state averages and examining performance by various sectors and demographics. Key findings include comparisons of learning gains for charter, independent, and innovation zone schools, with analyses based on race, poverty status, and gender. The report details methodologies for measurement (2013-2017), acknowledges contributions from local education authorities, and provides graphical data representations of school performance.


