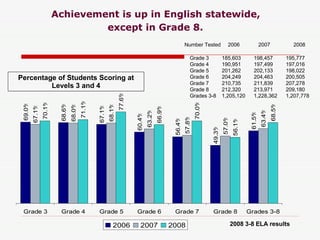
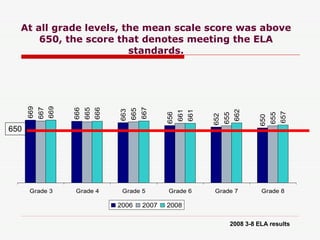
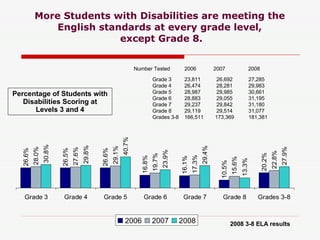
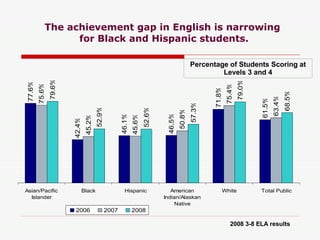
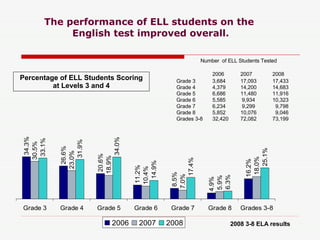
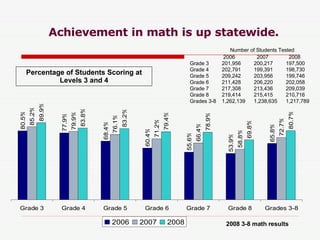
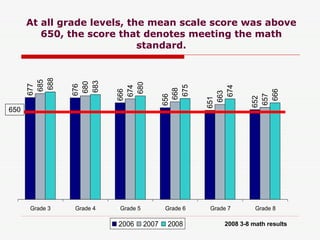
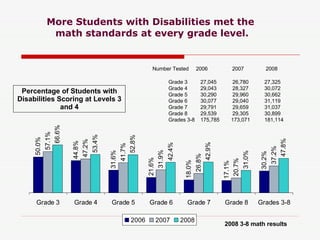
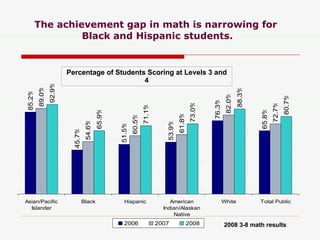
The document summarizes New York State's annual assessment and accountability discussion. It provides data on student performance on English and math assessments from 2006 to 2008. Achievement increased in most grades and subgroups in both subjects. The performance of English language learners and students with disabilities also improved overall. The state is proposing a growth model for accountability that measures student progress toward proficiency from year to year.

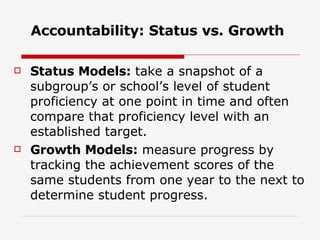
![More Information To submit questions or requests for more information, please e-mail: [email_address]](https://image.slidesharecdn.com/datag-annual-testingaccountabilty-discussion-10081-1223053048169236-9/85/Datag-Annual-Testing-Accountabilty-Discussion-10-081-62-320.jpg)


![Spring 2011 state assessment results_12.13.11[1]](https://cdn.slidesharecdn.com/ss_thumbnails/spring2011stateassessmentresults12-13-111-120116110011-phpapp01-thumbnail.jpg?width=640&height=640&fit=bounds)


