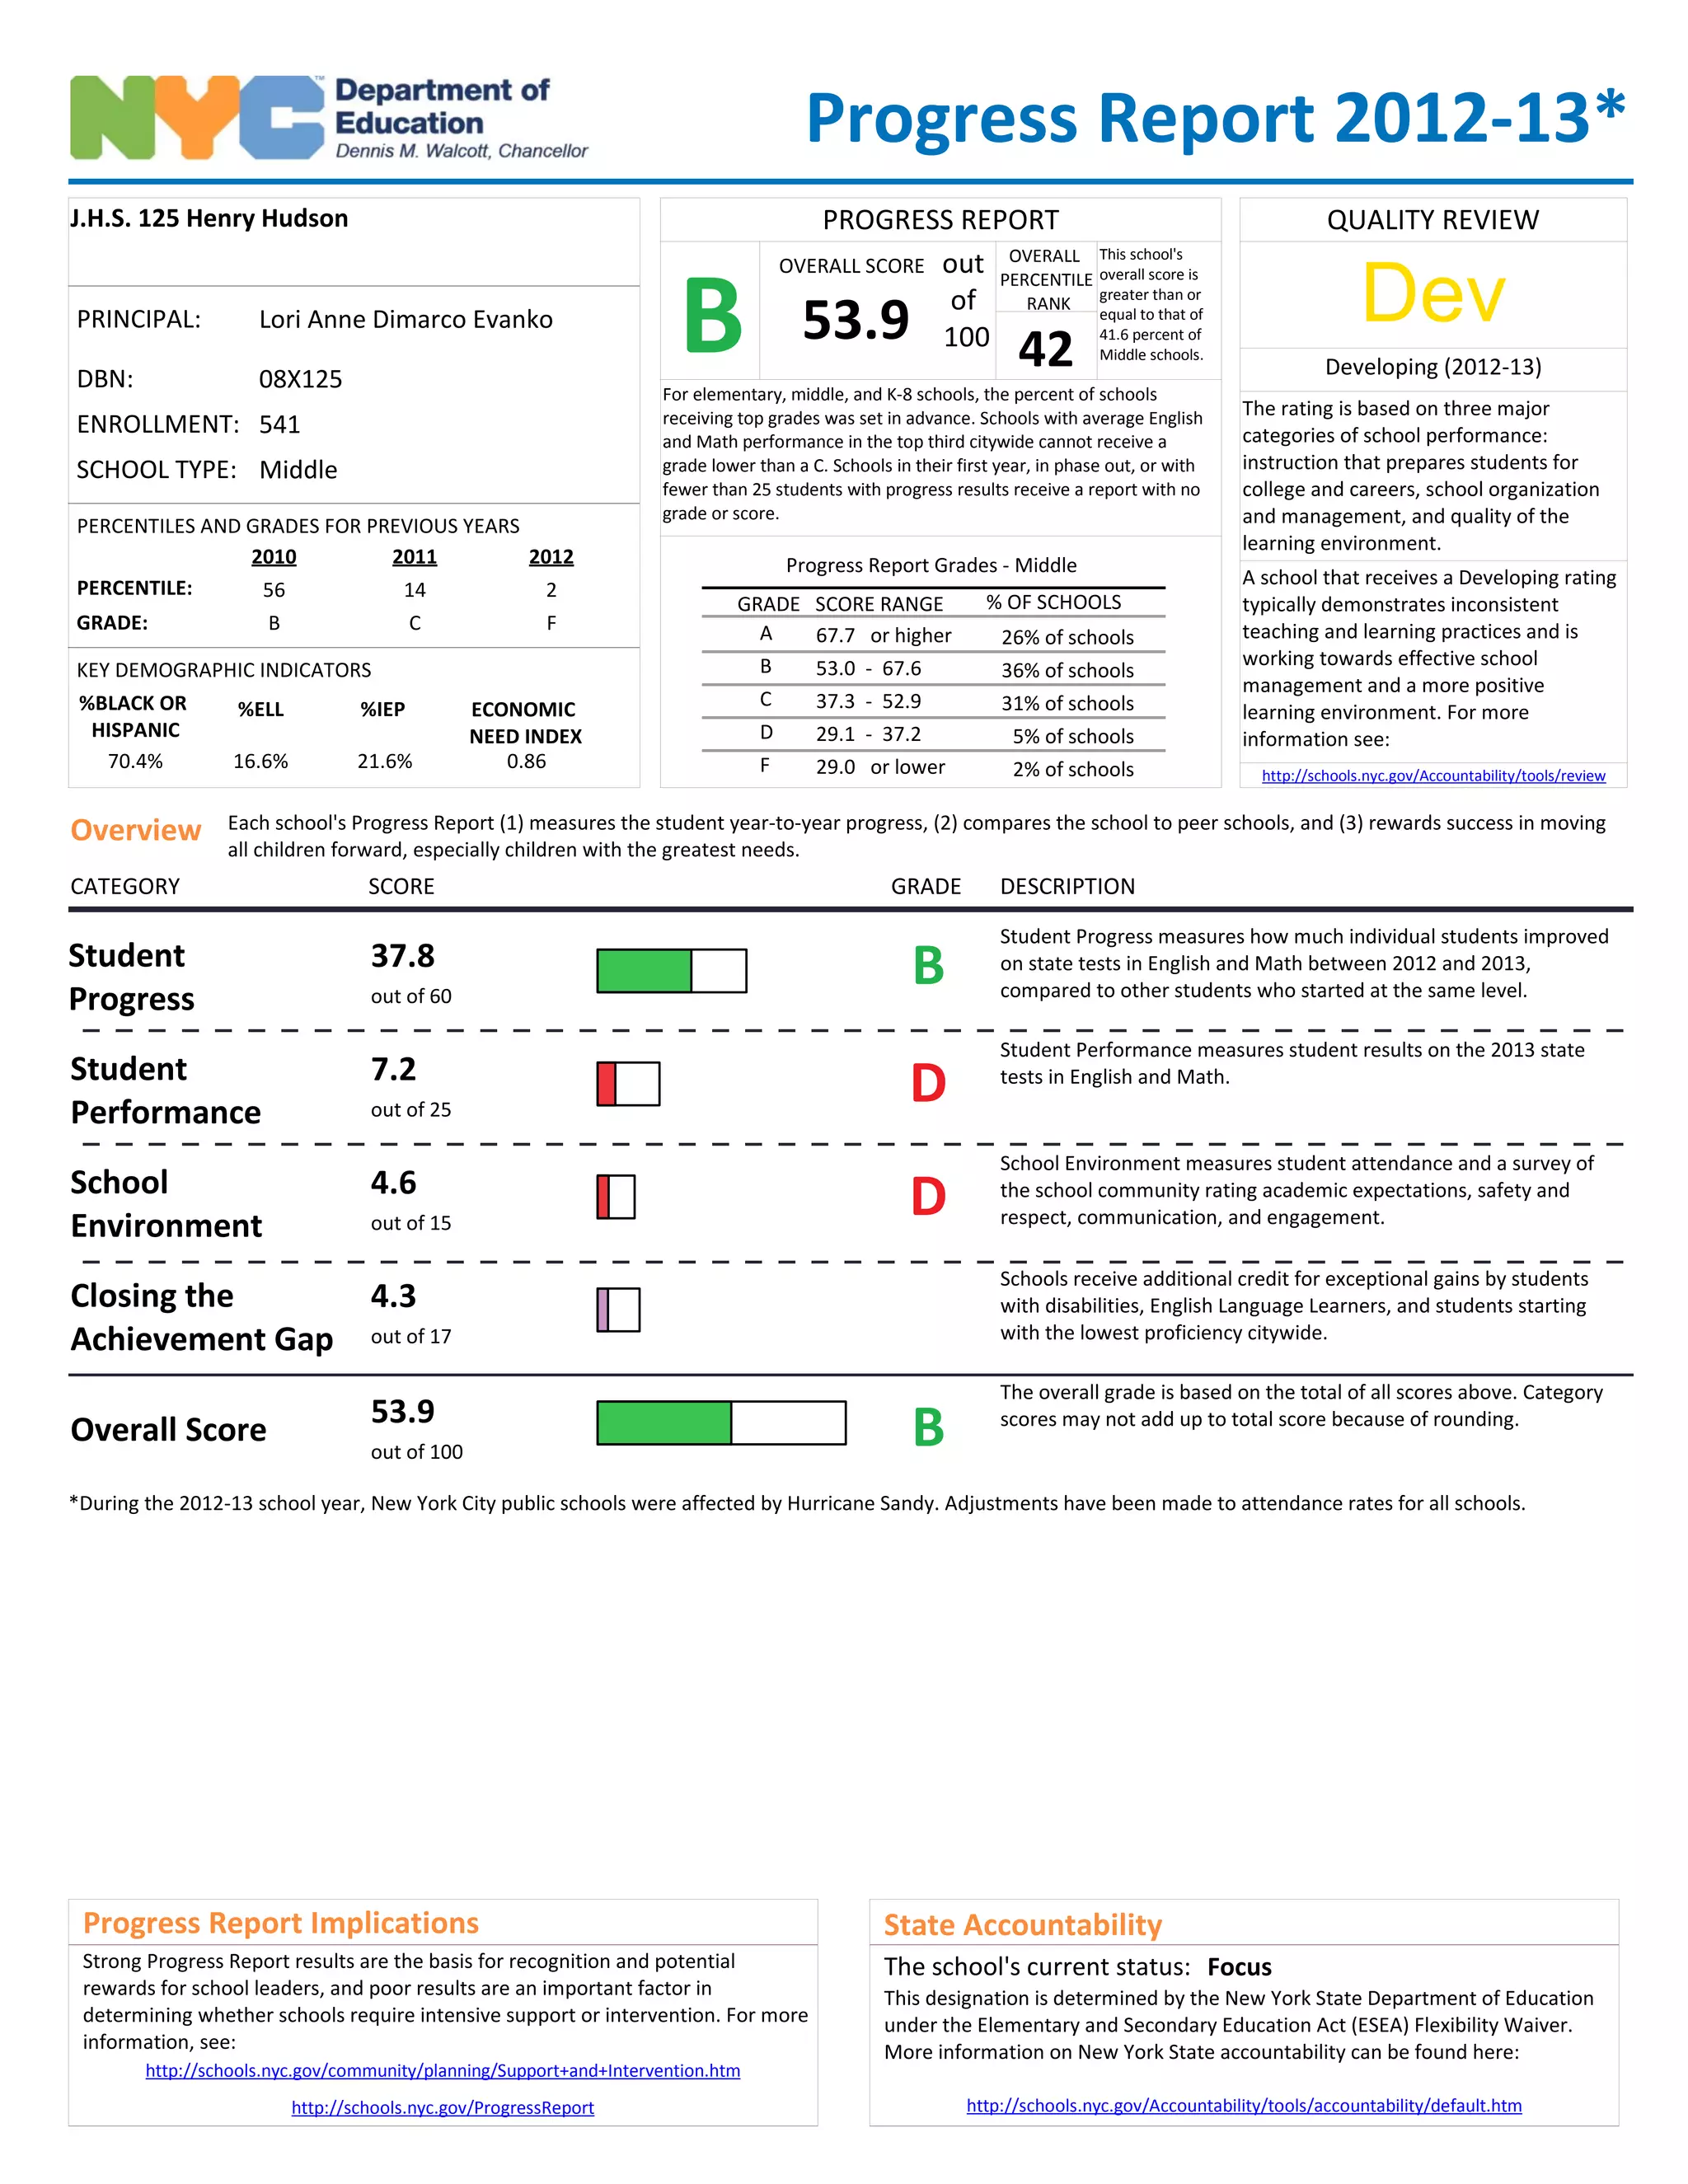
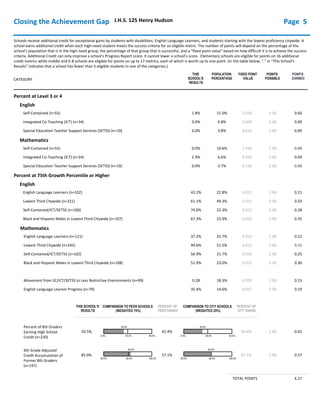
08X125
Student
Progress
37.8
out of 60
Progress Report 2012-13*
J.H.S. 125 Henry Hudson
PRINCIPAL: Lori Anne Dimarco Evanko
DBN: 08X125
ENROLLMENT: 541
SCHOOL TYPE: Middle
Overview Each school's Progress Report (1) measures the student year-to-year progress, (2) compares the school to peer schools, and (3) rewards success in moving
all children forward, especially children with the greatest needs.
CATEGORY SCORE DESCRIPTIONGRADE
Student
Performance
7.2
out of 25
School
Environment
4.6
out of 15
Closing the
Achievement Gap
4.3
out of 17
Overall Score
53.9
out of 100
Student Progress measures how much individual students improved
on state tests in English and Math between 2012 and 2013,
compared to other students who started at the same level.
Student Performance measures student results on the 2013 state
tests in English and Math.
School Environment measures student attendance and a survey of
the school community rating academic expectations, safety and
respect, communication, and engagement.
Schools receive additional credit for exceptional gains by students
with disabilities, English Language Learners, and students starting
with the lowest proficiency citywide.
The overall grade is based on the total of all scores above. Category
scores may not add up to total score because of rounding.
B
D
D
B
PROGRESS REPORT
B
OVERALL SCORE
53.9
out
of
100
OVERALL
PERCENTILE
RANK
42
This school's
overall score is
greater than or
equal to that of
41.6 percent of
Middle schools.
For elementary, middle, and K-8 schools, the percent of schools
receiving top grades was set in advance. Schools with average English
and Math performance in the top third citywide cannot receive a
grade lower than a C. Schools in their first year, in phase out, or with
fewer than 25 students with progress results receive a report with no
grade or score.
Progress Report Grades - Middle
GRADE SCORE RANGE
26% of schools
36% of schools
31% of schools
5% of schools
2% of schools
A
B
C
D
F
67.7 or higher
53.0 - 67.6
37.3 - 52.9
29.1 - 37.2
29.0 or lower
Progress Report Implications
Strong Progress Report results are the basis for recognition and potential
rewards for school leaders, and poor results are an important factor in
determining whether schools require intensive support or intervention. For more
information, see:
http://schools.nyc.gov/community/planning/Support+and+Intervention.htm
State Accountability
The school's current status: Focus
This designation is determined by the New York State Department of Education
under the Elementary and Secondary Education Act (ESEA) Flexibility Waiver.
More information on New York State accountability can be found here:
http://schools.nyc.gov/Accountability/tools/accountability/default.htmhttp://schools.nyc.gov/ProgressReport
QUALITY REVIEW
Dev
Developing (2012-13)
The rating is based on three major
categories of school performance:
instruction that prepares students for
college and careers, school organization
and management, and quality of the
learning environment.
A school that receives a Developing rating
typically demonstrates inconsistent
teaching and learning practices and is
working towards effective school
management and a more positive
learning environment. For more
information see:
http://schools.nyc.gov/Accountability/tools/review
% OF SCHOOLS
2010 2011 2012
56 14 2
B C FGRADE:
%IEP%BLACK OR
HISPANIC
%ELL
0.8621.6%70.4% 16.6%
KEY DEMOGRAPHIC INDICATORS
*During the 2012-13 school year, New York City public schools were affected by Hurricane Sandy. Adjustments have been made to attendance rates for all schools.
ECONOMIC
NEED INDEX
PERCENTILES AND GRADES FOR PREVIOUS YEARS
PERCENTILE:
45.9 79.762.8
70.0
49.8 79.464.6
70.0
68.3 91.780.0
87.0
66.3 92.979.6
87.0
39.4 81.860.6
61.0
42.4 81.461.9
61.0
57.9 91.974.9
75.5
58.5 90.774.6
75.5
J.H.S. 125 Henry Hudson
B
37.8
(out of 60)
THIS SCHOOL'S
RESULTS
PERCENT OF
PEER RANGE
COMPARISON TO PEER SCHOOLS
(WEIGHTED 75%)
English
70.0 71.3%Median Adjusted Growth Percentile
(n=448)
87.0 79.9%Median Adjusted Growth Percentile for
School's Lowest Third (n=154)
61.0 50.9%Median Adjusted Growth Percentile
(n=470)
How To Interpret These Charts
To determine the number of points earned, this school's 2012-13 results on each metric are compared to the results of peer schools and all schools serving
the same grade levels citywide. The comparison to peer schools is worth 75% of the points for each metric and the comparison to all schools citywide is worth
25% of the points. The bars represent the range of results for the peer and city comparison schools that are within two standard deviations of the average.
The percent of the range that is shaded is the school's share of possible points. The share is multiplied by the weight (75% or 25%) and the possible points for
the metric to determine the points earned.
This
school's
result
0% of range Average value among
comparison schools
100% of range
PERCENT OF
RANGE
Share of
comparison
range
covered by
the school's
result
60%
COMPARISON TO PEER SCHOOLS
(WEIGHTED)
Score Calculation Example
FORMULA
EXAMPLE
(
(
PERCENT
OF PEER
RANGE
60%
X
X
0.75
0.75
8 0
5 0 7 5 1 0 0
+
+
PERCENT
OF CITY
RANGE
80%
X
X
0.25
0.25
) X
) X
POINTS
POSSIBLE
3.75
=
=
POINTS
EARNED
2.44
GRADE SCORE RANGE
or higher
- 38.7
- 28.3
- 16.4
or lower
A
B
C
D
F
38.8
28.4
16.5
9.8
9.7
PERCENT OF
CITY RANGE
COMPARISON TO CITY SCHOOLS
(WEIGHTED 25%)
POINTS
POSSIBLE
POINTS
EARNED
68.2%
77.8%
47.7%
15.00
15.00
15.00
10.58
11.91
7.52
TOTAL POINTS 60.00 37.82
Student Progress represents 60% of the total score. The grade is based on growth
percentiles, a measure of how much individual students improved on state tests in English
and Math between 2012 and 2013.
Mathematics
75.5 51.8%Median Adjusted Growth Percentile for
School's Lowest Third (n=162)
52.8% 15.00 7.81
School Progress Page 2
GRADE
SCORE
5.2% 23.0%14.1%
10.6%
0.0% 40.6%20.3%
10.6%
2.13 2.512.32
2.23
1.69 3.172.43
2.23
0.0% 28.8%14.4%
8.9%
0.0% 43.2%21.6%
8.9%
1.94 2.682.31
2.12
1.61 3.272.44
2.12
75.8% 100.0%89.9%
89.0%
69.5% 100.0%89.4%
89.0%
76.6% 100.0%88.5%
73.2%
68.9% 100.0%88.5%
73.2%
77.9% 100.0%89.8%
86.5%
70.0% 100.0%89.7%
86.5%
74.8% 100.0%88.6%
79.6%
67.7% 100.0%89.0%
79.6%
J.H.S. 125 Henry Hudson
D
7.2
(out of 25)
THIS SCHOOL'S
RESULTS
PERCENT OF
PEER RANGE
COMPARISON TO PEER SCHOOLS
(WEIGHTED 75%)
English
Percentage of Students at Level 3 or 4
(n=502)
Average Student Proficiency (n=502)
Mathematics
Average Student Proficiency (n=518)
How To Interpret These Charts
To determine the number of points earned, this school's 2012-13 results on each metric are compared to the results of peer schools and all schools serving
the same grade levels citywide. The comparison to peer schools is worth 75% of the points for each metric and the comparison to all schools citywide is worth
25% of the points. The bars represent the range of results for the peer and city comparison schools that are within two standard deviations of the average.
The percent of the range that is shaded is the school's share of possible points. The share is multiplied by the weight (75% or 25%) and the possible points for
the metric to determine the points earned.
This
school's
result
0% of range Average value among
comparison schools
100% of range
PERCENT OF
RANGE
Share of
comparison
range
covered by
the school's
result
60%
COMPARISON TO PEER SCHOOLS
(WEIGHTED)
Score Calculation Example
FORMULA
EXAMPLE
(
(
PERCENT
OF PEER
RANGE
60%
X
X
0.75
0.75
8 0
5 0 7 5 1 0 0
+
+
PERCENT
OF CITY
RANGE
80%
X
X
0.25
0.25
) X
) X
POINTS
POSSIBLE
3.75
=
=
POINTS
EARNED
2.44
GRADE SCORE RANGE
or higher
- 16.3
- 11.4
- 7.5
or lower
A
B
C
D
F
16.4
11.5
7.6
6.1
6.0
PERCENT OF
CITY RANGE
COMPARISON TO CITY SCHOOLS
(WEIGHTED 25%)
POINTS
POSSIBLE
POINTS
EARNED
TOTAL POINTS 25.00 7.20
Student Performance represents 25% of the total score. The Student Performance grade is
based on results on the 2013 state tests in English and Math and core course pass rates.
State test metrics evaluate the percent of students who reach or exceed proficiency (Level 3
and 4) and students' average proficiency rating. Core course pass rates look at the percent of
students in 6th through 8th grade who passed a course in a core subject area.
Percentage of Students at Level 3 or 4
(n=518)
Percent of Students Passing a Core Course
English (n=511)
Math (n=511)
Science (n=511)
Social Studies (n=511)
School Performance Page 3
GRADE
SCORE
30.3%
26.3%
24.3%
30.9%
54.5%
0.0%
38.9%
19.0%
10.6%
2.23
2.12
8.9%
89.0%
73.2%
86.5%
79.6%
26.1%
36.5%
30.7%
20.6%
63.9%
13.8%
55.0%
36.8%
5.00
5.00
5.00
5.00
1.25
1.25
1.25
1.25
1.46
1.44
1.30
1.42
0.04
0.71
0.54
0.29
7.1 8.98.0
7.7
7.1 8.98.0
7.7
5.9 8.37.1
7.4
5.9 8.57.2
7.4
6.3 8.37.3
7.1
6.2 8.67.4
7.1
5.6 8.47.0
6.8
5.6 8.87.2
6.8
89.0% 95.4%92.2%
88.6%
86.8% 98.4%92.6%
88.6%
J.H.S. 125 Henry Hudson
D
4.6
(out of 15)
How To Interpret These Charts
To determine the number of points earned, this school's 2012-13 results on each metric are compared to the results of peer schools and all schools serving
the same grade levels citywide. The comparison to peer schools is worth 75% of the points for each metric and the comparison to all schools citywide is worth
25% of the points. The bars represent the range of results for the peer and city comparison schools that are within two standard deviations of the average.
The percent of the range that is shaded is the school's share of possible points. The share is multiplied by the weight (75% or 25%) and the possible points for
the metric to determine the points earned.
This
school's
result
0% of range Average value among
comparison schools
100% of range
PERCENT OF
RANGE
Share of
comparison
range
covered by
the school's
result
60%
COMPARISON TO PEER SCHOOLS
(WEIGHTED)
Score Calculation Example
FORMULA
EXAMPLE
(
(
PERCENT
OF PEER
RANGE
60%
X
X
0.75
0.75
8 0
5 0 7 5 1 0 0
+
+
PERCENT
OF CITY
RANGE
80%
X
X
0.25
0.25
) X
) X
POINTS
POSSIBLE
3.75
=
=
POINTS
EARNED
2.44
GRADE SCORE RANGE
or higher
- 11.3
- 8.6
- 5.9
or lower
A
B
C
D
F
11.4
8.7
6.0
4.4
4.3
TOTAL POINTS 15.00 4.57
School Environment represents 15% of the total score. The School Environment grade is
based on student attendance and your school's NYC School Survey, where parents, teachers,
and students in grade 6 and above rate academic expectations, safety and respect,
communication, and engagement.
School Environment Page 4
GRADE
SCORE
THIS SCHOOL'S
RESULTS
PERCENT OF
PEER RANGE
COMPARISON TO PEER SCHOOLS
(WEIGHTED 75%)
School Survey Results
7.7 33.3%Academic Expectations
7.4 62.5%Communication
7.1 40.0%Engagement
PERCENT OF
CITY RANGE
COMPARISON TO CITY SCHOOLS
(WEIGHTED 25%)
POINTS
POSSIBLE
POINTS
EARNED
33.3%
57.7%
37.5%
2.50
2.50
2.50
0.83
1.53
0.98
6.8 42.9%Safety and Respect 37.5% 2.50 1.04
88.6% 0.0%Attendance Rate 15.5% 5.00 0.19
0.0% 48.4%24.2%
20.5%
0.0% 52.0%26.0%
20.5%
65.0% 100.0%83.0%
85.0%
65.0% 100.0%85.0%
85.0%
J.H.S. 125 Henry Hudson
THIS
SCHOOL'S
RESULTS
FIXED POINT
VALUE
POINTS
POSSIBLE
POINTS
EARNED
Schools receive additional credit for exceptional gains by students with disabilities, English Language Learners, and students starting with the lowest proficiency citywide. A
school earns additional credit when each high-need student meets the success criteria for an eligible metric. The number of points will depend on the percentage of the
school's population that is in the high-need group, the percentage of that group that is successful, and a "fixed point value" based on how difficult it is to achieve the success
criteria. Additional Credit can only improve a school's Progress Report score. It cannot lower a school's score. Elementary schools are eligible for points on 16 additional
credit metrics while middle and K-8 schools are eligible for points on up to 17 metrics, each of which is worth up to one point. (In the table below, "." in "This School's
Results" indicates that a school has fewer than 5 eligible students in one of the categories.)
Closing the Achievement Gap
CATEGORY
POPULATION
PERCENTAGE
Percent at Level 3 or 4
English
1.8%Self-Contained (n=55)
0.0%Integrated Co-Teaching (ICT) (n=34)
Mathematics
0.0%Special Education Teacher Support Services (SETSS) (n=19)
0.0%Self-Contained (n=55)
2.9%Integrated Co-Teaching (ICT) (n=34)
0.0%Special Education Teacher Support Services (SETSS) (n=19)
Percent at 75th Growth Percentile or Higher
42.2%English Language Learners (n=102)
English
74.0%Self-Contained/ICT/SETSS (n=100)
61.1%Lowest Third Citywide (n=221)
67.3%Black and Hispanic Males in Lowest Third Citywide (n=107)
4.27TOTAL POINTS
Mathematics
English Language Learners (n=121)
Lowest Third Citywide (n=242)
Self-Contained/ICT/SETSS (n=102)
Black and Hispanic Males in Lowest Third Citywide (n=108)
English Language Learner Progress (n=79)
Movement from SC/ICT/SETSS to Less Restrictive Environments (n=99)
Percent of 8th Graders
Earning High School
Credit (n=220)
37.2%
49.6%
56.9%
51.9%
0.28
35.4%
20.5%
1.00
1.00
1.00
1.00
1.00
1.00
1.00
1.00
1.00
1.00
1.00
1.00
1.00
1.00
1.00
1.00
1.00
0.60
0.00
0.00
0.00
0.00
0.09
0.21
0.28
0.33
0.35
0.31
0.22
0.25
0.30
0.19
0.15
0.42
11.0%
6.8%
3.8%
10.6%
6.6%
3.7%
22.8%
22.3%
49.3%
23.9%
25.7%
51.5%
21.7%
23.0%
18.3%
14.6%
3.036
0.609
0.619
1.946
0.494
0.536
0.022
0.017
0.011
0.022
0.023
0.012
0.020
0.025
0.029
0.037
Page 5
THIS SCHOOL'S
RESULTS
PERCENT OF
PEER RANGE
COMPARISON TO PEER SCHOOLS
(WEIGHTED 75%)
PERCENT OF
CITY RANGE
COMPARISON TO CITY SCHOOLS
(WEIGHTED 25%)
42.4%
9th Grade Adjusted
Credit Accumulation of
Former 8th Graders
(n=197)
85.0% 1.0057.1% 57.1% 0.57
39.4%
Peer Group Schools J.H.S. 125 Henry Hudson
PEER GROUP CALCULATION
PEER GROUP FOR: J.H.S. 125 Henry Hudson
Each school's performance is compared to the performance of schools in its peer group. Peer schools are those New York City public schools with a student population most
like this school's population. Each elementary and middle school has up to 40 peer schools and each K-8 school has up to 30 peer schools.
Page 6
Peer groupings are created using a “nearest neighbor” matching methodology. This methodology examines the mathematical difference between a school and all potential
peers on a given set of characteristics. Schools with the smallest difference across all the characteristics are peered together.
DBN SCHOOL AVERAGE MATH
PROFICIENCY
%STUDENTS WITH
DISABILITIES
%OVERAGE
AVERAGE ENGLISH
PROFICIENCY
2.76 3.3%21.6%3.19J.H.S. 125 Henry Hudson08X125
2.74 2.2%25.3%3.08M.S. 250 West Side Collaborative Middle School03M250
2.79 3.2%22.0%3.22Isaac Newton Middle School for Math & Science04M825
2.72 4.5%21.4%3.10J.H.S. 131 Albert Einstein08X131
2.69 3.6%21.1%3.04Bronx Studio School for Writers and Artists08X269
2.82 3.1%23.9%3.32Archimedes Academy for Math, Science and Technology Applications08X367
2.72 4.0%25.8%3.11Mott Hall Community School08X467
2.72 3.7%19.0%3.13Comprehensive Model School Project M.S. 32709X327
2.78 3.9%19.9%3.09Science and Technology Academy: A Mott Hall School09X454
2.70 3.5%24.0%3.12West Bronx Academy for The Future10X243
2.72 4.4%19.6%3.07In-Tech Academy (M.S. / High School 368)10X368
2.64 3.9%20.6%3.03M.S. 39010X390
2.72 2.4%24.0%3.13Bronx Green Middle School11X326
2.80 2.8%20.5%3.23Pelham Academy of Academics and Community Engagement11X468
2.70 4.5%20.5%3.13Bronx Park Middle School11X556
2.70 3.3%22.7%3.18Mott Hall V12X242
2.77 3.1%20.9%3.08Kappa III12X316
2.87 2.8%18.3%3.21M.S. 113 Ronald Edmonds Learning Center13K113
2.78 3.2%24.4%3.08M.S. K266 - Park Place Community Middle School13K266
2.76 1.9%21.8%3.04Fort Greene Preparatory Academy13K691
2.75 4.5%20.2%3.17Frederick Douglass Academy IV Secondary School16K393
2.77 2.6%18.1%3.09I.S. 211 John Wilson18K211
2.76 2.7%22.9%3.07The Science and Medicine Middle School18K366
2.73 2.0%21.6%3.15Urban Assembly School for Criminal Justice20K609
2.76 3.4%19.0%3.25I.S. 096 Seth Low21K096
2.80 2.0%19.2%3.14J.H.S. 078 Roy H. Mann22K078
2.79 1.9%18.8%3.11I.S. 07724Q077
2.76 3.8%24.1%3.19I.S. 250 The Robert F. Kennedy Community Middle School25Q250
2.81 4.6%17.9%3.24J.H.S. 226 Virgil I. Grissom27Q226
2.73 4.5%21.7%3.11Academy of Medical Technology: a College Board School27Q309
2.76 4.8%20.0%3.08Catherine & Count Basie Middle School 7228Q072
2.78 4.0%17.2%3.19I.S. 204 Oliver W. Holmes30Q204
2.80 4.3%26.5%3.19I.S. 051 Edwin Markham31R051
2.73 2.3%23.0%3.06I.S. 061 William a Morris31R061
2.77 2.7%24.3%3.08Launch Expeditionary Learning Charter School84K360
2.83 2.0%25.1%3.22Coney Island Preparatory Public Charter School84K744
2.68 2.7%23.4%3.06Democracy Prep Endurance Charter School84M065
2.71 2.8%19.4%3.00Democracy Prep Charter School84M350
2.67 4.0%19.9%3.04Democracy Prep Harlem Charter School84M481
2.81 2.7%20.4%3.14Innovate Manhattan Charter School84M524
2.84 2.9%24.1%3.11Tech International Charter School84X258
21.6% 3.3%
PEER GROUP AVERAGES 2.75 3.13
J.H.S. 125 Henry Hudson
This page provides more granular data on students' state exam scores. It disaggregates these scores by grade and subject for 2012-13.
While the numbers here do not individually count for points, the detailed deconstruction should provide deeper insight into 2012-13
student performance.
Additional Information Page 7
6th Grade (n = 118) 2.29 15.3% 42.0
7th Grade (n = 178) 2.07 7.3% 77.0
8th Grade (n = 222) 2.07 6.8% 53.5
6th Grade (n = 116) 2.15 7.8% 41.5
7th Grade (n = 174) 2.21 8.0% 67.0
8th Grade (n = 212) 2.28 14.2% 80.0
State Exam Scores by Grade
ALL SUBJECTS: 21.4%
MATHEMATICS: 0.9%
95.7%
SCIENCE: 0.9%
.
LANGUAGE OTHER THAN
ENGLISH:
20.5%
.
95.6%
AVERAGE STUDENT
PROFICIENCY
PERCENTAGE OF STUDENTS
AT LEVEL 3 OR LEVEL 4
MEDIAN ADJUSTED
GROWTH PERCENTILE
Mathematics
English
Science
20.5%
0.9%
0.9%
19.5%
% of 8th Graders Earning High School Credit
FORMULA: ( % taking accelerated courses ) X ( % taking accelerated courses who passed ) = % EARNING HIGH SCHOOL CREDIT
) =
) =
) =
) =
) X (
) X (
) X (
) X (
(
(
(
(
THIS SCHOOL'S
RESULTS PEER AVERAGE CITY AVERAGE
8th Grade (n = 200) 2.88 51.0% .
Chronic Absenteeism
39.9%Students With Less Than 90% Attendance (n = 557) 21.9%
PERCENTAGE OF
STUDENTS SCHOOLWIDE
AVERAGE OF SCHOOLS
CITYWIDE
English (n = 181 ) 60.0 59.0 61.2
Mathematics (n = 184 ) 34.0 53.7 57.3
Long-Term Growth Percentile
High School Readiness Indicators

Lori PR 2012-13

  • 1.
    08X125 Student Progress 37.8 out of 60 ProgressReport 2012-13* J.H.S. 125 Henry Hudson PRINCIPAL: Lori Anne Dimarco Evanko DBN: 08X125 ENROLLMENT: 541 SCHOOL TYPE: Middle Overview Each school's Progress Report (1) measures the student year-to-year progress, (2) compares the school to peer schools, and (3) rewards success in moving all children forward, especially children with the greatest needs. CATEGORY SCORE DESCRIPTIONGRADE Student Performance 7.2 out of 25 School Environment 4.6 out of 15 Closing the Achievement Gap 4.3 out of 17 Overall Score 53.9 out of 100 Student Progress measures how much individual students improved on state tests in English and Math between 2012 and 2013, compared to other students who started at the same level. Student Performance measures student results on the 2013 state tests in English and Math. School Environment measures student attendance and a survey of the school community rating academic expectations, safety and respect, communication, and engagement. Schools receive additional credit for exceptional gains by students with disabilities, English Language Learners, and students starting with the lowest proficiency citywide. The overall grade is based on the total of all scores above. Category scores may not add up to total score because of rounding. B D D B PROGRESS REPORT B OVERALL SCORE 53.9 out of 100 OVERALL PERCENTILE RANK 42 This school's overall score is greater than or equal to that of 41.6 percent of Middle schools. For elementary, middle, and K-8 schools, the percent of schools receiving top grades was set in advance. Schools with average English and Math performance in the top third citywide cannot receive a grade lower than a C. Schools in their first year, in phase out, or with fewer than 25 students with progress results receive a report with no grade or score. Progress Report Grades - Middle GRADE SCORE RANGE 26% of schools 36% of schools 31% of schools 5% of schools 2% of schools A B C D F 67.7 or higher 53.0 - 67.6 37.3 - 52.9 29.1 - 37.2 29.0 or lower Progress Report Implications Strong Progress Report results are the basis for recognition and potential rewards for school leaders, and poor results are an important factor in determining whether schools require intensive support or intervention. For more information, see: http://schools.nyc.gov/community/planning/Support+and+Intervention.htm State Accountability The school's current status: Focus This designation is determined by the New York State Department of Education under the Elementary and Secondary Education Act (ESEA) Flexibility Waiver. More information on New York State accountability can be found here: http://schools.nyc.gov/Accountability/tools/accountability/default.htmhttp://schools.nyc.gov/ProgressReport QUALITY REVIEW Dev Developing (2012-13) The rating is based on three major categories of school performance: instruction that prepares students for college and careers, school organization and management, and quality of the learning environment. A school that receives a Developing rating typically demonstrates inconsistent teaching and learning practices and is working towards effective school management and a more positive learning environment. For more information see: http://schools.nyc.gov/Accountability/tools/review % OF SCHOOLS 2010 2011 2012 56 14 2 B C FGRADE: %IEP%BLACK OR HISPANIC %ELL 0.8621.6%70.4% 16.6% KEY DEMOGRAPHIC INDICATORS *During the 2012-13 school year, New York City public schools were affected by Hurricane Sandy. Adjustments have been made to attendance rates for all schools. ECONOMIC NEED INDEX PERCENTILES AND GRADES FOR PREVIOUS YEARS PERCENTILE:
  • 2.
    45.9 79.762.8 70.0 49.8 79.464.6 70.0 68.391.780.0 87.0 66.3 92.979.6 87.0 39.4 81.860.6 61.0 42.4 81.461.9 61.0 57.9 91.974.9 75.5 58.5 90.774.6 75.5 J.H.S. 125 Henry Hudson B 37.8 (out of 60) THIS SCHOOL'S RESULTS PERCENT OF PEER RANGE COMPARISON TO PEER SCHOOLS (WEIGHTED 75%) English 70.0 71.3%Median Adjusted Growth Percentile (n=448) 87.0 79.9%Median Adjusted Growth Percentile for School's Lowest Third (n=154) 61.0 50.9%Median Adjusted Growth Percentile (n=470) How To Interpret These Charts To determine the number of points earned, this school's 2012-13 results on each metric are compared to the results of peer schools and all schools serving the same grade levels citywide. The comparison to peer schools is worth 75% of the points for each metric and the comparison to all schools citywide is worth 25% of the points. The bars represent the range of results for the peer and city comparison schools that are within two standard deviations of the average. The percent of the range that is shaded is the school's share of possible points. The share is multiplied by the weight (75% or 25%) and the possible points for the metric to determine the points earned. This school's result 0% of range Average value among comparison schools 100% of range PERCENT OF RANGE Share of comparison range covered by the school's result 60% COMPARISON TO PEER SCHOOLS (WEIGHTED) Score Calculation Example FORMULA EXAMPLE ( ( PERCENT OF PEER RANGE 60% X X 0.75 0.75 8 0 5 0 7 5 1 0 0 + + PERCENT OF CITY RANGE 80% X X 0.25 0.25 ) X ) X POINTS POSSIBLE 3.75 = = POINTS EARNED 2.44 GRADE SCORE RANGE or higher - 38.7 - 28.3 - 16.4 or lower A B C D F 38.8 28.4 16.5 9.8 9.7 PERCENT OF CITY RANGE COMPARISON TO CITY SCHOOLS (WEIGHTED 25%) POINTS POSSIBLE POINTS EARNED 68.2% 77.8% 47.7% 15.00 15.00 15.00 10.58 11.91 7.52 TOTAL POINTS 60.00 37.82 Student Progress represents 60% of the total score. The grade is based on growth percentiles, a measure of how much individual students improved on state tests in English and Math between 2012 and 2013. Mathematics 75.5 51.8%Median Adjusted Growth Percentile for School's Lowest Third (n=162) 52.8% 15.00 7.81 School Progress Page 2 GRADE SCORE
  • 3.
    5.2% 23.0%14.1% 10.6% 0.0% 40.6%20.3% 10.6% 2.132.512.32 2.23 1.69 3.172.43 2.23 0.0% 28.8%14.4% 8.9% 0.0% 43.2%21.6% 8.9% 1.94 2.682.31 2.12 1.61 3.272.44 2.12 75.8% 100.0%89.9% 89.0% 69.5% 100.0%89.4% 89.0% 76.6% 100.0%88.5% 73.2% 68.9% 100.0%88.5% 73.2% 77.9% 100.0%89.8% 86.5% 70.0% 100.0%89.7% 86.5% 74.8% 100.0%88.6% 79.6% 67.7% 100.0%89.0% 79.6% J.H.S. 125 Henry Hudson D 7.2 (out of 25) THIS SCHOOL'S RESULTS PERCENT OF PEER RANGE COMPARISON TO PEER SCHOOLS (WEIGHTED 75%) English Percentage of Students at Level 3 or 4 (n=502) Average Student Proficiency (n=502) Mathematics Average Student Proficiency (n=518) How To Interpret These Charts To determine the number of points earned, this school's 2012-13 results on each metric are compared to the results of peer schools and all schools serving the same grade levels citywide. The comparison to peer schools is worth 75% of the points for each metric and the comparison to all schools citywide is worth 25% of the points. The bars represent the range of results for the peer and city comparison schools that are within two standard deviations of the average. The percent of the range that is shaded is the school's share of possible points. The share is multiplied by the weight (75% or 25%) and the possible points for the metric to determine the points earned. This school's result 0% of range Average value among comparison schools 100% of range PERCENT OF RANGE Share of comparison range covered by the school's result 60% COMPARISON TO PEER SCHOOLS (WEIGHTED) Score Calculation Example FORMULA EXAMPLE ( ( PERCENT OF PEER RANGE 60% X X 0.75 0.75 8 0 5 0 7 5 1 0 0 + + PERCENT OF CITY RANGE 80% X X 0.25 0.25 ) X ) X POINTS POSSIBLE 3.75 = = POINTS EARNED 2.44 GRADE SCORE RANGE or higher - 16.3 - 11.4 - 7.5 or lower A B C D F 16.4 11.5 7.6 6.1 6.0 PERCENT OF CITY RANGE COMPARISON TO CITY SCHOOLS (WEIGHTED 25%) POINTS POSSIBLE POINTS EARNED TOTAL POINTS 25.00 7.20 Student Performance represents 25% of the total score. The Student Performance grade is based on results on the 2013 state tests in English and Math and core course pass rates. State test metrics evaluate the percent of students who reach or exceed proficiency (Level 3 and 4) and students' average proficiency rating. Core course pass rates look at the percent of students in 6th through 8th grade who passed a course in a core subject area. Percentage of Students at Level 3 or 4 (n=518) Percent of Students Passing a Core Course English (n=511) Math (n=511) Science (n=511) Social Studies (n=511) School Performance Page 3 GRADE SCORE 30.3% 26.3% 24.3% 30.9% 54.5% 0.0% 38.9% 19.0% 10.6% 2.23 2.12 8.9% 89.0% 73.2% 86.5% 79.6% 26.1% 36.5% 30.7% 20.6% 63.9% 13.8% 55.0% 36.8% 5.00 5.00 5.00 5.00 1.25 1.25 1.25 1.25 1.46 1.44 1.30 1.42 0.04 0.71 0.54 0.29
  • 4.
    7.1 8.98.0 7.7 7.1 8.98.0 7.7 5.98.37.1 7.4 5.9 8.57.2 7.4 6.3 8.37.3 7.1 6.2 8.67.4 7.1 5.6 8.47.0 6.8 5.6 8.87.2 6.8 89.0% 95.4%92.2% 88.6% 86.8% 98.4%92.6% 88.6% J.H.S. 125 Henry Hudson D 4.6 (out of 15) How To Interpret These Charts To determine the number of points earned, this school's 2012-13 results on each metric are compared to the results of peer schools and all schools serving the same grade levels citywide. The comparison to peer schools is worth 75% of the points for each metric and the comparison to all schools citywide is worth 25% of the points. The bars represent the range of results for the peer and city comparison schools that are within two standard deviations of the average. The percent of the range that is shaded is the school's share of possible points. The share is multiplied by the weight (75% or 25%) and the possible points for the metric to determine the points earned. This school's result 0% of range Average value among comparison schools 100% of range PERCENT OF RANGE Share of comparison range covered by the school's result 60% COMPARISON TO PEER SCHOOLS (WEIGHTED) Score Calculation Example FORMULA EXAMPLE ( ( PERCENT OF PEER RANGE 60% X X 0.75 0.75 8 0 5 0 7 5 1 0 0 + + PERCENT OF CITY RANGE 80% X X 0.25 0.25 ) X ) X POINTS POSSIBLE 3.75 = = POINTS EARNED 2.44 GRADE SCORE RANGE or higher - 11.3 - 8.6 - 5.9 or lower A B C D F 11.4 8.7 6.0 4.4 4.3 TOTAL POINTS 15.00 4.57 School Environment represents 15% of the total score. The School Environment grade is based on student attendance and your school's NYC School Survey, where parents, teachers, and students in grade 6 and above rate academic expectations, safety and respect, communication, and engagement. School Environment Page 4 GRADE SCORE THIS SCHOOL'S RESULTS PERCENT OF PEER RANGE COMPARISON TO PEER SCHOOLS (WEIGHTED 75%) School Survey Results 7.7 33.3%Academic Expectations 7.4 62.5%Communication 7.1 40.0%Engagement PERCENT OF CITY RANGE COMPARISON TO CITY SCHOOLS (WEIGHTED 25%) POINTS POSSIBLE POINTS EARNED 33.3% 57.7% 37.5% 2.50 2.50 2.50 0.83 1.53 0.98 6.8 42.9%Safety and Respect 37.5% 2.50 1.04 88.6% 0.0%Attendance Rate 15.5% 5.00 0.19
  • 5.
    0.0% 48.4%24.2% 20.5% 0.0% 52.0%26.0% 20.5% 65.0%100.0%83.0% 85.0% 65.0% 100.0%85.0% 85.0% J.H.S. 125 Henry Hudson THIS SCHOOL'S RESULTS FIXED POINT VALUE POINTS POSSIBLE POINTS EARNED Schools receive additional credit for exceptional gains by students with disabilities, English Language Learners, and students starting with the lowest proficiency citywide. A school earns additional credit when each high-need student meets the success criteria for an eligible metric. The number of points will depend on the percentage of the school's population that is in the high-need group, the percentage of that group that is successful, and a "fixed point value" based on how difficult it is to achieve the success criteria. Additional Credit can only improve a school's Progress Report score. It cannot lower a school's score. Elementary schools are eligible for points on 16 additional credit metrics while middle and K-8 schools are eligible for points on up to 17 metrics, each of which is worth up to one point. (In the table below, "." in "This School's Results" indicates that a school has fewer than 5 eligible students in one of the categories.) Closing the Achievement Gap CATEGORY POPULATION PERCENTAGE Percent at Level 3 or 4 English 1.8%Self-Contained (n=55) 0.0%Integrated Co-Teaching (ICT) (n=34) Mathematics 0.0%Special Education Teacher Support Services (SETSS) (n=19) 0.0%Self-Contained (n=55) 2.9%Integrated Co-Teaching (ICT) (n=34) 0.0%Special Education Teacher Support Services (SETSS) (n=19) Percent at 75th Growth Percentile or Higher 42.2%English Language Learners (n=102) English 74.0%Self-Contained/ICT/SETSS (n=100) 61.1%Lowest Third Citywide (n=221) 67.3%Black and Hispanic Males in Lowest Third Citywide (n=107) 4.27TOTAL POINTS Mathematics English Language Learners (n=121) Lowest Third Citywide (n=242) Self-Contained/ICT/SETSS (n=102) Black and Hispanic Males in Lowest Third Citywide (n=108) English Language Learner Progress (n=79) Movement from SC/ICT/SETSS to Less Restrictive Environments (n=99) Percent of 8th Graders Earning High School Credit (n=220) 37.2% 49.6% 56.9% 51.9% 0.28 35.4% 20.5% 1.00 1.00 1.00 1.00 1.00 1.00 1.00 1.00 1.00 1.00 1.00 1.00 1.00 1.00 1.00 1.00 1.00 0.60 0.00 0.00 0.00 0.00 0.09 0.21 0.28 0.33 0.35 0.31 0.22 0.25 0.30 0.19 0.15 0.42 11.0% 6.8% 3.8% 10.6% 6.6% 3.7% 22.8% 22.3% 49.3% 23.9% 25.7% 51.5% 21.7% 23.0% 18.3% 14.6% 3.036 0.609 0.619 1.946 0.494 0.536 0.022 0.017 0.011 0.022 0.023 0.012 0.020 0.025 0.029 0.037 Page 5 THIS SCHOOL'S RESULTS PERCENT OF PEER RANGE COMPARISON TO PEER SCHOOLS (WEIGHTED 75%) PERCENT OF CITY RANGE COMPARISON TO CITY SCHOOLS (WEIGHTED 25%) 42.4% 9th Grade Adjusted Credit Accumulation of Former 8th Graders (n=197) 85.0% 1.0057.1% 57.1% 0.57 39.4%
  • 6.
    Peer Group SchoolsJ.H.S. 125 Henry Hudson PEER GROUP CALCULATION PEER GROUP FOR: J.H.S. 125 Henry Hudson Each school's performance is compared to the performance of schools in its peer group. Peer schools are those New York City public schools with a student population most like this school's population. Each elementary and middle school has up to 40 peer schools and each K-8 school has up to 30 peer schools. Page 6 Peer groupings are created using a “nearest neighbor” matching methodology. This methodology examines the mathematical difference between a school and all potential peers on a given set of characteristics. Schools with the smallest difference across all the characteristics are peered together. DBN SCHOOL AVERAGE MATH PROFICIENCY %STUDENTS WITH DISABILITIES %OVERAGE AVERAGE ENGLISH PROFICIENCY 2.76 3.3%21.6%3.19J.H.S. 125 Henry Hudson08X125 2.74 2.2%25.3%3.08M.S. 250 West Side Collaborative Middle School03M250 2.79 3.2%22.0%3.22Isaac Newton Middle School for Math & Science04M825 2.72 4.5%21.4%3.10J.H.S. 131 Albert Einstein08X131 2.69 3.6%21.1%3.04Bronx Studio School for Writers and Artists08X269 2.82 3.1%23.9%3.32Archimedes Academy for Math, Science and Technology Applications08X367 2.72 4.0%25.8%3.11Mott Hall Community School08X467 2.72 3.7%19.0%3.13Comprehensive Model School Project M.S. 32709X327 2.78 3.9%19.9%3.09Science and Technology Academy: A Mott Hall School09X454 2.70 3.5%24.0%3.12West Bronx Academy for The Future10X243 2.72 4.4%19.6%3.07In-Tech Academy (M.S. / High School 368)10X368 2.64 3.9%20.6%3.03M.S. 39010X390 2.72 2.4%24.0%3.13Bronx Green Middle School11X326 2.80 2.8%20.5%3.23Pelham Academy of Academics and Community Engagement11X468 2.70 4.5%20.5%3.13Bronx Park Middle School11X556 2.70 3.3%22.7%3.18Mott Hall V12X242 2.77 3.1%20.9%3.08Kappa III12X316 2.87 2.8%18.3%3.21M.S. 113 Ronald Edmonds Learning Center13K113 2.78 3.2%24.4%3.08M.S. K266 - Park Place Community Middle School13K266 2.76 1.9%21.8%3.04Fort Greene Preparatory Academy13K691 2.75 4.5%20.2%3.17Frederick Douglass Academy IV Secondary School16K393 2.77 2.6%18.1%3.09I.S. 211 John Wilson18K211 2.76 2.7%22.9%3.07The Science and Medicine Middle School18K366 2.73 2.0%21.6%3.15Urban Assembly School for Criminal Justice20K609 2.76 3.4%19.0%3.25I.S. 096 Seth Low21K096 2.80 2.0%19.2%3.14J.H.S. 078 Roy H. Mann22K078 2.79 1.9%18.8%3.11I.S. 07724Q077 2.76 3.8%24.1%3.19I.S. 250 The Robert F. Kennedy Community Middle School25Q250 2.81 4.6%17.9%3.24J.H.S. 226 Virgil I. Grissom27Q226 2.73 4.5%21.7%3.11Academy of Medical Technology: a College Board School27Q309 2.76 4.8%20.0%3.08Catherine & Count Basie Middle School 7228Q072 2.78 4.0%17.2%3.19I.S. 204 Oliver W. Holmes30Q204 2.80 4.3%26.5%3.19I.S. 051 Edwin Markham31R051 2.73 2.3%23.0%3.06I.S. 061 William a Morris31R061 2.77 2.7%24.3%3.08Launch Expeditionary Learning Charter School84K360 2.83 2.0%25.1%3.22Coney Island Preparatory Public Charter School84K744 2.68 2.7%23.4%3.06Democracy Prep Endurance Charter School84M065 2.71 2.8%19.4%3.00Democracy Prep Charter School84M350 2.67 4.0%19.9%3.04Democracy Prep Harlem Charter School84M481 2.81 2.7%20.4%3.14Innovate Manhattan Charter School84M524 2.84 2.9%24.1%3.11Tech International Charter School84X258 21.6% 3.3% PEER GROUP AVERAGES 2.75 3.13
  • 7.
    J.H.S. 125 HenryHudson This page provides more granular data on students' state exam scores. It disaggregates these scores by grade and subject for 2012-13. While the numbers here do not individually count for points, the detailed deconstruction should provide deeper insight into 2012-13 student performance. Additional Information Page 7 6th Grade (n = 118) 2.29 15.3% 42.0 7th Grade (n = 178) 2.07 7.3% 77.0 8th Grade (n = 222) 2.07 6.8% 53.5 6th Grade (n = 116) 2.15 7.8% 41.5 7th Grade (n = 174) 2.21 8.0% 67.0 8th Grade (n = 212) 2.28 14.2% 80.0 State Exam Scores by Grade ALL SUBJECTS: 21.4% MATHEMATICS: 0.9% 95.7% SCIENCE: 0.9% . LANGUAGE OTHER THAN ENGLISH: 20.5% . 95.6% AVERAGE STUDENT PROFICIENCY PERCENTAGE OF STUDENTS AT LEVEL 3 OR LEVEL 4 MEDIAN ADJUSTED GROWTH PERCENTILE Mathematics English Science 20.5% 0.9% 0.9% 19.5% % of 8th Graders Earning High School Credit FORMULA: ( % taking accelerated courses ) X ( % taking accelerated courses who passed ) = % EARNING HIGH SCHOOL CREDIT ) = ) = ) = ) = ) X ( ) X ( ) X ( ) X ( ( ( ( ( THIS SCHOOL'S RESULTS PEER AVERAGE CITY AVERAGE 8th Grade (n = 200) 2.88 51.0% . Chronic Absenteeism 39.9%Students With Less Than 90% Attendance (n = 557) 21.9% PERCENTAGE OF STUDENTS SCHOOLWIDE AVERAGE OF SCHOOLS CITYWIDE English (n = 181 ) 60.0 59.0 61.2 Mathematics (n = 184 ) 34.0 53.7 57.3 Long-Term Growth Percentile High School Readiness Indicators