
Download to read offline
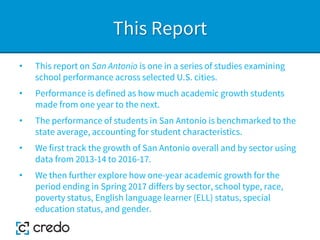
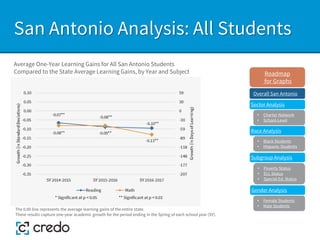
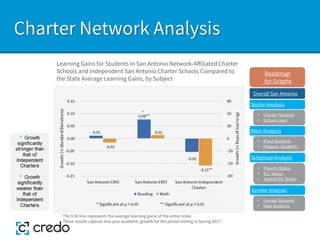
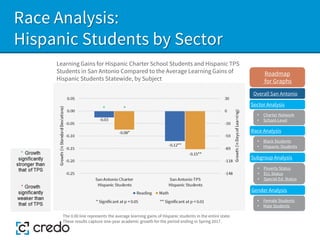

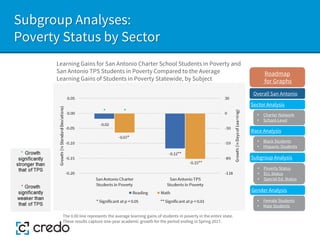
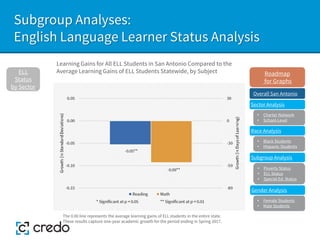

The 2019 study examines academic growth in San Antonio public schools, benchmarking performance against state averages while considering various factors such as race and socioeconomic status. It analyzes student performance over the period from 2013-14 to 2016-17 and presents results through various comparisons of charter and traditional public schools. The findings reveal significant insights into the learning gains of different student subgroups, with performance displayed in a variety of formats including standard deviations and days of learning.


