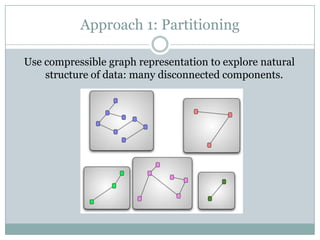
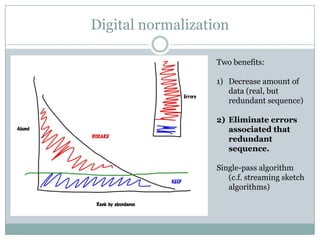
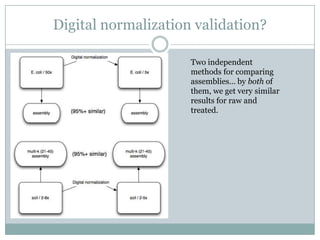
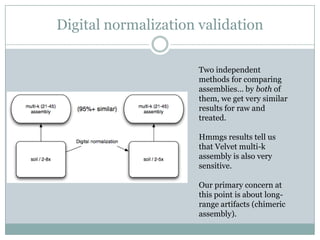
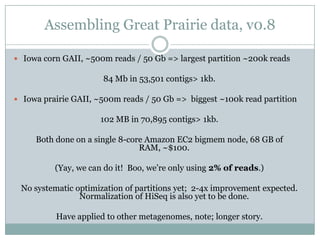
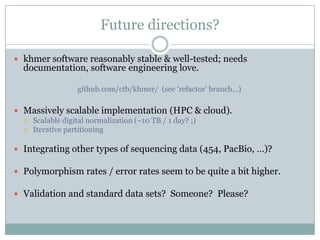
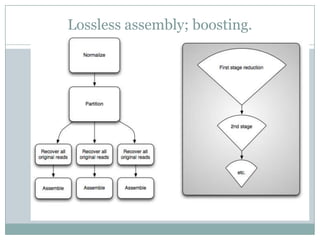
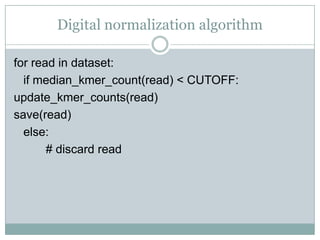
Scaling metagenome assembly –to infinity and beeeeeeeeeeyond!C. Titus Brown et al.Computer Science / Microbiology DeptsMichigan State UniversityIn collaboration with Great Prairie Grand Challenge(Tiedje, Jansson, Tringe)
SAMPLING LOCATIONS
Sampling strategy per site1 M1 cM10 M1 cMReference soil1 MSoil cores: 1 inch diameter, 4 inches deepTotal:8 Reference metagenomes +64 spatially separated cores             (pyrotag sequencing)10 M
Great Prairie sequencing summary200x human genome…!> 10x more challenging (total diversity)
Our perspectiveGreat Prairie project: there is no end to the data!Immense biological depth: estimate ~1-2 TB (10**12) of raw sequence needed to assemble top ~20-40% of microbes.Improvements in sequencing techExisting methods for scaling assembly simply will not suffice: this is a losing battle.Abundance filtering XXXBetter data structures XXXParallelization is not going to be sufficient; neither are advances in data structures.I think: bad scaling is holding back assembly progress.
Our perspective, #2Deep sampling is needed for these samplesIllumina is it, for now.The last thing in the world we want to do is write yet another assembler…pre-assembly filtering, instead.All of our techniques can be used together with any assembler.We’ve mostly stuck with Velvet, for reasons of historical contingency.
Two enabling technologiesVery efficient k-mer countingBloom counting hash/MinCount Sketch data structure; constant memoryScales ~10x over traditional data structuresk-independent.Probabilistic properties well suited to next-gen data sets.Very efficient de Bruijn graph representationWe traverse k-mers stored in constant-memory Bloom filters.Compressible probabilistic data structure; very accurate.Scales ~20x over traditional data structures.K-independent.…cannot directly be used for assembly because of FP.
Approach 1: PartitioningUse compressible graph representation to explore natural structure of data: many disconnected components.
Partitioning for scalingCan be done in ~10x less memory than assembly.Partition at low k and assemble exactly at any higher k (DBG).Partitions can then be assembled independentlyMultiple processors -> scalingMultiple k, coverage -> improved assemblyMultiple assembly packages (tailored to high variation, etc.)Can eliminate small partitions/contigs in the partitioning phase.In theory, an exact approach to divide and conquer/data reduction.
Adina Howe
Partitioning challengesTechnical challenge: existence of “knots” in the graph that artificially connect everything.Unfortunately, partitioning is not the solution.Runs afoul of same k-mer/error scaling problem that all k-mer assemblers have…20x scaling isn’t nearly enough, anyway 
Digression: sequencing artifactsAdina Howe
Partitioning challengesUnfortunately, partitioning is not the solution.Runs afoul of same k-mer/error scaling problem that all k-mer assemblers have…20x scaling isn’t nearly enough, anyway 
Approach 2: Digital normalization“Squash” high coverage readsEliminate reads we’ve seen before (e.g. “> 5 times”)Digital version of experimental “mRNA normalization”.Nice algorithm!Single-passConstant memoryTrivial to implementEasy to parallelize / scale (memory AND throughput)“Perfect” solution?(Works fine for MDA, mRNAseq…)
Digital normalizationTwo benefits:Decrease amount of data (real, but redundant sequence)Eliminate errors associated that redundant sequence.Single-pass algorithm (c.f. streaming sketch algorithms)
Digital normalization validation?Two independent methods for comparing assemblies… by both of them, we get very similar results for raw and treated.
Comparing assemblies quantitativelyBuild a “vector basis” for assemblies out of orthogonal M-base windows of DNA.This allows us to disassemble assemblies into vectors, compare them, and even “subtract” them from one another.
Running HMMs over de Bruijn graphs(=> cross validation)hmmgs: Assemble based on good-scoring HMM paths through the graph.Independent of other assemblers; very sensitive, specific.95% of hmmgsrplB domains are present in our partitioned assemblies.CTCACTTTCGTAGACATAACCCTAJordan Fish, Qiong Wang, and Jim Cole (RDP)GTT
Digital normalization validationTwo independent methods for comparing assemblies… by both of them, we get very similar results for raw and treated. Hmmgs results tell us that Velvet multi-k assembly is also very sensitive.Our primary concern at this point is about long-range artifacts (chimeric assembly).
TechniquesDeveloped suite of techniques that work for scaling, without loss of information (?)While we have no good way to assess chimeras and misassemblies, basic sequence content and gene content stay the same across treatments.And… what, are we just sitting here writing code?No!  We have data to assemble!
Assembling Great Prairie data, v0.8Iowa corn GAII, ~500m reads / 50 Gb => largest partition ~200k reads84 Mb in 53,501 contigs > 1kb.Iowa prairie GAII, ~500m reads / 50 Gb =>  biggest ~100k read partition102 MB in 70,895 contigs > 1kb.Both done on a single 8-core Amazon EC2 bigmem node, 68 GB of RAM, ~$100.(Yay, we can do it!  Boo, we’re only using 2% of reads.)No systematic optimization of partitions yet;  2-4x improvement expected.  Normalization of HiSeq is also yet to be done.Have applied to other metagenomes, note; longer story.
Future directions?khmer software reasonably stable & well-tested; needs documentation, software engineering love.github.com/ctb/khmer/  (see ‘refactor’ branch…)Massively scalable implementation (HPC & cloud).Scalable digital normalization (~10 TB / 1 day? ;)Iterative partitioningIntegrating other types of sequencing data (454, PacBio, …)?Polymorphism rates / error rates seem to be quite a bit higher.Validation and standard data sets?  Someone?  Please?
Lossless assembly; boosting.
Acknowledgements:Thek-mer gang:Adina Howe, Jason Pell, ArendHintze, Qingpeng Zhang, Rose Canino-Koning, Tim Brom.mRNAseq:LikitPreeyanon, Alexis Pyrkosz, Hans Cheng, Billie Swalla, and Weiming Li.HMM graph search:Jordan Fish, Qiong Wang, Jim Cole.Great Prairie consortium:Jim Tiedje, Rachel Mackelprang, Susannah Tringe, Janet JanssonFunding: USDA NIFA; MSU, startup and iCER; DOE; BEACON/NSF STC; Amazon Education.
Lumps!Adina Howe
Lumps!Adina Howe
Knots in the graph are caused by sequencing artifacts.
Identifying the source of knotsUse a systematic traversal algorithm to identify highly-connected k-mers.Removal of these k-mers (trimming) breaks up the knots.Many, but not all, of these highly-connected k-mers are associated with high-abundance k-mers.
Highly connected k-mers are position-dependentAdina Howe
HCKs under-represented in assemblyAdina Howe
HCKs tend to end contigsAdina Howe
Our current modelContigs are extended or joined around artifacts, with an observation bias towards such extensions (because of length cutoff).Tendency is for a long contig to be extended by 1-2 reads, so artifacts trend towards location at end of contig.Adina Howe
Conclusions (artifacts)They connect lots of stuff (preferential attachment)They result from something in the sequencing (3’ bias in reads)Assemblers don’t like using themThe major effect of removing them is to shorten many contigs by a read.
Digital normalization algorithmfor read in dataset:	if median_kmer_count(read) < CUTOFF:update_kmer_counts(read)save(read)	else:		# discard read
Supplemental: abundance filtering is very lossy.
Per-partition assembly optimizationStrategy:Vary k from 21 to 51, assemble with velvet.Choose k that maximizes sum(contigs > 1kb)Ran top partitions in Iowa corn (4.2m reads, 303 partitions)For k=33,   3.5 mb in 1876 contigs > 1kb, max 15.7 kbFor best k for each partition(varied between 31 and 47),	5.7 mb in 2511 contigs > 1kb, max 51.7 kb
Comparing assemblies quantitativelyBuild a “vector basis” for assemblies out of orthogonal M-base windows of DNA.This allows us to disassemble assemblies into vectors, compare them, and even “subtract” them from one another.
Comparing assemblies / dendrogram

Scaling metagenome assembly

  • 1.
    Scaling metagenome assembly–to infinity and beeeeeeeeeeyond!C. Titus Brown et al.Computer Science / Microbiology DeptsMichigan State UniversityIn collaboration with Great Prairie Grand Challenge(Tiedje, Jansson, Tringe)
  • 2.
  • 3.
    Sampling strategy persite1 M1 cM10 M1 cMReference soil1 MSoil cores: 1 inch diameter, 4 inches deepTotal:8 Reference metagenomes +64 spatially separated cores (pyrotag sequencing)10 M
  • 4.
    Great Prairie sequencingsummary200x human genome…!> 10x more challenging (total diversity)
  • 5.
    Our perspectiveGreat Prairieproject: there is no end to the data!Immense biological depth: estimate ~1-2 TB (10**12) of raw sequence needed to assemble top ~20-40% of microbes.Improvements in sequencing techExisting methods for scaling assembly simply will not suffice: this is a losing battle.Abundance filtering XXXBetter data structures XXXParallelization is not going to be sufficient; neither are advances in data structures.I think: bad scaling is holding back assembly progress.
  • 6.
    Our perspective, #2Deepsampling is needed for these samplesIllumina is it, for now.The last thing in the world we want to do is write yet another assembler…pre-assembly filtering, instead.All of our techniques can be used together with any assembler.We’ve mostly stuck with Velvet, for reasons of historical contingency.
  • 7.
    Two enabling technologiesVeryefficient k-mer countingBloom counting hash/MinCount Sketch data structure; constant memoryScales ~10x over traditional data structuresk-independent.Probabilistic properties well suited to next-gen data sets.Very efficient de Bruijn graph representationWe traverse k-mers stored in constant-memory Bloom filters.Compressible probabilistic data structure; very accurate.Scales ~20x over traditional data structures.K-independent.…cannot directly be used for assembly because of FP.
  • 8.
    Approach 1: PartitioningUsecompressible graph representation to explore natural structure of data: many disconnected components.
  • 9.
    Partitioning for scalingCanbe done in ~10x less memory than assembly.Partition at low k and assemble exactly at any higher k (DBG).Partitions can then be assembled independentlyMultiple processors -> scalingMultiple k, coverage -> improved assemblyMultiple assembly packages (tailored to high variation, etc.)Can eliminate small partitions/contigs in the partitioning phase.In theory, an exact approach to divide and conquer/data reduction.
  • 10.
  • 11.
    Partitioning challengesTechnical challenge:existence of “knots” in the graph that artificially connect everything.Unfortunately, partitioning is not the solution.Runs afoul of same k-mer/error scaling problem that all k-mer assemblers have…20x scaling isn’t nearly enough, anyway 
  • 12.
  • 13.
    Partitioning challengesUnfortunately, partitioningis not the solution.Runs afoul of same k-mer/error scaling problem that all k-mer assemblers have…20x scaling isn’t nearly enough, anyway 
  • 14.
    Approach 2: Digitalnormalization“Squash” high coverage readsEliminate reads we’ve seen before (e.g. “> 5 times”)Digital version of experimental “mRNA normalization”.Nice algorithm!Single-passConstant memoryTrivial to implementEasy to parallelize / scale (memory AND throughput)“Perfect” solution?(Works fine for MDA, mRNAseq…)
  • 15.
    Digital normalizationTwo benefits:Decreaseamount of data (real, but redundant sequence)Eliminate errors associated that redundant sequence.Single-pass algorithm (c.f. streaming sketch algorithms)
  • 16.
    Digital normalization validation?Twoindependent methods for comparing assemblies… by both of them, we get very similar results for raw and treated.
  • 17.
    Comparing assemblies quantitativelyBuilda “vector basis” for assemblies out of orthogonal M-base windows of DNA.This allows us to disassemble assemblies into vectors, compare them, and even “subtract” them from one another.
  • 18.
    Running HMMs overde Bruijn graphs(=> cross validation)hmmgs: Assemble based on good-scoring HMM paths through the graph.Independent of other assemblers; very sensitive, specific.95% of hmmgsrplB domains are present in our partitioned assemblies.CTCACTTTCGTAGACATAACCCTAJordan Fish, Qiong Wang, and Jim Cole (RDP)GTT
  • 19.
    Digital normalization validationTwoindependent methods for comparing assemblies… by both of them, we get very similar results for raw and treated. Hmmgs results tell us that Velvet multi-k assembly is also very sensitive.Our primary concern at this point is about long-range artifacts (chimeric assembly).
  • 20.
    TechniquesDeveloped suite oftechniques that work for scaling, without loss of information (?)While we have no good way to assess chimeras and misassemblies, basic sequence content and gene content stay the same across treatments.And… what, are we just sitting here writing code?No! We have data to assemble!
  • 21.
    Assembling Great Prairiedata, v0.8Iowa corn GAII, ~500m reads / 50 Gb => largest partition ~200k reads84 Mb in 53,501 contigs > 1kb.Iowa prairie GAII, ~500m reads / 50 Gb => biggest ~100k read partition102 MB in 70,895 contigs > 1kb.Both done on a single 8-core Amazon EC2 bigmem node, 68 GB of RAM, ~$100.(Yay, we can do it! Boo, we’re only using 2% of reads.)No systematic optimization of partitions yet; 2-4x improvement expected. Normalization of HiSeq is also yet to be done.Have applied to other metagenomes, note; longer story.
  • 22.
    Future directions?khmer softwarereasonably stable & well-tested; needs documentation, software engineering love.github.com/ctb/khmer/ (see ‘refactor’ branch…)Massively scalable implementation (HPC & cloud).Scalable digital normalization (~10 TB / 1 day? ;)Iterative partitioningIntegrating other types of sequencing data (454, PacBio, …)?Polymorphism rates / error rates seem to be quite a bit higher.Validation and standard data sets? Someone? Please?
  • 23.
  • 24.
    Acknowledgements:Thek-mer gang:Adina Howe,Jason Pell, ArendHintze, Qingpeng Zhang, Rose Canino-Koning, Tim Brom.mRNAseq:LikitPreeyanon, Alexis Pyrkosz, Hans Cheng, Billie Swalla, and Weiming Li.HMM graph search:Jordan Fish, Qiong Wang, Jim Cole.Great Prairie consortium:Jim Tiedje, Rachel Mackelprang, Susannah Tringe, Janet JanssonFunding: USDA NIFA; MSU, startup and iCER; DOE; BEACON/NSF STC; Amazon Education.
  • 25.
    Acknowledgements:Thek-mer gang:Adina Howe,Jason Pell, ArendHintze, Qingpeng Zhang, Rose Canino-Koning, Tim Brom.mRNAseq:LikitPreeyanon, Alexis Pyrkosz, Hans Cheng, Billie Swalla, and Weiming Li.HMM graph search:Jordan Fish, Qiong Wang, Jim Cole.Great Prairie consortium:Jim Tiedje, Rachel Mackelprang, Susannah Tringe, Janet JanssonFunding: USDA NIFA; MSU, startup and iCER; DOE; BEACON/NSF STC; Amazon Education.
  • 27.
  • 28.
  • 29.
    Knots in thegraph are caused by sequencing artifacts.
  • 30.
    Identifying the sourceof knotsUse a systematic traversal algorithm to identify highly-connected k-mers.Removal of these k-mers (trimming) breaks up the knots.Many, but not all, of these highly-connected k-mers are associated with high-abundance k-mers.
  • 31.
    Highly connected k-mersare position-dependentAdina Howe
  • 32.
    HCKs under-represented inassemblyAdina Howe
  • 33.
    HCKs tend toend contigsAdina Howe
  • 34.
    Our current modelContigsare extended or joined around artifacts, with an observation bias towards such extensions (because of length cutoff).Tendency is for a long contig to be extended by 1-2 reads, so artifacts trend towards location at end of contig.Adina Howe
  • 35.
    Conclusions (artifacts)They connectlots of stuff (preferential attachment)They result from something in the sequencing (3’ bias in reads)Assemblers don’t like using themThe major effect of removing them is to shorten many contigs by a read.
  • 36.
    Digital normalization algorithmforread in dataset: if median_kmer_count(read) < CUTOFF:update_kmer_counts(read)save(read) else: # discard read
  • 37.
  • 38.
    Per-partition assembly optimizationStrategy:Varyk from 21 to 51, assemble with velvet.Choose k that maximizes sum(contigs > 1kb)Ran top partitions in Iowa corn (4.2m reads, 303 partitions)For k=33, 3.5 mb in 1876 contigs > 1kb, max 15.7 kbFor best k for each partition(varied between 31 and 47), 5.7 mb in 2511 contigs > 1kb, max 51.7 kb
  • 39.
    Comparing assemblies quantitativelyBuilda “vector basis” for assemblies out of orthogonal M-base windows of DNA.This allows us to disassemble assemblies into vectors, compare them, and even “subtract” them from one another.
  • 40.

Editor's Notes

  • #2 Thank organizers; point to talk online. Mention Susannah/first asst prof problem.
  • #5 1) Very high diversity ~30 billion k-mers. 2) No k-mer overlap between Iowa corn and prairie; co-assembly futile.
  • #8 Indicate “surprising/awesome” components.
  • #11 Connectivity source organism abundance
  • #17 Comparing assemblies is hard, and we’ve had to build tools to build tools to let us compare assemblies. However, the results are good. Multi-k assemblies are essential, note.
  • #19 Completely different style of assembler; useful for cross validation.
  • #22 Note that all of this was done on Amazon in 68gb
  • #24 Move towards loosely coupled environment for lossless approaches to scaling assembly? Weak classifiers &amp; boosting theory can also be applied (trivially). Note, at some point you should just sequence single cells or something.
  • #25 Funding: MSU startup, USDA NIFA, DOE, BEACON, Amazon.
  • #26 Funding: MSU startup, USDA NIFA, DOE, BEACON, Amazon.
  • #41 Multi-k stuff.