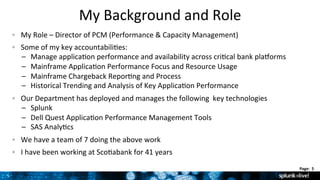
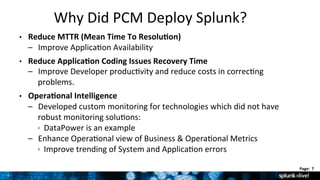
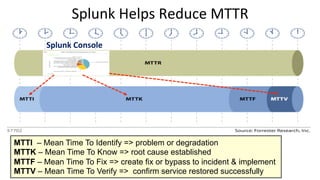
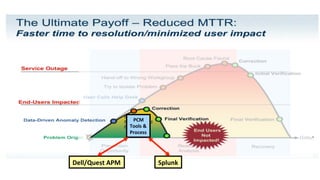
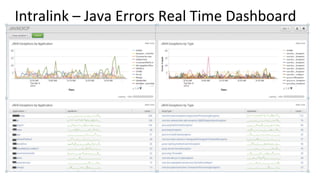
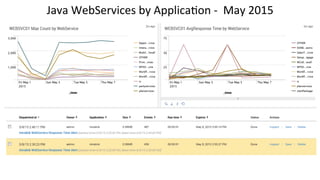
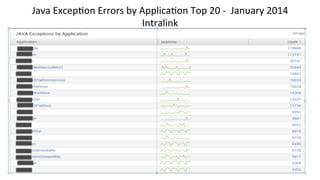
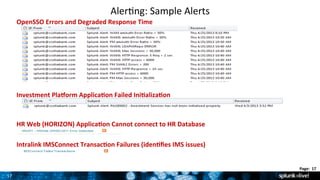
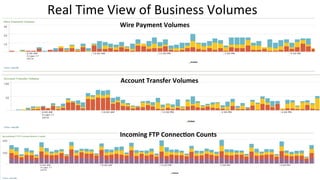
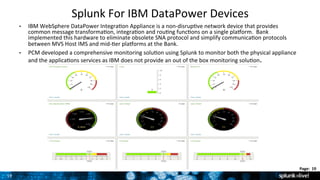
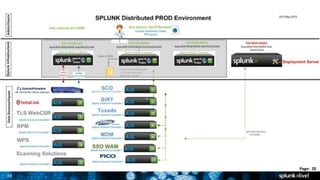
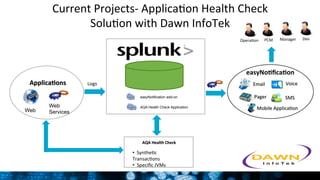
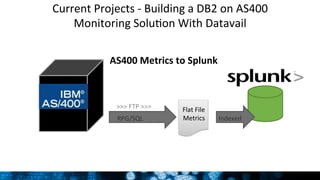
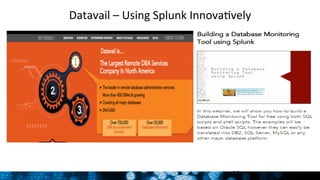
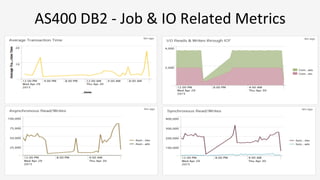
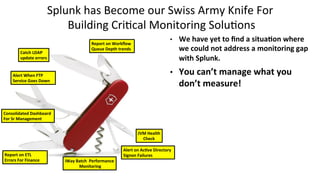
Monitoring and Instrumentation Strategies: Tips and Best Practices - AppSphere16AppDynamics
Monitoring is complicated, and in most organizations consists of far too many tools owned by too many teams. Fixing monitoring issues requires people, process, and technology. Hear common issues seen in the real world including what should be monitored or collected from a technology and a business perspective.
Investigate what instrumentation is most scalable and effective across languages, commonly used APIs, and possibilities for capturing data from common languages like Java, .NET, and PHP. Cover browser and mobile instrumentation techniques. Get tips on which APIs to use, what open source tools and frameworks can be leveraged, and how to coordinate and communicate requirements across your organization.
Key takeaways:
o What is instrumentation, and what to instrument, collect, and store
o How this can be accomplished on common software stacks
o How to work with application owners to collect business data
o How correlation works in custom open source or packaged monitoring tools
For more information, go to: www.appdynamics.com
Assuring the Delivery of Business Transactions and ServicesCA Technologies
The Operations Center is where IT ties everything together, every link in the service delivery chain-applications, systems, networks, mobility, storage, data center—and where IT strives to ensure business services are performing as intended to support all business processes and consistently deliver successful customer interactions. In this opening keynote address, John Smith, GM of the Enterprise Management solution group responsible for the CA application performance and infrastructure businesses, welcomes you to the Opscenter, provides insight into innovations his team will showcase and gives you guidance on must-do activities at CA World 2014.
For more information on DevOps solutions from CA Technologies, please visit: http://bit.ly/1wbjjqX
How the World Bank Standardized on AppDynamics as its Enterprise-Wide APM Sol...AppDynamics
This session will describe in detail why the World Bank chose AppDynamics for its Application Performance Management (APM) solution to align with its revamped enterprise monitoring strategy. The World Bank historically had many monitoring tools that were implemented in silos. Hear straight from this customer about the benefits of a consistent enterprise monitoring strategy in the wake of a tools consolidation.
Key takeaways:
o Benefits that the World Bank achieved by consolidating monitoring tools
o Overall monitoring strategy and the value proposition AppDynamics allowed the World Bank to realize
o Using AppDynamics every day for faster problem resolution and rapid service restoration
For more information go to: www.appdynamics.com
PayU's Digital Transformation: Transparency from Dev to Prod, Monitoring Micr...AppDynamics
PayU is a leading payment services provider with presence in 16 growth markets across the world. Its mantra within IT is "fail early, fail often and never roll back," but this is a challenge in a global environment, with cross-located development and operations teams, multiple time zones, cultures, languages, and skill sets.
To solve this challenge and provide transparency to development and production teams, PayU chose the AppDynamics Application Intelligence platform. Today AppDynamics gives PayU the ability to get immediate feedback of code changes regardless of the environment or the origin of change. The solution fits perfectly with the microservice architecture and has helped with DevOps adoption in all locations.
Key takeaways:
o Challenges faced in monitoring microservice-based applications in a globally dispersed operation
o How AppDynamics provides a single pane of glass to monitor application changes
o Best practices for utilizing AppDynamics in a DevOps culture
For more information, go to: www.appdynamics.com
How Q2 eBanking Maximizes Customer Experience for a Hyper-Growth SaaS Platfor...AppDynamics
Q2 eBanking partners with financial institutions that want to leverage the power of virtual banking to grow accounts, increase market share, and become more influential within the communities they serve.
This session will explore the challenges and importance of innovating operationally to better manage user experience in a hyper-growth SaaS platform. Review a proven decision process and goals in rolling out AppDynamics at Q2, hear experiences in automating deployments across a large and complex environment spanning hundreds of unique customers and thousands of servers, and gain insight into key wins and experiences Q2 has had since deploying AppDynamics.
Key takeaways:
o Automation strategies for deploying AppDynamics rapidly across a large, multi-tenant SaaS platform
o Best practices for leveraging AppDynamics to increase collaboration between development and operations
o Success stories and practical lessons learned in the first nine months implementing a large AppDynamics deployment
For more information, go to: www.appdynamics.com
Before your newly developed R algorithms can be used in a real-life production system, some additional challenges need to be tackled. In this presentation I will discuss the integration of R algorithms in the .NET back-end of the cash supply chain optimization solution of c-Quilibrium, one of our customers. Specific topics that will be addressed include how to set up the communication between R and .NET, parallelization of the R algorithms, encryption of the R code, and logging of the algorithm’s status and results.
DevOps monitoring: Feedback loops in enterprise environmentsJonah Kowall
This presentation was given at TopConf Tallinn in May 2015.
Title: Driving the DevOps feedback loop in the Enterprise
Description (brief overview for marketing purposes, max. length 400 characters-about 65 words):
DevOps requires feedback loops backed by consistent data, within enterprises many layers of tools make visibility a challenge. This session outlines modernizing monitoring and providing the right data collection capabilities to support agile application operations. This session will outline the use of open source and commercial software solutions which fit startups to the enterprise.
Abstract (Longer, more detailed description (3-6 paragraphs, bullet points welcome) of your presentation to help the program committee understand what you will cover. Please keep in mind that if your proposal is chosen, this abstract will also appear on the website to help conference attendees decide if it's right for them.):
Enterprises do not have the benefit of starting from scratch, they must implement DevOps in an existing environment, often managing heritage investments along with fast moving projects. The monitoring tools unfortunately fall into the same category. These complex, dated, and costly monitoring tools don’t meet today’s needs in providing the visibility required for agile development that leverage continuous delivery and DevOps. Not only are the tools an issue, but the visibility and approaches are also problematic.
The use of open source tools has been the de facto approach for DevOps, but this approach comes with it’s own set of challenges in terms of managing a complex stack of tools with varying quality of support/community. The move to a metrics-driven feedback loop enables teams to act fast at any stage of the product lifecycle. We will outline common technology stacks and approaches using graphite, statsd, and collectd along with nagios, munin, and other system monitoring tools. We will also outline commercial solutions, and how these tools tend to fall into silos as well.
Monitoring must be reformed with new platforms and technologies, fitting specific design patterns which meet the needs of DevOps teams, these will be outlined and explained from a requirements perspective, providing a roadmap for how to apply these learnings inside your company. Join this session to take back an evolved approach to unified monitoring and how you can get your company to be metrics driven
Attendees of this session will walk away with a clear understanding of:
Understanding today’s tooling limitations
Open source tool sprawl issues
Fundamental patterns of monitoring
How these will be solved in the future
Database Visibility and Troubleshooting Hands-on Lab - AppSphere16AppDynamics
In this two-hour, instructor-led hands-on lab, attendees will learn how to configure the AppDynamics Database Visibility module and evaluate key features. Topics include:
o Setting up Database Visibility
o Troubleshooting application performance issues caused by database issues
o Monitoring database performance in conjunction with database hardware performance
o Custom dashboard for monitoring key database metrics
o Debugging sudden increase in CPU utilization of the database
The lab will start with an overview and live demo of these features, hands-on exercises, Q&A, and sharing of best practices. To get the most out of the lab, attendees will be required to complete pre-requisite exercises and bring their own laptops.
Building & sustaining a monitoring team in a multi-application landscapeMeryemElMorabit
In a multi-application environment, it can become complex and time-consuming to keep track of those different interfaces, all with their own toolset and issue resolution. A monitoring team might provide the perfect solution to this “problem”. Such a team is solely focused on monitoring the different interfaces and assessing/resolving the risks and priorities that might arise. The consequence is that you get a good overview of your IT system and how healthy it is.
Castle Walls Under Digital Siege: Risk-based Security for z/OSCA Technologies
The mainframe remains more resistant to a malicious breach than any other part of the infrastructure. However, like medieval castles, their walls are no longer impregnable. Just as siege engines brought down walls and traitors opened gates, the mainframe experiences risks from both technical exploits and social engineering. Learn more about how applying risk-based security to z/OS helps you anticipate attacks and compromises before they occur, so you can enhance your walls of protection to your mission-critical data.
For more information, please visit http://cainc.to/Nv2VOe
Speakers:
Abner Germanow, Sr. Director Strategic Marketing, New Relic
Michael Michael, Sr. Director of Product Management, Apprenda
Hybrid clouds are helping the enterprise achieve greater agility and scalability. But challenges remain.
Application performance issues and friction between ops teams and developers continue, while businesses struggle to enhance their customer experience, reduce time to market, and improve IT manageability.
In this webinar, see how Apprenda’s integration with New Relic can help you:
Get your apps up and running in minutes
Gain valuable insights into performance and availability
Have complete visibility and control over your apps, while adhering to standards set by IT
Deliver a great end-user experience
Make smarter business decisions based on real data
About Apprenda
Apprenda is the leading enterprise Platform as a Service (PaaS) powering the next generation of enterprise software development in public, private and hybrid clouds. With Apprenda, enterprises can securely deliver an entire ecosystem of data, services, applications and APIs to both internal and external customers across any infrastructure.
IIA4: Open Source and the Enterprise ( Predix Transform 2016)Predix
https://predixtransform.com
Today, software innovation costs are down about 90% from past expense, mostly due to elastic infrastructure, services that we can call upon, managed APIs, and open source software. In fact, Open Source is one of the driving forces of modern application development. Learn why Open Source is also good for the Industrial IoT.
Why and How to Monitor App Performance in AzureIan Downard
This presentation provides a brief overview of APM solutions for the Azure cloud computing platform. We discuss three challenges unique to cloud computing which APM can address, and we summarize which APM techniques can be applied in IaaS, PaaS, and SaaS application architectures. To illustrate APM techniques for IaaS and PaaS we look at a variety APM offers in the Azure marketplace, including Riverbed AppInternals, Microsoft Application Insights, and New Relic. To illustrate APM techniques for SaaS, we look at how SharePoint Online can be instrumented using JavaScript injection. This presentation was prepared and delivered by Ian Downard to the Portland Azure User Group on March 28th, 2016, in Portland Oregon.
Learn how Intuit created an application-aware network performance platformRiverbed Technology
Learn how Intuit utilized Riverbed and Big Switch’s integrated solution and built a scalable application-aware network performance management platform for best-of-breed monitoring and analysis. To watch the full webinar, go here: http://rvbd.ly/1VBKl6S
TopConf : DevOps Monitoring: Feedback Loops in Enterprise EnvironmentsJonah Kowall
Enterprises do not have the benefit of starting from scratch, they must implement DevOps in an existing environment, often managing heritage investments along with fast moving projects. The monitoring tools unfortunately fall into the same category. These complex, dated, and costly monitoring tools don’t meet today’s needs in providing the visibility required for agile development that leverage continuous delivery and DevOps. Not only are the tools an issue, but the visibility and approaches are also problematic.
The use of open source tools has been the de facto approach for DevOps, but this approach comes with it’s own set of challenges in terms of managing a complex stack of tools with varying quality of support/community. The move to a metrics-driven feedback loop enables teams to act fast at any stage of the product lifecycle. We will outline common technology stacks and approaches using graphite, statsd, and collectd along with nagios, munin, and other system monitoring tools. We will also outline commercial solutions, and how these tools tend to fall into silos as well.
Monitoring must be reformed with new platforms and technologies, fitting specific design patterns which meet the needs of DevOps teams, these will be outlined and explained from a requirements perspective, providing a roadmap for how to apply these learnings inside your company. Join this session to take back an evolved approach to unified monitoring and how you can get your company to be metrics driven
Attendees of this session will walk away with a clear understanding of:
Understanding today’s tooling limitations
Open source tool sprawl issues
Fundamental patterns of monitoring
How these will be solved in the future
AppSphere 15 - Achieving Stability and End-to-End MonitoringAppDynamics
This deck outlines what needs to be built in terms of data extraction, analytics, and other open source technologies. Finally, we’ll also discuss commercial alternatives and what features and functions are critical when monitoring micro-services based applications.
Attendees of this session will walk away with a clear understanding of:
-What is changing with software, and why?
-What challenges are faced with these changes?
-How to overcome these challenges.
This deck was originally presented at AppSphere 2015.
On a Journey from Forensic Operations to 99.99 UptimeNew Relic
Blackboard is in the midst of transforming our applications and the whole company into a modern cloud company that will positively impact the future of education. Along this journey, Blackboard is revamping their toolset and processes to move away from forensic based reactionary responses to a more proactive approach with detecting and solving problems before they become incidents. Also leveraging those same tools and processes to solve incidents faster when they do occur. These new tools and approaches are helping Blackboard break down silos and adopt a DevOps culture throughout the whole organization. This talk will take you through some of the steps taken so far and what is in the plans going forward.
Examine common application performance problems hiding in plain sight. See how you can quickly remove the noise, pinpoint root cause and fix these problems once and for all. Watch the webinar replay: http://rvbd.ly/1QGxMBs
An industry-leading analyst discusses how you can take control of application performance and provide superior end-user experiences. Then, you’ll hear how a major US healthcare provider eliminated sporadic performance outages that affected its public-facing website, and prevented revenue loss and many hundreds of hours in support costs. To learn more, watch the webcast replay: http://rvbd.ly/1JGz1ke
Or to learn more about AppInternals, visit: http://rvbd.ly/1IsjC5t
The Delight and Difficulties of Universal Java Script with ReactNew Relic
Warby Parker recently launched a new responsive site built from the ground up using React, Node, and an entirely API-driven architecture. Building a "Universal JavaScript" app is a dream for front-end engineers thanks to reusable components that work on the client/server, but what are the performance, monitoring and infrastructure challenges? In this session you’ll learn about:
-Building a performant, responsive front-end
-The benefits of using React on your site
-How to monitor and alert for performance issues
Digital Mastery & Joy at Panera Bread [Webinar Replay]Dynatrace
To Watch Replay:
https://info.dynatrace.com/apm_wc_panera_na_registration.html
Panera 2.0 is now reality as a result of their digital transformation. All 2000+ Panera Bread stores across the US and Canada now support mobile orders and in-store kiosks, but it was not an easy journey. It took a cross functional team of experts to kickoff, and now it has been rolled out company wide. Customers are now leveraging all digital channels from mobile to web, and in the restaurants.
In this on-demand webinar, Prashanth Karre, Director, Performance Engineering, at Panera and Klaus Enzenhofer, Director Technology Strategy, at Dynatrace discuss:
What we can learn from Panera Bread's successful digital transformation
Why data silos are such a big issue and how to overcome them
How Dynatrace data is used by executives, IT operations, mobile developers, performance engineering, and others business groups
Panera strives to be digital masters and deliver joyful digital experiences to their customers (and delicious food too!). Watch to gain insights into how they successfully achieved their goal.
Given the changing nature of enterprise networking, Riverbed decided to survey attendees of the recent VMworld conference about their companies’ current plans for these emerging technologies. Riverbed surveyed 260 attendees face-to-face, from a variety of roles and with a median company size of 2,300 employees.
Building a System That Never Stops New Relic at ScaleNew Relic
In a typical day, New Relic receives half a trillion data points from our customers. All of these need to be processed, stored and made available for charts, queries and alerts as soon as possible. Getting from humble roots to querying more than a billion events a second has meant radically reinventing and re-architecting the whole platform multiple times.
In this session, Matthew Flaming and Nic Benders from New Relic will take you on a deep dive into some of the lessons we've learned along the way and where we go from here. They'll touch on designing scalable services, optimizing for predictability, creating software architecture through team structure, and what it takes to (continuously) rebuild a system that can never stop.
Reducing Cost and Complexity Managing Mission-Critical SAP® and Non-SAP JobsCA Technologies
Join this session and hear how simplicity and powerful integration capabilities of CA Workload Automation (CA WA) and SAP Solution Manager are implemented at one of our client accounts. Learn the advantages of CA Workload Automation Advanced Integration for SAP Solution Manager and how it will give the ability for SAP users to run SAP and non-SAP jobs from within the SAP Solution Manager interface. Also in the session, we’ll talk about CA Workload Automation Advanced Integration for SAP Business Warehouse that can help SAP administrators visualize and manage dependencies between SAP Business Warehouse and CA Workload Automation jobs from a central location—automatically triggering jobs at the right time to better support parallel processing.
For more information, please visit http://cainc.to/Nv2VOe
Riverbed Performance Management solutions provide IT with the visibility and actionable insight to help deliver the application performance that users and business demand.
Reactive to Proactive: Intelligent Troubleshooting and Monitoring with SplunkSplunk
ITOA user-beginner Splunk Admin-new to Splunk
Description: If you’re just getting started with Splunk, this session will help you understand how to use Splunk software to turn your silos of data into insights that are actionable. In this session, we’ll dive right into a Splunk environment and show you how to use the simple Splunk search interface to quickly find the needle-in-the-haystack or multiple needles in multiple haystacks. We’ll demonstrate how to perform rapid ad hoc searches to conduct routine investigations across your entire IT infrastructure in one place, whether physical, virtual or in the cloud. We’ll show you how to then convert these searches into real-time alerts and dashboards, so you can proactively monitor for problems before they impact your end user. We’ll also demonstrate how you can use Splunk to connect the dots across heterogeneous systems in your environment for cross-tier, cross-silo visibility.
You’ll have access to a demo environment. So, don’t forget to bring your laptop and follow along for a hands-on experience.
SplunkLive! London 2017 - Building an Analytics Driven Security Operation Cen...Splunk
Traditional security operations centres (SOCs) often focus too narrowly on alert triage or on meeting simplistic checkbox compliance requirements. This approach can leave the organisation with critical cybersecurity blind spots, and lead to other common problems including low SOC productivity, high analyst turnover, and increased operational costs. Ultimately, this traditional approach to running a SOC can cause the security team to fail to achieve its mission of detecting, responding to, and mitigating true threats in the environment. This session will cover how to build a modern analytics-driven security operations capability for your organisation. The analytics-driven SOC leverages technology innovations to serve human analysts by fusing advanced analytics, threat intelligence, automated response/orchestration, threat hunting, deep investigation, and incident response. This approach helps the security team to consistently deliver fast, effective threat detection and response.
SplunkLive! London 2017 - How to Earn a Seat and the Business Table with SplunkSplunk
Machine data holds the critical insights to drive business decisions. In this session, learn about the tools, the important people to engage, the process and tips and tricks of how Splunk customers have taken Splunk from addressing IT challenges to transforming their organisations and delivering business value.
SplunkLive! London 2017 - Using Machine Learning to Feed Hungry PeopleSplunk
There is often too much data to be able to understand it all by hand, and often it is difficult to see the interesting trees in the forest of data. Machine learning gives us an opportunity to get computers to do this heavy lifting, and present us with key actions for operations. Machine learning has many applications across a wide variety of fields – here we demonstrate hands on with donuts how you can use Machine Learning to see deviations from expected donut consumption and either make more donuts or send out a targeted marketing campaign to get donuts off the shelves and into happy customers.
Splunk for Enterprise Security featuring User Behavior AnalyticsSplunk
This session will review Splunk’s two premium solutions - Splunk Enterprise Security (ES) is Splunk's award-winning security intelligence solution that brings immediate value for continuous monitoring across SOC and incident response environments. Splunk UBA is a new technology that applies unsupervised machine learning and data science to solving one of the biggest problems in information security today: insider threat. You’ll learn how Splunk UBA works in tandem with ES, or third-party data sources, to bring significant automated analytical power to your SOC and Incident Response teams.
Rage WITH the machine, not against it: Machine learning for Event ManagementSplunk
Simplify service operations and improve reliability of events with machine learning and analytics
Your data centre creates a lot of events — from low-level disk warnings to critical network issues and even service-level failures. With so many events and false positives, how do you know which events are important and which ones to ‘throw away’? Your current rules-based tools don’t work they are inflexible, cannot handle event volumes from today’s transient infrastructures and do not provide actionable alerts that help you fix the important problems first.
Join this webinar to learn how Splunk IT Service Intelligence employs the power of machine learning to provide actionable human scale alerts with service context in an integrated solution, enabling IT teams to focus on fixing what’s broken quickly and easily. Learn how you can rapidly apply machine learning to:
- Catch anomalous behavior to detect events before they become critical incidents
- Avoid having to create manual rules and set adapt thresholds dynamically
- Automatically correlate data to generate highly qualified information, so you can take fast action
- Prioritize and speed up investigation on the most important incidents with service context
This session discusses how to maximize the performance of an application deployment with tools that are native to the server platform, as well as cross-platform Java analysis and monitoring tools include IBM Health Center and IBM Service Engage. The session begins with systematic steps organizations can take to locate a performance problem in a complex system and moves on to analysis they can do to understand the root cause of the problem. The picture is completed by consideration of the tools and techniques available to monitor application performance in normal operation so that organizations can catch performance issues before they build up into serious problems.
Anders Iderström, Engineering Manager for Live Operations and Observability, recently gave a presentation at Load Up 2016 in New York, entitled "Aiming for four nines with Apica Synthetic". Anders talked about how we monitor and keep business critical systems up and running here at Klarna, as well as how we handle incidents while minimising the impact on our end users.
De-Mystifying Capacity Management in the Digital WorldPrecisely
Capacity management is an integral function of organizations running medium to enterprise multi-domain complex IT environments. Over the years, the shift from physical to virtual, to Cloud and now to DevOps/Microservices, has inevitably changed the perception of capacity management and whether it is still needed today.
View this webinar on-demand to learn why it’s necessary to invest in a toolset that underpins your capacity management process and why Syncsort’s Athene™ should be your tool of choice for delivering business and service assurance while controlling costs and meeting SLAs. We also explore key topics such as:
• What is capacity management
• How capacity management has evolved and why it’s as important for the Cloud
• How capacity management can encompass but differ from real-time monitoring
• Why we still need a mature capacity management process in place that should co-exist with your load and performance testing activities
• What benefits can be realized from implementing and maturing a capacity management process
Webinar - Order out of Chaos: Avoiding the Migration MigrainePeak Hosting
When your business has outgrown your current managed hosting provider, the logical thing is to search for something better. Change can be difficult and chaotic, but it doesn’t have to be.
This webinar focuses on best practices for making your migration from the cloud as pain free as possible, including a discussion on what you need to know and ask of your migration provider to ensure it goes smoothly. As an example of this, we will outline Peak Hosting’s migration process, as well as discuss one of our customer migrations and why they chose to undertake it.
PAD-3126 - Evolving the DevOps Organization around IBM PureApplication System...Hendrik van Run
Within the Dutch Tax and Customs Administration (DTCA), IBM PureApplication System is a strategic platform alongside z Systems and Linux on x86-64. We have been working with PureApplication for over three years and have over 1,000 cores installed. We run a wide range of IBM software, including WebSphere, DB2, BPM, IBM Connections, MQ and WebSphere Portal. Making PureApplication a success required us to grow our team from three to over 25 people. But perhaps even more importantly, we have made fundamental changes to the way we work within our organization. We have transitioned from siloed teams to a DevOps team that aligns with the PureApplication platform. The DevOps team now owns the overall responsibility for the solutions.
Splunk conf2014 - Dashboard Fun - Creating an Interactive Transaction ProfilerSplunk
Using Simple XML and Splunk Enterprise, learn how to create easy interactive dashboards to explore data. This demo showcases great tools to put ion the hands of Splunk users, help desk users and IT Operations staff.
How Capgemini Built a Pan-European Tax Messaging System Using Oracle Fusion M...Capgemini
Capgemini discusses the architecture for a system built on Oracle Fusion Middleware for the UK tax agency to manage processes spanning international user groups and an array of enterprise systems.
In this presentation, learn how Oracle Business Process Management 12c and Oracle SOA Suite 12c solutions help consolidate role-based workflow, systems integration, decision logic, large-batch processing, and real-time messaging into simple-to-manage composite services deployed using a continuous build system.
Learn how Oracle Application Development Framework, Java, and Oracle Database are used to provide custom presentation and data services, and listen to the speaker’s experiences working with Oracle JDeveloper and the wider development platform.
First presented at Oracle OpenWorld 2015.
http://www.capgemini.com/oracle
Webinar: Kanban or Scrum – Is Scrum for developers and Kanban for IT support?Intland Software GmbH
Watch this webinar recording to learn about the fundamentals of the two most popular Agile approaches: Scrum and Kanban. The webinar explains why, how and when these are best used, and the benefits commonly associated with their use. The video also talks about Scrumban, the approach combining the benefits of Scrum and Kanban, and discusses how you could benefit from using Scrumban in your organization. As usual, a live demonstration then shows how codeBeamer supports all Agile processes.
http://intland.com/webinar/2015-03/kanban-or-scrum-is-scrum-for-developers-and-kanban-for-it-support-4/
.conf Go 2023 - Das passende Rezept für die digitale (Security) Revolution zu...Splunk
.conf Go 2023 presentation:
"Das passende Rezept für die digitale (Security) Revolution zur Telematik Infrastruktur 2.0 im Gesundheitswesen?"
Speaker: Stefan Stein -
Teamleiter CERT | gematik GmbH M.Eng. IT-Sicherheit & Forensik,
doctorate student at TH Brandenburg & Universität Dresden
.conf Go 2023 presentation:
De NOC a CSIRT
Speakers:
Daniel Reina - Country Head of Security Cellnex (España) & Global SOC Manager Cellnex
Samuel Noval - Global CSIRT Team Leader, Cellnex
Splunk - BMW connects business and IT with data driven operations SRE and O11ySplunk
BMW is defining the next level of mobility - digital interactions and technology are the backbone to continued success with its customers. Discover how an IT team is tackling the journey of business transformation at scale whilst maintaining (and showing the importance of) business and IT service availability. Learn how BMW introduced frameworks to connect business and IT, using real-time data to mitigate customer impact, as Michael and Mark share their experience in building operations for a resilient future.
Data foundations building success, at city scale – Imperial College LondonSplunk
Universities have more in common with modern cities than traditional places of learning. This mini city needs to empower its citizens to thrive and achieve their ambitions. Operationalising data is key to building critical services; from understanding complex IT estates for smarter decision-making to robust security and a more reliable, resilient student experience. Juan will share his experience in building data foundations for a resilient future whilst enabling digital transformation at Imperial College London.
Splunk: How Vodafone established Operational Analytics in a Hybrid Environmen...Splunk
Learn how Vodafone has provided end-to-end visibility across services by building an Operational Analytics Platform. In this session, you will hear how Stefan and his team manage legacy, on premise, hybrid and public cloud services, and how they are providing a platform for complex triage and debugging to tackle use cases across Vodafone’s extensive ecosystem.
.italo operates an Essential Service by connecting more than 100 million people annually across Italy with its super fast and secure railway. And CISO Enrico Maresca has been on a whirlwind journey of his own.
Formerly a Cyber Security Engineer, Enrico started at .italo as an IT Security Manager. One year later, he was promoted to CISO and tasked with building out – and significantly increasing the maturity level – of the SOC. The result was a huge step forward for .italo.
So how did he successfully achieve this ambitious ask? Join Enrico as he reveals the key insights and lessons learned in his SOC journey, including:
Top challenges faced in improving security posture
Key KPIs implemented in order to measure success
Strategies and approaches applied in the SOC
How MITRE ATT&CK and Splunk Enterprise Security were utilised
Next steps in their maturity journey ahead
Observability Concepts EVERY Developer Should Know -- DeveloperWeek Europe.pdfPaige Cruz
Monitoring and observability aren’t traditionally found in software curriculums and many of us cobble this knowledge together from whatever vendor or ecosystem we were first introduced to and whatever is a part of your current company’s observability stack.
While the dev and ops silo continues to crumble….many organizations still relegate monitoring & observability as the purview of ops, infra and SRE teams. This is a mistake - achieving a highly observable system requires collaboration up and down the stack.
I, a former op, would like to extend an invitation to all application developers to join the observability party will share these foundational concepts to build on:
Climate Impact of Software Testing at Nordic Testing DaysKari Kakkonen
My slides at Nordic Testing Days 6.6.2024
Climate impact / sustainability of software testing discussed on the talk. ICT and testing must carry their part of global responsibility to help with the climat warming. We can minimize the carbon footprint but we can also have a carbon handprint, a positive impact on the climate. Quality characteristics can be added with sustainability, and then measured continuously. Test environments can be used less, and in smaller scale and on demand. Test techniques can be used in optimizing or minimizing number of tests. Test automation can be used to speed up testing.
Generative AI Deep Dive: Advancing from Proof of Concept to ProductionAggregage
Join Maher Hanafi, VP of Engineering at Betterworks, in this new session where he'll share a practical framework to transform Gen AI prototypes into impactful products! He'll delve into the complexities of data collection and management, model selection and optimization, and ensuring security, scalability, and responsible use.
Securing your Kubernetes cluster_ a step-by-step guide to success !KatiaHIMEUR1
Today, after several years of existence, an extremely active community and an ultra-dynamic ecosystem, Kubernetes has established itself as the de facto standard in container orchestration. Thanks to a wide range of managed services, it has never been so easy to set up a ready-to-use Kubernetes cluster.
However, this ease of use means that the subject of security in Kubernetes is often left for later, or even neglected. This exposes companies to significant risks.
In this talk, I'll show you step-by-step how to secure your Kubernetes cluster for greater peace of mind and reliability.
Epistemic Interaction - tuning interfaces to provide information for AI supportAlan Dix
Paper presented at SYNERGY workshop at AVI 2024, Genoa, Italy. 3rd June 2024
https://alandix.com/academic/papers/synergy2024-epistemic/
As machine learning integrates deeper into human-computer interactions, the concept of epistemic interaction emerges, aiming to refine these interactions to enhance system adaptability. This approach encourages minor, intentional adjustments in user behaviour to enrich the data available for system learning. This paper introduces epistemic interaction within the context of human-system communication, illustrating how deliberate interaction design can improve system understanding and adaptation. Through concrete examples, we demonstrate the potential of epistemic interaction to significantly advance human-computer interaction by leveraging intuitive human communication strategies to inform system design and functionality, offering a novel pathway for enriching user-system engagements.
A tale of scale & speed: How the US Navy is enabling software delivery from l...sonjaschweigert1
Rapid and secure feature delivery is a goal across every application team and every branch of the DoD. The Navy’s DevSecOps platform, Party Barge, has achieved:
- Reduction in onboarding time from 5 weeks to 1 day
- Improved developer experience and productivity through actionable findings and reduction of false positives
- Maintenance of superior security standards and inherent policy enforcement with Authorization to Operate (ATO)
Development teams can ship efficiently and ensure applications are cyber ready for Navy Authorizing Officials (AOs). In this webinar, Sigma Defense and Anchore will give attendees a look behind the scenes and demo secure pipeline automation and security artifacts that speed up application ATO and time to production.
We will cover:
- How to remove silos in DevSecOps
- How to build efficient development pipeline roles and component templates
- How to deliver security artifacts that matter for ATO’s (SBOMs, vulnerability reports, and policy evidence)
- How to streamline operations with automated policy checks on container images
Communications Mining Series - Zero to Hero - Session 1DianaGray10
This session provides introduction to UiPath Communication Mining, importance and platform overview. You will acquire a good understand of the phases in Communication Mining as we go over the platform with you. Topics covered:
• Communication Mining Overview
• Why is it important?
• How can it help today’s business and the benefits
• Phases in Communication Mining
• Demo on Platform overview
• Q/A
In his public lecture, Christian Timmerer provides insights into the fascinating history of video streaming, starting from its humble beginnings before YouTube to the groundbreaking technologies that now dominate platforms like Netflix and ORF ON. Timmerer also presents provocative contributions of his own that have significantly influenced the industry. He concludes by looking at future challenges and invites the audience to join in a discussion.
Transcript: Selling digital books in 2024: Insights from industry leaders - T...BookNet Canada
The publishing industry has been selling digital audiobooks and ebooks for over a decade and has found its groove. What’s changed? What has stayed the same? Where do we go from here? Join a group of leading sales peers from across the industry for a conversation about the lessons learned since the popularization of digital books, best practices, digital book supply chain management, and more.
Link to video recording: https://bnctechforum.ca/sessions/selling-digital-books-in-2024-insights-from-industry-leaders/
Presented by BookNet Canada on May 28, 2024, with support from the Department of Canadian Heritage.
Dr. Sean Tan, Head of Data Science, Changi Airport Group
Discover how Changi Airport Group (CAG) leverages graph technologies and generative AI to revolutionize their search capabilities. This session delves into the unique search needs of CAG’s diverse passengers and customers, showcasing how graph data structures enhance the accuracy and relevance of AI-generated search results, mitigating the risk of “hallucinations” and improving the overall customer journey.
The Art of the Pitch: WordPress Relationships and SalesLaura Byrne
Clients don’t know what they don’t know. What web solutions are right for them? How does WordPress come into the picture? How do you make sure you understand scope and timeline? What do you do if sometime changes?
All these questions and more will be explored as we talk about matching clients’ needs with what your agency offers without pulling teeth or pulling your hair out. Practical tips, and strategies for successful relationship building that leads to closing the deal.
LF Energy Webinar: Electrical Grid Modelling and Simulation Through PowSyBl -...DanBrown980551
Do you want to learn how to model and simulate an electrical network from scratch in under an hour?
Then welcome to this PowSyBl workshop, hosted by Rte, the French Transmission System Operator (TSO)!
During the webinar, you will discover the PowSyBl ecosystem as well as handle and study an electrical network through an interactive Python notebook.
PowSyBl is an open source project hosted by LF Energy, which offers a comprehensive set of features for electrical grid modelling and simulation. Among other advanced features, PowSyBl provides:
- A fully editable and extendable library for grid component modelling;
- Visualization tools to display your network;
- Grid simulation tools, such as power flows, security analyses (with or without remedial actions) and sensitivity analyses;
The framework is mostly written in Java, with a Python binding so that Python developers can access PowSyBl functionalities as well.
What you will learn during the webinar:
- For beginners: discover PowSyBl's functionalities through a quick general presentation and the notebook, without needing any expert coding skills;
- For advanced developers: master the skills to efficiently apply PowSyBl functionalities to your real-world scenarios.
2. 2
Page:
2
Agenda
! Sco9abank
–
Background
! My
Department
–
PCM
–
What
do
We
Do
! Why
Did
We
Introduce
Splunk
! Where
do
we
u9lize
Splunk
! Future
uses
of
Splunk
! Final
Comments
3. 3
Page:
3
3
Sco9abank
-‐
What
we
offer
-‐
Our
Goal
• Sco9abank
is
one
of
North
America’s
premier
financial
ins9tu9ons,
and
Canada’s
most
interna9onal
bank
and
conduct
business
in
over
55
countries.
• Sco9abank
and
its
affiliates
offer
a
broad
range
of
products
and
services,
including
retail,
commercial,
corporate
and
investment
banking
to
more
than
21
million
customers
around
the
world
• Our
goal
is
to
be
the
best
Canadian-‐based
interna9onal
financial
services
company
• Strategic
focus
–
diversifica9on,
by
both
geography
and
business,
4. 4
Page:
4
Sco9abank
-‐
Canada’s
most
interna9onal
bank
4
5. 5
Page:
5
My
Background
and
Role
! My
Role
–
Director
of
PCM
(Performance
&
Capacity
Management)
! Some
of
my
key
accountabili9es:
– Manage
applica9on
performance
and
availability
across
cri9cal
bank
plaorms
– Mainframe
Applica9on
Performance
Focus
and
Resource
Usage
– Mainframe
Chargeback
Repor9ng
and
Process
– Historical
Trending
and
Analysis
of
Key
Applica9on
Performance
! Our
Department
has
deployed
and
manages
the
following
key
technologies
– Splunk
– Dell
Quest
Applica9on
Performance
Management
Tools
– SAS
Analy9cs
! We
have
a
team
of
7
doing
the
above
work
! I
have
been
working
at
Sco9abank
for
41
years
6. 6
Page:
6
The
Good
Old
Days
–
When
I
started
in
IT!
A
Punch
Card
For
Computer
Input
IBM
Card
Reader
7. 7
Page:
7
Why
Did
PCM
Deploy
Splunk?
• Reduce
MTTR
(Mean
Time
To
ResoluCon)
– Improve
Applica9on
Availability
• Reduce
ApplicaCon
Coding
Issues
Recovery
Time
– Improve
Developer
produc9vity
and
reduce
costs
in
correc9ng
problems.
• OperaConal
Intelligence
– Developed
custom
monitoring
for
technologies
which
did
not
have
robust
monitoring
solu9ons:
ê DataPower
is
an
example
– Enhance
Opera9onal
view
of
Business
&
Opera9onal
Metrics
ê Improve
trending
of
System
and
Applica9on
errors
8. Splunk
Helps
Reduce
MTTR
MTTI – Mean Time To Identify => problem or degradation
MTTK – Mean Time To Know => root cause established
MTTF – Mean Time To Fix => create fix or bypass to incident & implement
MTTV – Mean Time To Verify => confirm service restored successfully
Splunk
Console
16. Splunk
Repor9ng
of
Commercial
Internet
Ac9ve
Users
On
Feb.
20
at
08:40
am
EST.
Splunk
Integrated
with
Google
Maps
17. 17
Page:
17
Aler9ng:
Sample
Alerts
OpenSSO
Errors
and
Degraded
Response
Time
Investment
PlaPorm
ApplicaCon
Failed
IniCalizaCon
HR
Web
(HORIZON)
ApplicaCon
Cannot
connect
to
HR
Database
Intralink
IMSConnect
TransacCon
Failures
(idenCfies
IMS
issues)
18. Wire
Payment
Volumes
Incoming
FTP
ConnecCon
Counts
Real
Time
View
of
Business
Volumes
Account
Transfer
Volumes
19. 19
Page:
19
Splunk
For
IBM
DataPower
Devices
• IBM
WebSphere
DataPower
Integra9on
Appliance
is
a
non-‐disrup9ve
network
device
that
provides
common
message
transforma9on,
integra9on
and
rou9ng
func9ons
on
a
single
plaorm.
Bank
implemented
this
hardware
to
eliminate
obsolete
SNA
protocol
and
simplify
communica9on
protocols
between
MVS
Host
IMS
and
mid-‐9er
plaorms
at
the
Bank.
• PCM
developed
a
comprehensive
monitoring
solu9on
using
Splunk
to
monitor
both
the
physical
appliance
and
the
applica9ons
services
as
IBM
does
not
provide
an
out
of
the
box
monitoring
solu9on.
21. Current
Projects-‐
Applica9on
Health
Check
Solu9on
with
Dawn
InfoTek
AQA
Health
Check
AQA Health Check Application
easyNotification add-on
Logs
easyNoCficaCon
Pager
Email
Voice
SMS
Mobile
Applica9on
ApplicaCons
Web
Web
Services
•
Synthe9c
Transac9ons
•
Specific
JVMs
Dev
PCM
Manager
Opera9on
22. Current
Projects
-‐
Building
a
DB2
on
AS400
Monitoring
Solu9on
With
Datavail
RPG/SQL
Flat
File
Metrics
Indexed
>>>
FTP
>>>
AS400
Metrics
to
Splunk
25. Splunk
has
Become
our
Swiss
Army
Knife
For
Building
Cri9cal
Monitoring
Solu9ons
• We
have
yet
to
find
a
situaCon
where
we
could
not
address
a
monitoring
gap
with
Splunk.
• You
can’t
manage
what
you
don’t
measure!
Catch
LDAP
update
errors
Report
on
Workflow
Queue
Depth
trends
Alert
When
FTP
Service
Goes
Down
Report
on
ETL
Errors
For
Finance
Alert
on
AcCve
Directory
Signon
Failures
JVM
Health
Check
iWay
Batch
Performance
Monitoring
Consolidated
Dashboard
For
Sr
Management