Download as PDF, PPTX


![Dealing with SAS Dates - Notes
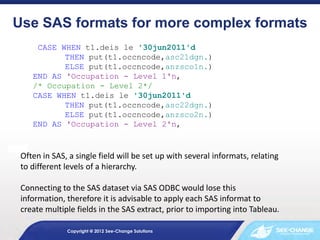
If you're going to work with a date as a string type it's better to use ISO-8601 format of
YYYY-MM-DD. This is locale insensitive so you don't need to worry about
DD/MM/YYYY vs. MM/DD/YYYY. Your formula would then read:
DATE(LEFT([Period],4)
+ “-“ + MID([Period],5,2)
+ “-“ + RIGHT([Period],2))
This is an improvement, but string logic is much slower than numeric logic, so it would
be even better to work with this as numbers. Convert the [Period] field to be a number
instead of a string, then use the following:
DATEADD(‘DAY’, [YYYYMMDD]%100-1,
DATEADD(‘MONTH’, INT(([YYYYMMDD]%10000)/100)-1,
DATEADD(‘YEAR’, INT([YYYYMMDD]/10000)-1900, #1900-01-01#)))
Note that the performance gains can be remarkable with large data sets. In a test
conducted over a 1 billion record sample, the first calculation took over 4 hours to
complete, while the second took about a minute.
Copyright @ 2012 See-Change Solutions](https://image.slidesharecdn.com/see-change-sastableauintegration-131120013027-phpapp01/85/SAS-Tableau-integration-12-320.jpg)
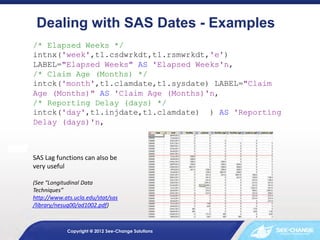


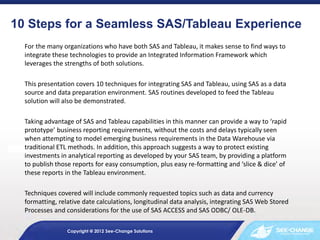
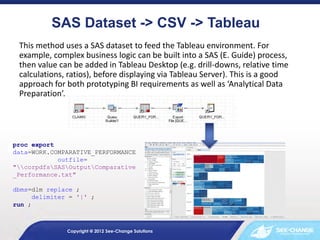
The document outlines 10 techniques for integrating SAS and Tableau to create a cohesive data reporting environment, enabling organizations to leverage both tools effectively. It covers methods for utilizing SAS as a data source and data preparation platform, thereby facilitating rapid prototyping of business reports and protecting existing analytical investments. Key topics include data and currency formatting, using SAS web stored processes, and ensuring proper data connections through ODBC/OLE-DB.