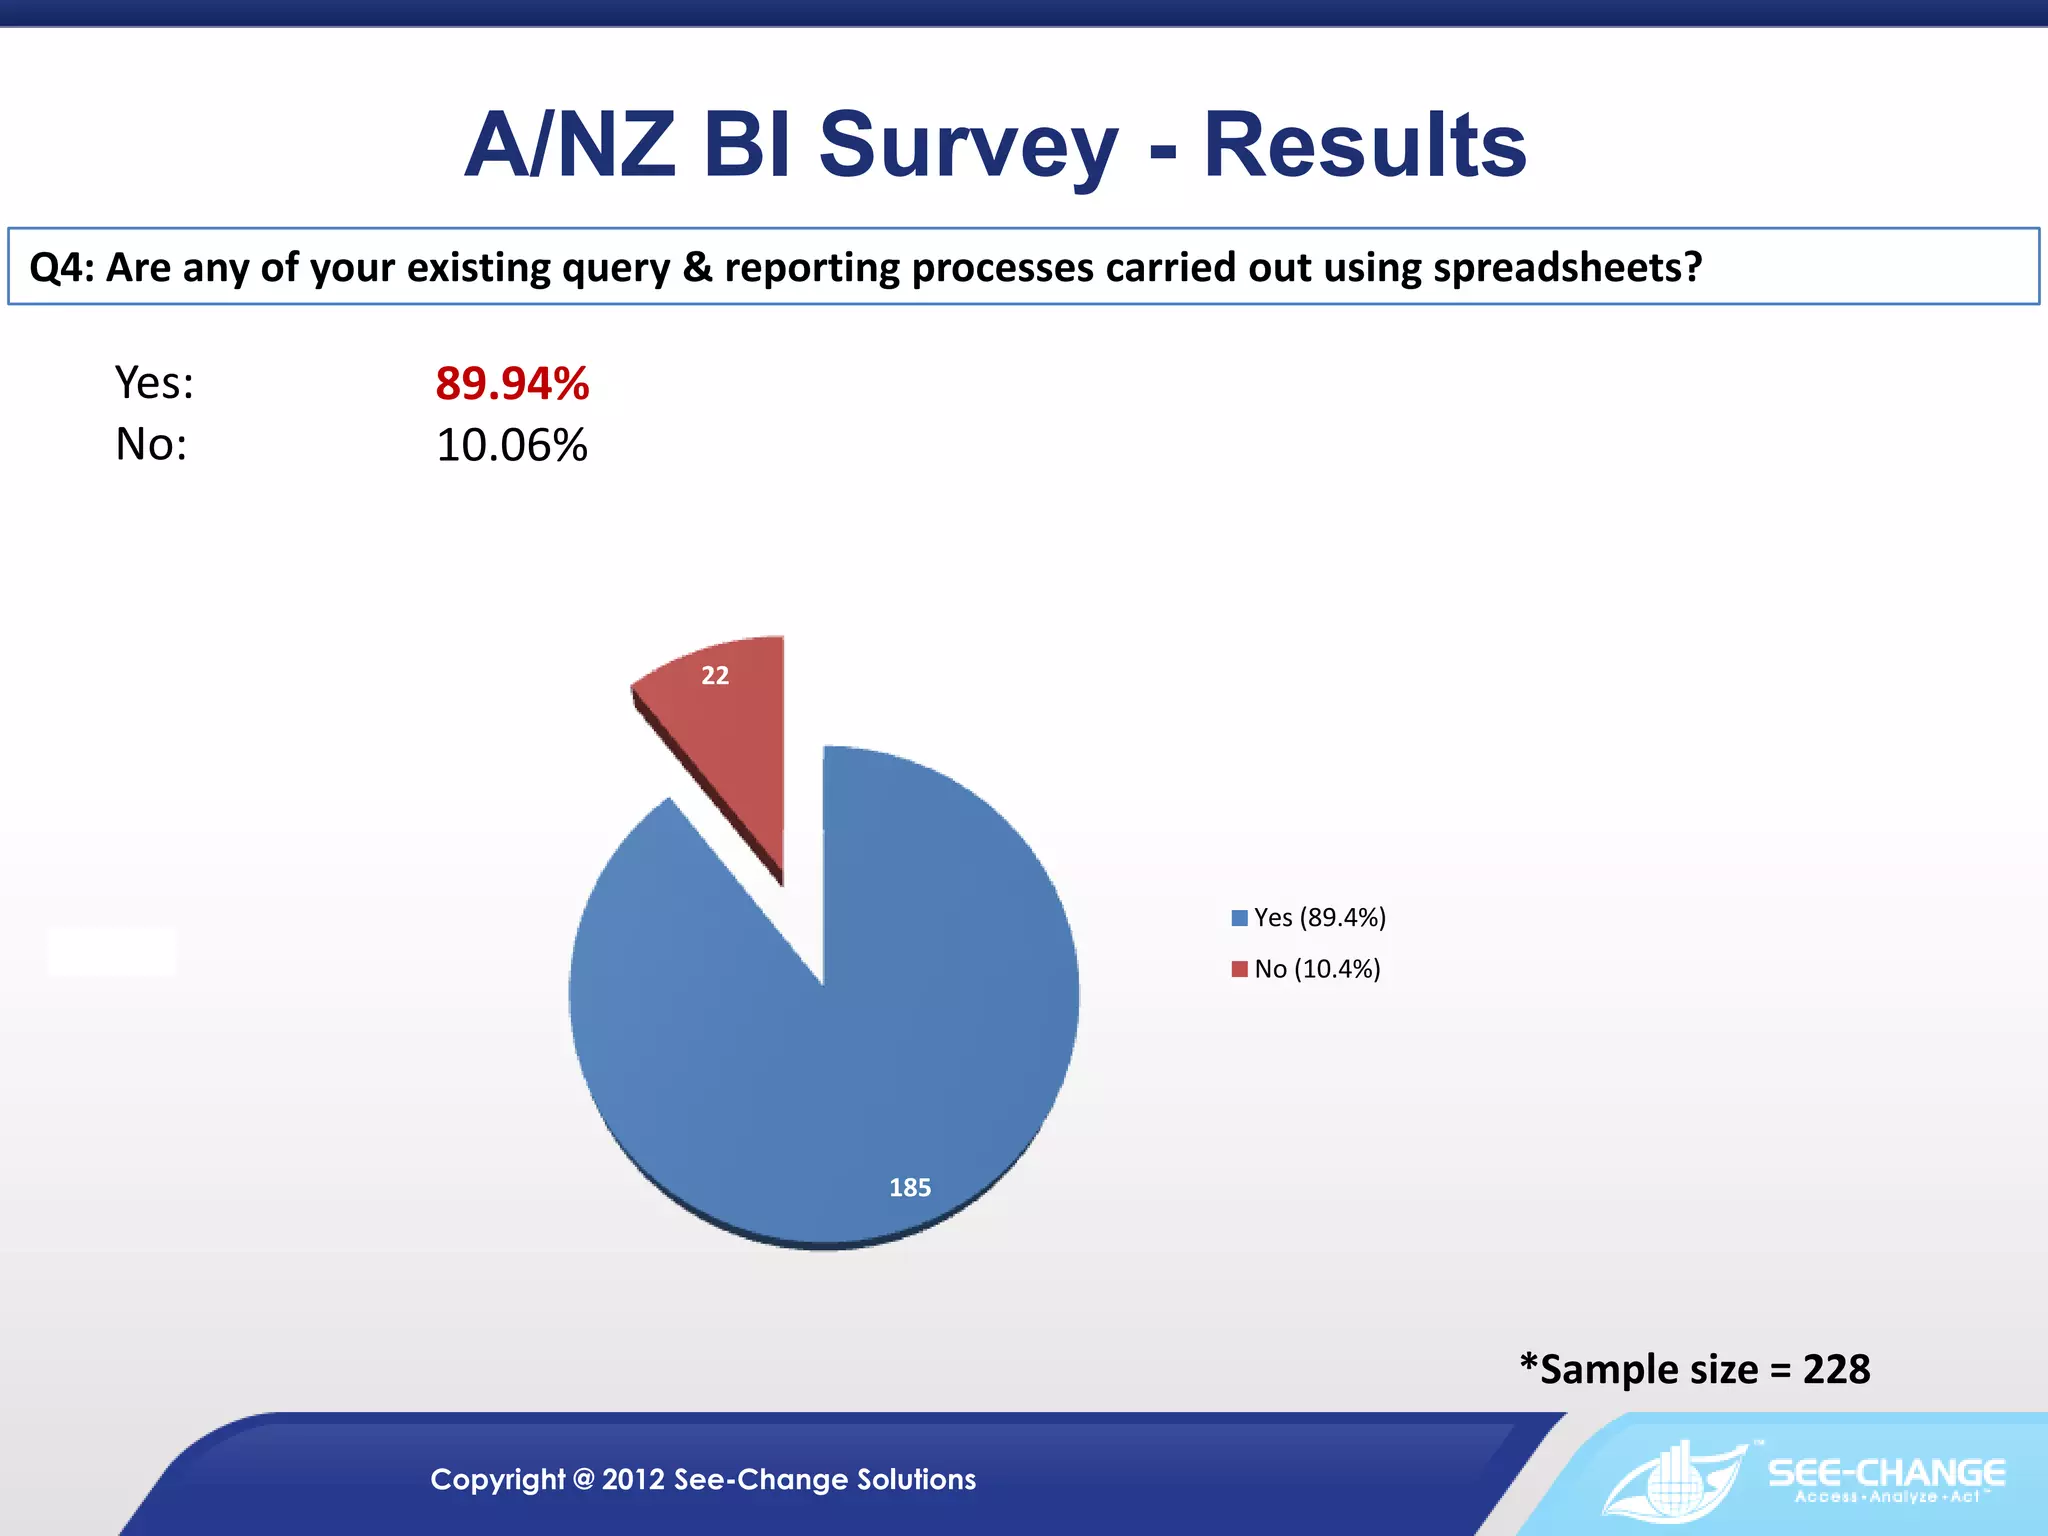
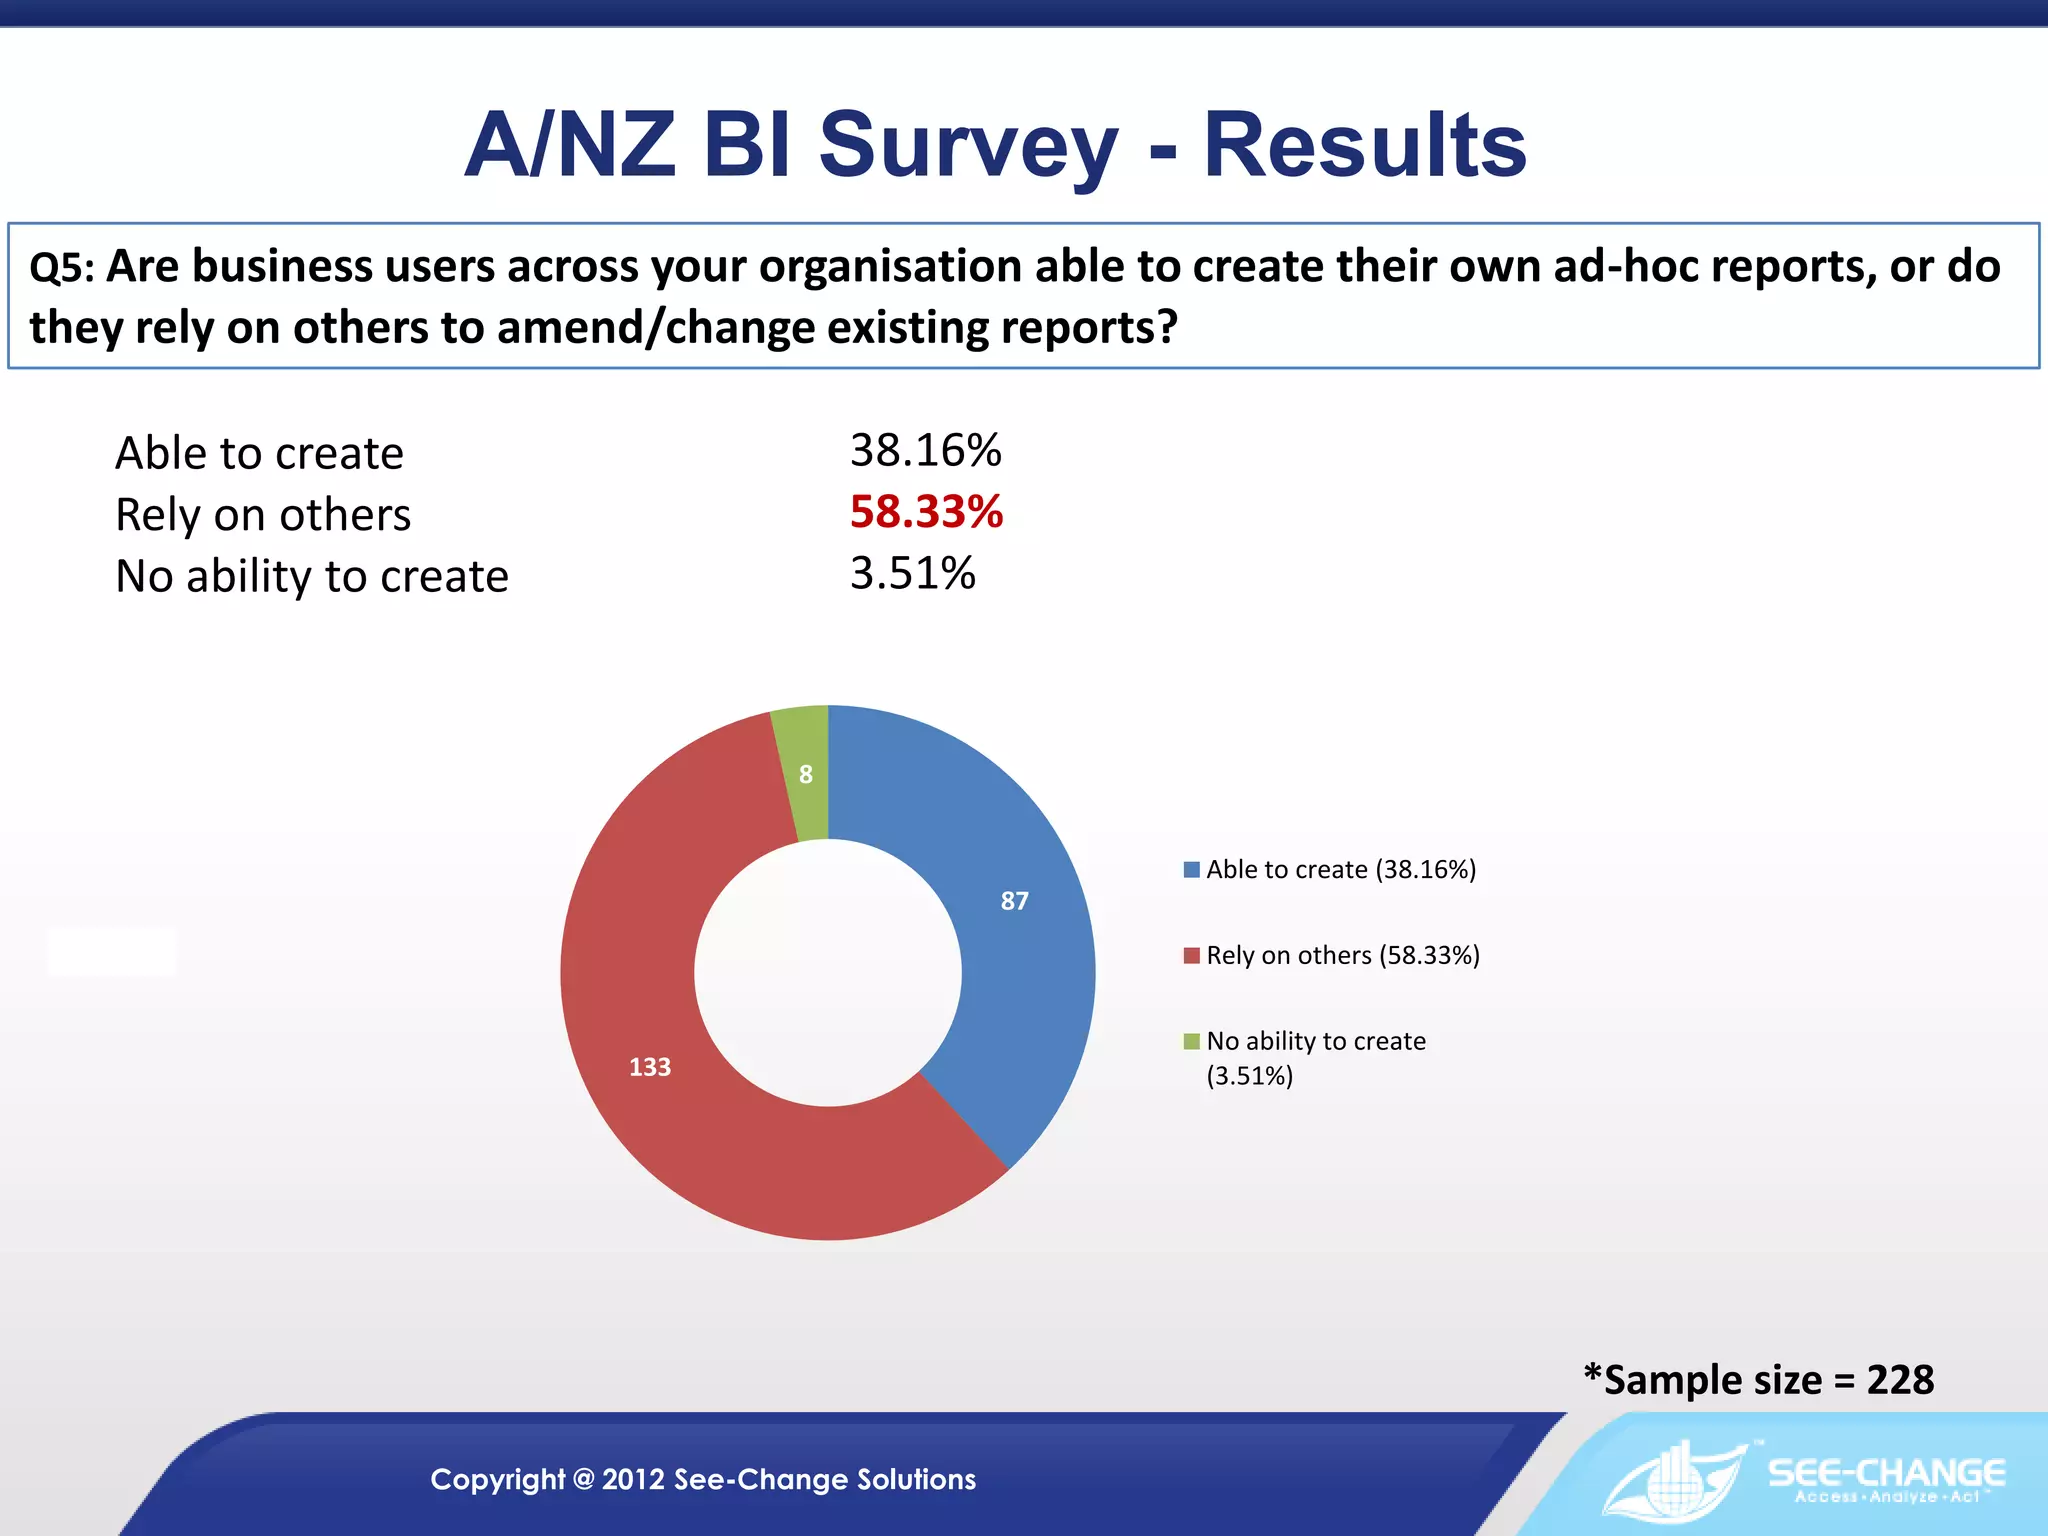
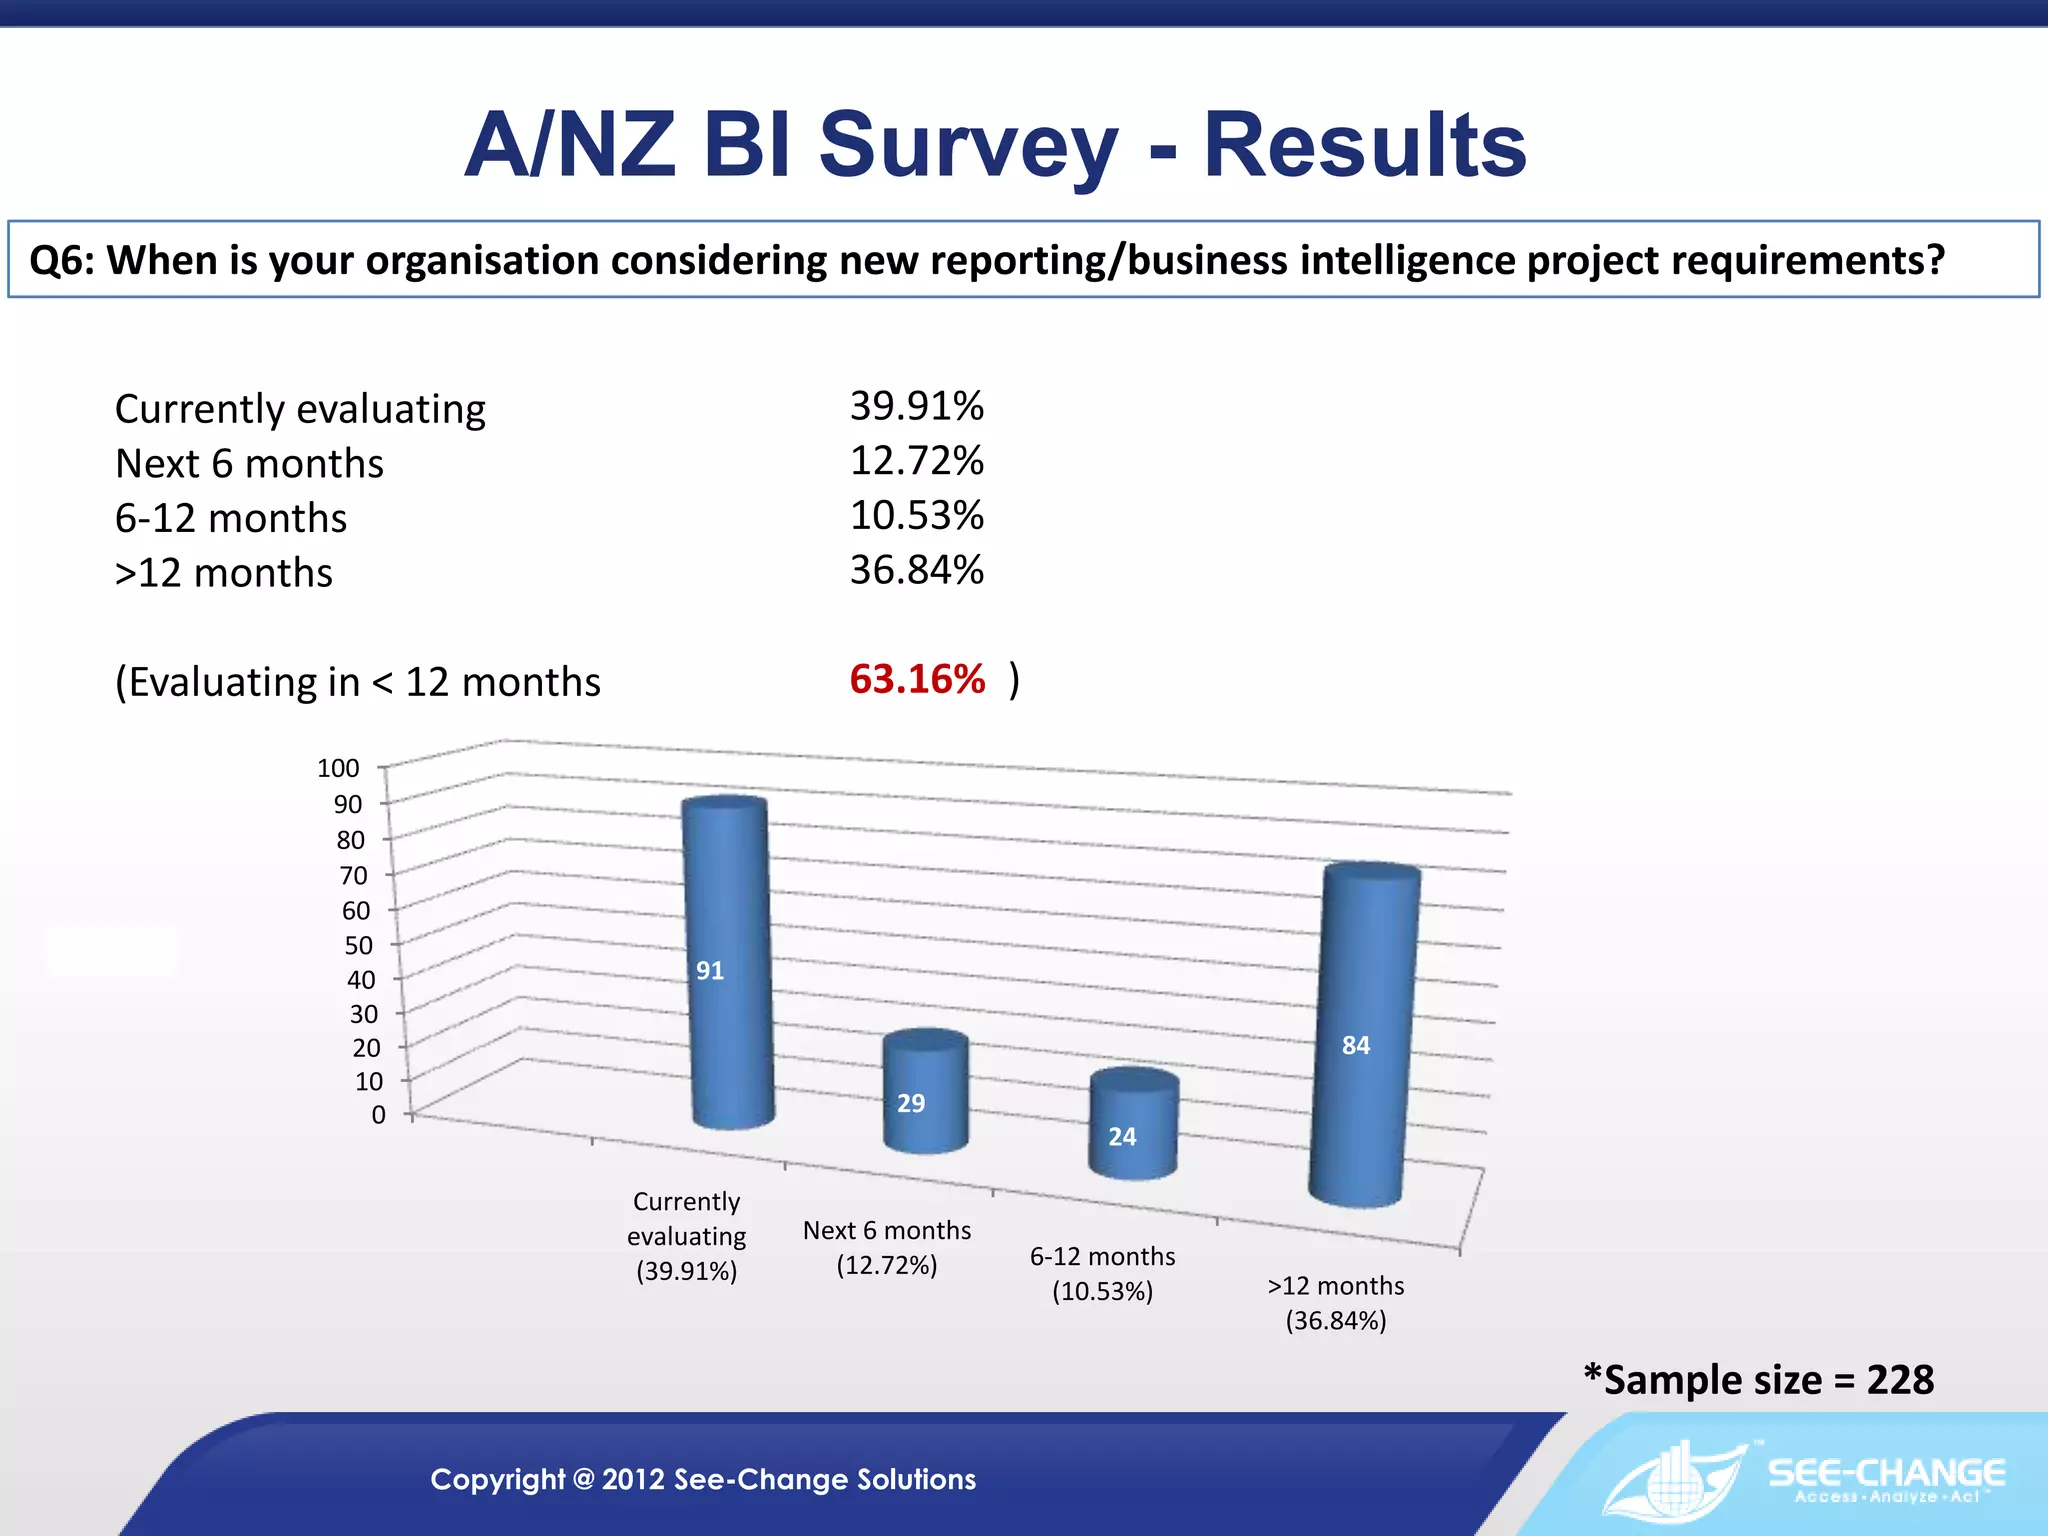
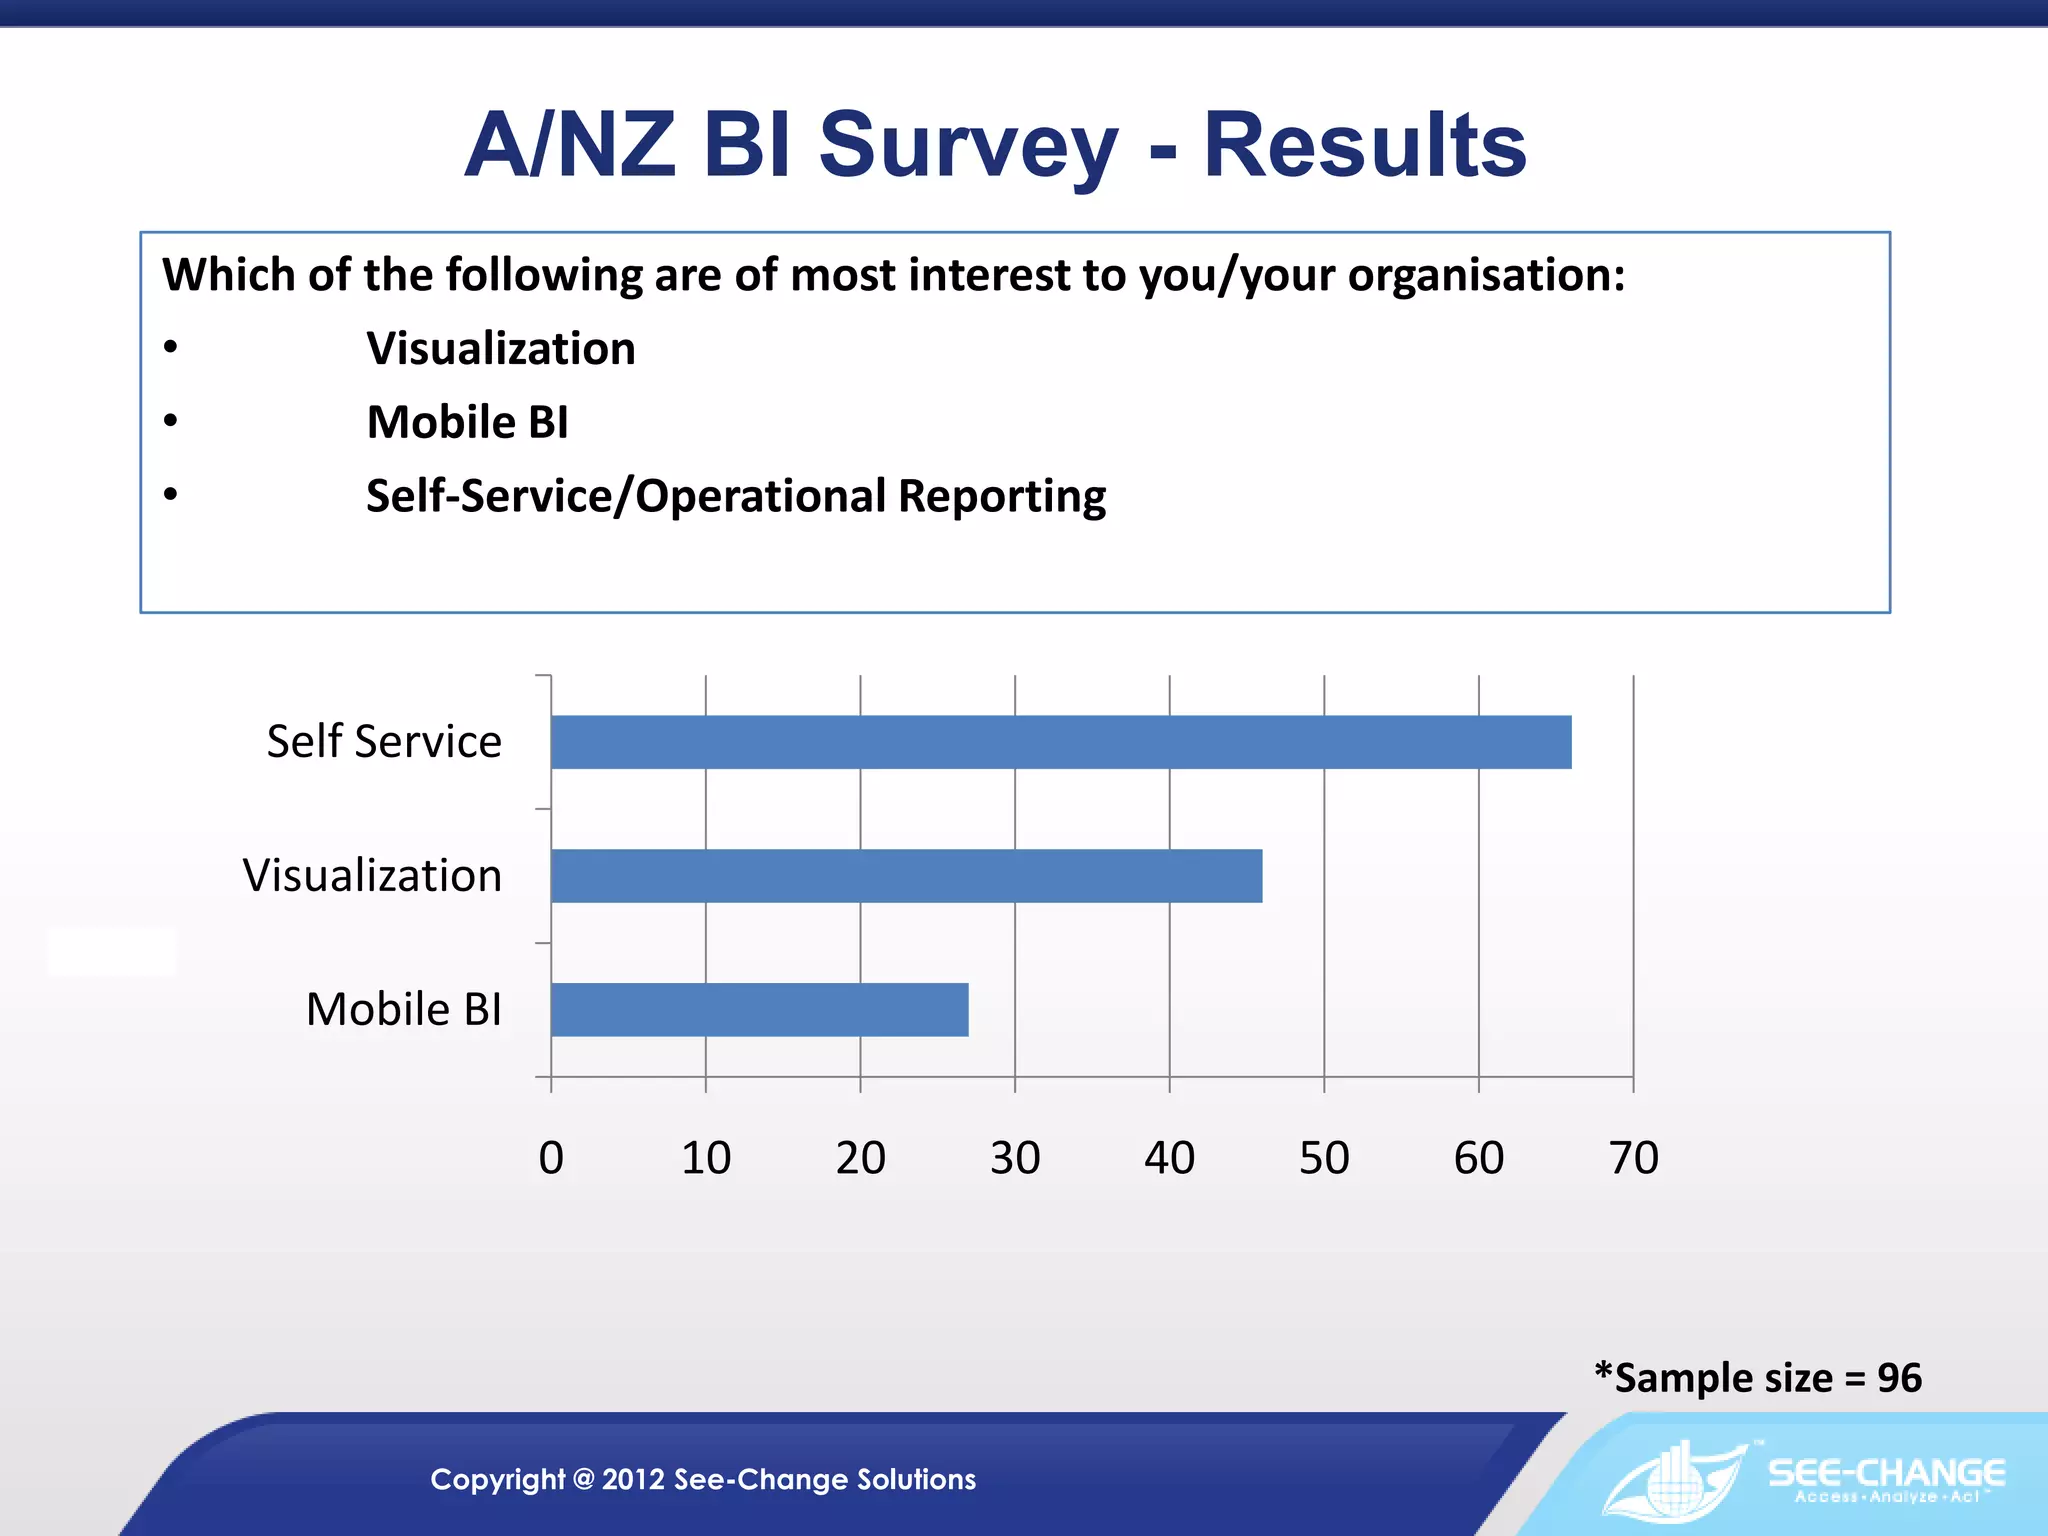
This document summarizes the results of a 2011-12 survey of 230 organizations in Australia and New Zealand about their business intelligence and analytics trends. It finds that the top challenges faced are disparate systems, poor data quality, and an inability to effectively analyze corporate data. While most organizations provide dashboards to business users and rely heavily on spreadsheets for reporting, only about a third enable self-service reporting. Looking ahead, most plan to evaluate new BI projects within the next year, and visualization, mobile BI, and self-service reporting are of greatest interest.
Twelve Heuristics for Solving Tough Problems Faster and BetterTechWell
As infants, we begin our lives as problem-solving machines, learning to navigate a strange and complex world in which others communicate in ways we don’t understand. Initially, we hone our problem-solving talents. Then many of us find our explorations thwarted and eventually stop using—and then begin losing—our natural problem-solving ability. It doesn’t have to be that way. Psychologists tell us that people can regain lost skills and learn new ones to become better problem solvers. Payson Hall shares techniques and skills that apply to situations in real life. Specifically, learn techniques to better define problems and explore twelve heuristics for generating solutions that can help when you and your team are staring at a blank paper, struggling to find candidate solutions for further consideration. Learn when random search is appropriate, how binary search can help with diagnostics, strategies for identifying and overcoming opposition, and when transferring the problem to someone else just might be the best strategy of all.
Shows the importance of conducting employee opinion surveys.
Companies lose $350 billion a year because of employee disengagement. Disengaged employees impact your business' productivity, level of innovation, and ultimately the bottom line.
These are the results of a survey amongst more than 500 SaaS Company executives in Q4 2011 regarding the business metrics they use to run their business.
Key findings from the 2020 state of database dev ops reportRed Gate Software
The results are in! Join our expert panel, Kendra Little, Kellyn Pot’Vin Gorman & Grant Fritchey, to dig into key findings from Redgate’s fourth annual State of Database DevOps Report and learn how to use these insights to drive improvements in your own software development process.
Our webinar panel this year includes specialists with expertise in both Oracle and SQL Server, as well as experience implementing and managing Agile methodologies and compliant database DevOps in Enterprise environments.
We will share key findings and insights from this year’s report, which received input from more than two thousand developers, DBAs, and IT leaders worldwide, representing all industry verticals. Topics will include:
• Frequent database deployments are increasing: 49% of respondents now report they deploy database changes to production weekly or more frequently;
• The two top perceived obstacles to implementing DevOps are now concerns about upskilling and disruption to existing workflows. We will discuss how business cases to implement database DevOps should address these concerns;
• Developers are now involved in the majority of production database deployments, continuing an increasing trend we have seen across four years of this study. We will discuss what this means for both developers and DBAs;
• Most respondents deploy changes to their most business-critical databases while the system is online. Those who perform all or nearly all deployments with the system online reported lower lead time for changes and lower defect rates. We will discuss why this makes sense and how teams achieve this;
• Respondents who report that it is easy to get a code review for database changes also report lower production defect rates and lower lead time for changes to be deployed to production. We will discuss how to optimize database code review for different organization and team sizes.
Click through to see the top corporate recruiting trends for India in 2012.
Learn more about LinkedIn Talent Solutions: http://linkd.in/1bgERGj
Subscribe to the LinkedIn Talent Blog: http://linkd.in/18yp4Cg
Follow the LinkedIn Talent Solutions page: http://linkd.in/1cNvIFT
Tweet with us: http://bit.ly/HireOnLinkedIn
A wide-ranging survey of US systems administrators that captures the rapidly evolving nature of the sysadmin role and their thoughts on life inside and outside of the workplace in October 2013
Slides from a workshop entitled "Measuring the Impact of Social Media and Determining Next Steps" at the Advanced Learning Institute's Social Media for Government conference on March 26, 2009.
Measuring the Impact of Social Media in GovernmentAri Herzog
Titled "Measuring the Impact of Social Media and Determining Next Steps," this is a presentation led by me and Andy Krzmarzick during the final workshop of the Advanced Learning Institute's 'Social Media for Government' conference in Washington, DC on March 26, 2009.
Smart Cities Week Australia 2019 - Case Study: Idaho National LaboratoryPatrick Spedding
INL has a vision to provide clean, secure connected transportation, addressing critical zero-emission transportation system challenges (e.g. grid capabilities and charging strategies). The 10-20 year strategic objective is to demonstrate Autonomous, Connected, Electrified and Shared mobility transportation solutions. A short term goal is to provide a bus electrification management system digital experience, engaging everyone from passengers and drivers to fleet planners, operators and manufacturers.
Cities are getting more crowded. Already, more than half the world's population lives in urban areas and this number is expected to increase to two thirds by 2050. The truth is, you are getting disrupted. The source of that disruption might be social, economical or technological. Fact is, every community needs to innovate how they work with data, engage employees and constituents and improve processes. Meet AlohaCloud for Smarter Cities. Solving Digital. Now.
Many organizations use both SAS and Cognos for a variety of reporting requirements. Both solutions are ‘best of breed’ in their own areas – SAS in the area of Analytics and ‘Analytical Data Preparation’, Cognos in the area of flexible reporting and distribution of information/reports for end user consumption. Consequently, it makes sense to find ways to integrate these technologies to provide an Integrated Information Framework which leverages the strengths of both solutions.
The integration of SAS and Tableau can have significant business benefits. SAS and Tableau are ‘best of breed’ in their own areas: SAS in the area of Analytics and ‘Analytical Data Preparation’; Tableau in the area of data discovery, visualization and intuitive, interactive dashboarding. Consequently, it makes sense to find ways to combine these technologies to deliver an Integrated Information Framework which leverages the strengths of both solutions.
Visualization, Mobility and Analytical ReportingPatrick Spedding
Still over-reliant on Excel for reporting? Difficult to get access to the information you need to make informed decisions?
Most organisations now recognise the danger of relying too heavily on "gut feel" when it comes to making critical business decisions.
With emerging capabilities such as data visualisation, mobile devices and analytical reporting, now is the time to re-evaluate how information is consumed within your organisation.
Join us for this complementary event, and hear how companies such as ComSuper, CUA, American Express and others use Business Intelligence to support fact-based, decision-making and analytical reporting. Breakfast included.
3. A/NZ BI Survey - Results
Q1: What challenges do you face when relying on your data to drive performance?
Unable to effectively analyse corporate data 38.16%
Poor Data Quality 44.30%
Unable to access the correct data 25.44%
Disparate systems 53.95%
Unreliable Data 25.00%
120
100
80
60
40 78 94 110
20
54
0 51
Unable to
effectively Poor Data
Quality (45.4%) Unable to
analyse access the Disparate
corporate data correct data systems (53.1%) Unreliable Data
(37.7%) (26.1%) (24.6%)
*Sample size = 230
Copyright @ 2012 See-Change Solutions
4. A/NZ BI Survey - Results
Q2: Are you able to provide your business users dashboards/scorecards that show current
performance information?
Yes: 59.65%
No: 40.35%
92
Yes (59.65%)
136
No (40.35%)
*Sample size = 228
Copyright @ 2012 See-Change Solutions
5. A/NZ BI Survey - Results
Q3: How long do you spend each month preparing regular reports?
Less than a day 16.23%
1-2 days 21.93%
3 days 10.96%
4 days 10.53%
Five or more days 26.75%
Don’t know 13.60%
60
50
40
30
50 55
20
33 28
10 21 20
0
Less than a 1-2 days 3 days 4 days Five or Don’t know
day (15.9%) (24.2%) (10.1%) (9.7%) more days (13.5%)
(26.6%)
*Sample size = 228
Copyright @ 2012 See-Change Solutions
6. A/NZ BI Survey - Results
Q4: Are any of your existing query & reporting processes carried out using spreadsheets?
Yes: 89.94%
No: 10.06%
22
Yes (89.4%)
No (10.4%)
185
*Sample size = 228
Copyright @ 2012 See-Change Solutions
7. A/NZ BI Survey - Results
Q5: Are business users across your organisation able to create their own ad-hoc reports, or do
they rely on others to amend/change existing reports?
Able to create 38.16%
Rely on others 58.33%
No ability to create 3.51%
8
Able to create (38.16%)
87
Rely on others (58.33%)
No ability to create
133 (3.51%)
*Sample size = 228
Copyright @ 2012 See-Change Solutions
8. A/NZ BI Survey - Results
Q6: When is your organisation considering new reporting/business intelligence project requirements?
Currently evaluating 39.91%
Next 6 months 12.72%
6-12 months 10.53%
>12 months 36.84%
(Evaluating in < 12 months 63.16% )
100
90
80
70
60
50
40 91
30
20 84
10
0 29
24
Currently
evaluating Next 6 months
(12.72%) 6-12 months
(39.91%)
(10.53%) >12 months
(36.84%)
*Sample size = 228
Copyright @ 2012 See-Change Solutions
9. A/NZ BI Survey - Results
Do your executives request Do business users across your
frequent reports and company organisation have the ability to
performance updates? easily create reports using data
from multiple date sources and
share those reports with others?
Yes (96.2%)
Yes (38.5%)
No (3.8% )
No (61.5%)
*Sample size = 55
Copyright @ 2012 See-Change Solutions
10. A/NZ BI Survey - Results
Which of the following are of most interest to you/your organisation:
• Visualization
• Mobile BI
• Self-Service/Operational Reporting
Self Service
Visualization
Mobile BI
0 10 20 30 40 50 60 70
*Sample size = 96
Copyright @ 2012 See-Change Solutions
11. A/NZ BI Survey - Results
What is your organisation’s preferred Mobile platform?
• i OS (iPhone, iPad)
• Blackberry
• Android iOS
• Symbian
Blackberry
• Windows Mobile
• Other
Android
Windows
Mobile
*Sample size = 96
Copyright @ 2012 See-Change Solutions