SAS Programming Tips & Techniques for Excel Pivot Tables
1. 1
SAS 9 Tips & Techniques
By Philip Mason, Wood Street Consultants Ltd., Oxfordshire, England
Abstract
Here is a collection of SAS® Tips & Techniques from my
20 years experience as a SAS programmer. You can read
about some of them in my book “In the Know: SAS Tips
& Techniques from around the globe”, which is available
from SAS Institute and amazon.com. Others are from my
second book which is currently being finalized, and there
are also a few extras.
Create a pivot table from SAS
A colleague and I were looking at the best way to
automatically create a pivot table in EXCEL®
automatically from SAS. We considered solutions such as
ODS with MSO XML directives, straight XML, DDE,
and so on – but these were all very complex. He finally
came up with the following simple method.
We use a SAS program to create a spreadsheet and then
call a Visual Basic Script. The Visual Basic Script does
the following:
• open the spreadsheet
• add a new sheet for pivot table
• create a pivot table using wizard
• set the fields to be used in the table
The SAS program could be extended to make a macro
which creates the VBS file. This could then make it
parameter driven to work for all data.
SAS Program
* create EXCEL spreadsheet ;
proc export data=sashelp.class
outfile="c:sasclass.xls"
dbms=excel;
quit;
* call VB script to make the pivot table ;
data _null_;
x 'c:saspivot.vbs';
run;
VB Script Program
Set XL = CreateObject("Excel.Application")
XL.Visible=True
XL.Workbooks.Open "c:sasclass.xls"
Xllastcell= xl.cells.specialcells(11).address
XL.Sheets.Add.name = "PivotTable"
xldata="class"
XL.Sheets(xldata).select
XL.ActiveSheet.PivotTableWizard
SourceType=xlDatabase,XL.Range("A1" & ":" &
xllastcell),"Pivottable!R1C1",xldata
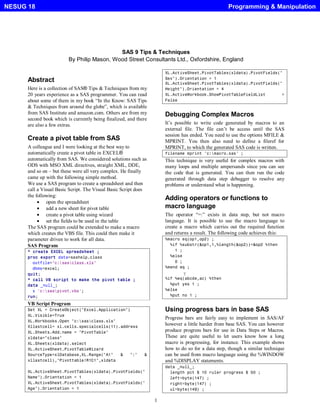
XL.ActiveSheet.PivotTables(xldata).PivotFields("
Name").Orientation = 1
XL.ActiveSheet.PivotTables(xldata).PivotFields("
Age").Orientation = 1
XL.ActiveSheet.PivotTables(xldata).PivotFields("
Sex").Orientation = 1
XL.ActiveSheet.PivotTables(xldata).PivotFields("
Height").Orientation = 4
XL.ActiveWorkbook.ShowPivotTableFieldList =
False
Debugging Complex Macros
It’s possible to write code generated by macros to an
external file. The file can’t be access until the SAS
session has ended. You need to use the options MFILE &
MPRINT. You then also need to define a fileref for
MPRINT, to which the generated SAS code is written.
filename mprint 'c:macro.sas' ;
This technique is very useful for complex macros with
many loops and multiple ampersands since you can see
the code that is generated. You can then run the code
generated through data step debugger to resolve any
problems or understand what is happening.
Adding operators or functions to
macro language
The operator “=:” exists in data step, but not macro
language. It is possible to use the macro language to
create a macro which carries out the required function
and returns a result. The following code achieves this:
%macro eq(op1,op2) ;
%if %substr(&op1,1,%length(&op2))=&op2 %then
1 ;
%else
0 ;
%mend eq ;
…
%if %eq(abcde,ac) %then
%put yes 1 ;
%else
%put no 1 ;
Using progress bars in base SAS
Progress bars are fairly easy to implement in SAS/AF
however a little harder from base SAS. You can however
produce progress bars for use in Data Steps or Macros.
These are quite useful to let users know how a long
macro is progressing, for instance. This example shows
how to do so for a data step, though a similar technique
can be used from macro language using the %WINDOW
and %DISPLAY statements.
data _null_;
length pct $ 10 ruler progress $ 50 ;
left=byte(147) ;
right=byte(147) ;
ul=byte(149) ;
Programming & ManipulationNESUG 18
2. 2
ur=byte(151) ;
ll=byte(155) ;
lr=byte(159) ;
ruler=repeat(byte(148),49) ;
bit=byte(164)||byte(164)||byte(164)||byte(164)||
byte(164) ;
window bar irow=5 rows=9 icolumn=15 columns=64
#1 @11 ul
@12 ruler
@62 ur
#2 @2 'Progress' color=orange
@11 left
@12 progress color=blue
@62 right
#3 @11 ll
@12 ruler
@62 lr
#4 @35 pct ;
progress=bit ;
pct=putn(.1,'percent.') ;
display bar noinput;
link pause ;
do i=1 to 9 ;
progress=repeat(bit,i) ;
pct=putn(.1+i*.1,'percent.') ;
display bar noinput;
link pause ;
end ;
stop;
return ;
pause:
now=time() ;
do while((now+1)>time()) ;
end ;
return ;
run;
The key points are:
–Define a window shaped like a bar
–Redisplay it each time we have some progress
–Just change value and link to routine to update
bar
Some of the important Statements in Code are:
–“Window bar ” defines progress bar display
window
• Specifies position on screen
• Variable & colour used to display
progressing bar
–“display bar noinput” refreshes the bar display
and requires no input from user to continue
Mixed data step & SQL code
There are some features available in a data step that are
not available in SQL, and visa-versa. However you can
have data step code in an SQL statement by creating a
view and referring to it from SQL. For example:
data out / view=out ;
set sasuser.houses ;
if style='CONDO' then
put 'obs=' _n_ price= ;
run ;
proc sql ;
create table more as select * from out where
price >100000 ;
quit;
run;
This creates a dataset and writes some variable
information to the log You can similarly have SQL code
within a data step, by using views
Some sort techniques
• A general rule-of-thumb for calculating sort
space required is three times the space of
the dataset.
• You can simply set Compress=yes on a
dataset and then sort it. This can result in
time savings, in my example I saved 8%.
• The Tagsort option is very good on large
datasets where key is small. In one example
I saved 49% of the elapsed time. When the
sort key approaches the size of the
observation, the effectiveness of this
technique decreases and can eventually
increase time taken.
• You should almost always use the Noequals
option on PROC SORT. This often saves
me around 5% of the time. All that this
option does is tells SAS not to worry about
the order of observations within BY groups.
EQUALS causes SAS to keep that order the
same as the observations were in the input
data. An extra overhead that is virtually
never required.
• You can often combine datastep code with a
sort by using a VIEW. This generally saves
me at least 27% of the time. The next tip
explains this further.
Views can move pre-processing into
procedures for efficiency
•Inefficient
Data test ;
if flag=1 ;
run;
Proc sort data=test ;
by flag;
run;
•Efficient
Data test/view=test ;
if flag=1 ;
run;
Proc sort data=test ;
by flag;
run;
Programming & ManipulationNESUG 18
3. 3
Changing data step to a view causes less I/O to be done,
since data is read once. The IF condition is applied and
the record fed into proc sort directly.
Finding secret SAS options
You can find out the settings of all documented and
undocumented SAS options by using the following code:
Proc options internal ;
run ;
Some of the options that are revealed include
BELL Enables/disables the warning
bell
CDE=H Display SAS System information
CTRYDECIMALSEPARATOR=. Country specific decimal
number separator.
CTRYTHOUSANDSEPARATOR=, Country specific
thousands number separator.
DEBUGLEVEL= Controls display of debug
information. There are five levels (TESTING,
NORMAL, DEBUG, FULLDEBUG, and DEMO).
ENHANCEDEDITOR Invoke the enhanced editor at
SAS startup
NOUNBUFLOG The log is buffered.
Put a zip in your pipe
Pipes read live output from programs. They originated on
UNIX systems but are also available on Windows. You
can define a pipe to a program as in this example,
filename testpipe pipe 'pkunzip.exe c:temptest
-c’ ;
This uses PKZIP to decompress an archive. The “-c”
option sends data to the console, flowing into pipe, able
to be read by SAS. The PIPE parameter is required.
One of the major uses of this is to allow the processing of
files too large for disk.
** Define pipe to get output from PKZIP ;
filename testpipe pipe 'pkunzip.exe
c:tipscolon -c' ;
data report ;
* Read data from pipe ;
infile testpipe ;
input line & $200. ;
* Skipping PKZIP header ;
if _n_<=9 then
delete ;
run ;
proc print data=report ;
run ;
Some ways to speed up your SAS
programs
o It is usually much faster to use native operating
system commands for copying & deleting
datasets, catalogs, etc. You can use the new
version 8 command to execute o/s commands
asynchronously in order to save even more time.
o It is advisable to clean up work space during a
SAS session since SAS only does so at the end.
Particularly large work datasets should be
deleted by you when they are no longer needed,
otherwise they may take valuable space
o You should clean up memory every so often, by
using the “CDE P” command to purge unused
modules from memory.
o You can split data into smaller bits for sorting.
This is especially useful if they can fit in
memory. In one of my examples I saved 36% of
the elapsed time.
o You can use compressed single keys made up of
several variables for sorting and indexing. This
usually takes less time and results in your
dataset being in the same order.
o You should try to reduce I/O contention by
putting work, swap and data on different
physical disks where possible.
Mixed numeric informats
Unquoted numerics in the informat definition are treated
as numbers. Quoted text is treated as character. This can
be quite useful if reading data which has mixed values,
which need to be interpreted in different ways.
Proc format ;
invalue mixed
‘LOW’ = -99
1-10 = 1
11-20 = 2
‘BIG’ = 99
other = 0 ;
Run ;
Building long selection lists in SQL
Macro variables may be up to 64k long. This is very
useful to store long text strings, such as variable lists. For
instance we could make a list of employees in one dataset
to select from another.
proc sql ;
select name into :namelist separated by ','
from sasuser.class where sex='F' ;
quit ;
%put namelist=&namelist;
Where on output dataset
Where clauses can be used for filtering data. Usually they
are used with input data, but they can be used with output
data too. One good use of this is for keeping selected
_type_ values produced by a PROC SUMMARY.
proc summary data=sasuser.houses ;
class style street ;
var _numeric_ ;
output sum=
Programming & ManipulationNESUG 18
4. 4
out=temp(where=(_type_ in (1,3))) ;
run ;
proc freq ;
table _type_ ;
run ;
SAS OLE automation server
You might be wondering how I ran my demos
from PowerPoint? PowerPoint can run programs
by associating an action setting with some text
or graphic. The program I run is the SAS OLE
automation server, SASOACT.EXE. Some
examples of using this are as follows:
SASOACT.EXE action=Open datatype=SASFile
filename=”Test.sas"
SASOACT.EXE action=Submit datatype=SASFile
filename=”Test.sas"
SASOACT.EXE action=Open datatype=Data
filename="Houses.sd2"
Traffic lighting a table with hot & cold
Traffic lighting is a technique often applied to tables to
indicate visually whether something is good (green), OK
(amber) or bad (red). This can be very easily
implemented in Proc Tabulate with ODS. Another way to
indicate good/bad is to use a graduated shading from
Blue (cold) to Red (hot) – where blue is good and red is
bad. The following example shows how this is done.
The key to the technique is to use a feature within Proc
Tabulate that allows us to override the style attribute
“background” using a format. The number in each cell is
then applied to this format to get the color to use for the
background color. I also create a format which smoothly
moves from blue to red. The result is impressive.
Sample Program
* Create a format to display colors ranging from
Blue (cold) to Red (hot) ;
data _null_ ;
call execute('proc format fmtlib ; value
pct_') ;
max=1;
maxloop=255 ;
do i=1 to maxloop ;
color='cx'||put(i/maxloop*255,hex2.)||'00'||put(
(maxloop-i)/maxloop*255,hex2.) ;
from=((i-1)/maxloop)*max ;
to=(i/maxloop)*max ;
call execute(put(from,best.)||'-
'||put(to,best.)||'='||quote(color)) ;
end ;
call execute('.="light gray" other="cxd0d0d0"
; run ;') ;
run ;
* get the maximum value of air ;
proc sql ;
select max(air),min(air) into :max,:min from
sashelp.air ;
%let range=%sysevalf(&max-&min) ;
* express values of air as a percentage of the
maximum ;
data air ;
set sashelp.air ;
year=year(date) ;
month=month(date) ;
* percentage is the level above the minimum ;
pct=(air-&min)/&range ;
run ;
* tabulate the results indicating maximum as
red, minimum as blue ;
ods html file='test.html' ;
title 'Air Quality over the years' ;
footnote 'Blue (cold) is best, Red (hot) is
worst' ;
proc tabulate data=air style={background=pct_.}
;
class year month ;
var pct ;
label pct='Air Quality Percent of worst month'
;
table
sum=''*pct*f=percent.,year='Year',month='Month
of Year' ;
run ;
ods html close ;
Using the ZIP engine to read zip files
There is a currently undocumented filename engine
available in SAS 9 that can be used to read from
compressed ZIP files directly. You simply specify the
engine “SASZIPAM” on a filename statement, and when
referring to it you must specify the file within it that you
wish to read. In the example below “tomcat.zip” contains
a number of files. I want to read “tomat.log” and
therefore specify “in(tomcat.log)”, where “in” is the
libref and “tomcat.log” is the file I will read from the zip
file.
Sample SAS Program
filename in saszipam 'c:tomcat.zip';
data _null_;
infile in(tomcat.log);
input ;
put _infile_;
if _n_>10 then
stop ;
run;
New IF functions
It’s always worth looking at “What’s New” for the latest
SAS release. It often reveals very useful new additions,
which often turn out to be available in prior releases of
SAS also, though they are undocumented there. See
http://support.sas.com/software/91x/lrdictwhatsnew900.
Programming & ManipulationNESUG 18
5. 5
htm which describes what is new in SAS 9.1.3 Base
SAS.
Two of the more useful new functions are the IFN &
IFC functions. These are useful for more efficient coding
and can be used anywhere a function can be used, even
in where clauses or macro language (using %sysfunc).
In fact using the IF functions from macro language
means that you can use IF logic in open code, rather
than being forced to use a macro program.
IFN(condition, true-numeric-value, false-numeric-
value, missing-numeric-value)
IFN returns a numeric value. It returns the true, false or
missing value depending on whether the condition is
true, false or missing. Documentation is at
http://support.sas.com/91doc/getDoc/lrdict.hlp/a0026045
73.htm
IFC(condition, true-character-value, false-character-
value, missing-character-value)
IFC returns a character value. It returns the true, false or
missing value depending on whether the condition is
true, false or missing. Documentation is at
http://support.sas.com/91doc/getDoc/lrdict.hlp/a002604
570.htm
Example SAS Log
21 * without IFN function ;
22 data test1 ;
23 set sashelp.class ;
24 * set entry price based on age ;
25 if age>=13 then
26 price=12.50 ;
27 else
28 price=8 ;
29 run ;
NOTE: There were 19 observations read from the
data set SASHELP.CLASS.
NOTE: The data set WORK.TEST1 has 19
observations and 6 variables.
NOTE: DATA statement used (Total process time):
real time 0.01 seconds
cpu time 0.01 seconds
30 * with IFN function ;
31 data test2 ;
32 set sashelp.class ;
33 * set entry price based on age ;
34 price=ifn(age>=13,12.50,8) ;
35 run ;
NOTE: There were 19 observations read from the
data set SASHELP.CLASS.
NOTE: The data set WORK.TEST2 has 19
observations and 6 variables.
NOTE: DATA statement used (Total process time):
real time 0.01 seconds
cpu time 0.01 seconds
36 %put %sysfunc(ifc(&sysscp=WIN,You are using
Windows!,You are not using Windows)) ;
You are using Windows!
Connecting to ODBC the easy way
If you have SAS/Access for ODBC licensed, then
you will be able to connect to all kinds of supported
databases through libname engines. This lets you
use those databases just as though they were SAS
files. Sometimes it can be tricky setting up the
libname definition though, but there is an easy way
to do it.
ODBC
libname in odbc complete=" " ;
%put Connection String: %superq(sysdbmsg) ;
When you run this code you get the “Select Data
Source” window popup which lets you select, modify
or define ODBC data sources. The libref is then
defined and you can pickup the connection string
created from the macro variable &sysdbmsg. That
can then be put into the complete= string.
SAS Log
11 libname in odbc complete=XXX ;
NOTE: Libref IN was successfully assigned as
follows:
Engine: ODBC
Physical Name: MS Access Database
12 %put Connection String: %superq(sysdbmsg) ;
Connection String: ODBC: DSN=MS Access
Database;DBQ=D:My
Documentsdb1.mdb;DefaultDir=D:My
Documents;DriverId=25;FIL=MS
Access;MaxBufferSize=2048;PageTimeout=5;
Discovering ODS events, to help
make tagsets
ODS is very flexible and provides PROC TEMPLATE
which can be used to create your own custom tagsets.
Then using the MARKUP destination you can use your
tagset to create the required output. This is a hugely
powerful and flexible facility, but often baffles those
trying to use it. One common question is “what events
should I define in my tagset?”. Well the developer of the
ODS tagset mechanism (Eric Gebhart at SAS) has
provided 2 tagsets that can be used to display the events
that occur when producing some ODS output.
EVENT_MAP
creates XML output that shows which events are being
triggered and which variables are used by an event to
send output from a SAS process to an output file. When
you run a SAS process with EVENT_MAP, ODS writes
Programming & ManipulationNESUG 18
6. 6
XML markup to an output file that shows all event
names and variable names as tags. The output helps you
to create your own tagsets. e.g.
ods markup file='test.xml' tagset=event_map ;
proc print data=sashelp.class ; run ;
ods _all_ close ;
dm "wbrowse 'test.xml'" ;
SHORT_MAP
creates a subset of the XML output that is created by
EVENT_MAP. e.g.
ods markup file='test.xml' tagset=short_map ;
proc print data=sashelp.class ; run ;
ods _all_ close ;
dm "wbrowse 'test.xml'" ;
Viewing Tables with variable names,
not labels
Many people make use of the viewtable command in
SAS, which can be used in different ways, for example
1 – from the command line “viewtable sashelp.class”
2 – abbreviated from the command line “vt sashelp.class”
3 – from the explorer window by double clicking on a
dataset, or view
4 – from the explorer window by right clicking on a
dataset or view, and then selecting open
By default when you view the table, you will see variable
labels over each column. I know that this annoys some
people and they would like to have variable names appear
by default, so here is how to do it.
1. click on the explorer window to activate it – making
the context sensitive menus appropriate for it
2. Select tools/options/explorer
3. double click on “table” (or “view”, depending which
you are changing)
4. double click on “&Open”
5. Now you can see the command that is issued when
you double click on a table in the explorer window, it
is probably “VIEWTABLE %8b.'%s'.DATA”
6. Now add the following optional parameter to the end
of this command … “colheading=names”. This
makes the command now “VIEWTABLE
%8b.'%s'.DATA colheading=names”
7. Exit the dialog boxes via OK, and you are finished.
If you wanted to open the table in form view, rather than
table view then you could also add this … “view=form”.
As far as I know these options are not documented
anywhere.
• Colheading can be either names or labels.
• View can be either form or table.
I haven’t found any good documentation that I can refer
you to on this command. The following reference in SAS
9 documentation should go to doc on viewtable, but leads
to a dead end. http://v9doc.sas.com/cgi-
bin/sasdoc/cgigdoc?file=../fsp.hlp/vtmain_1.htm#a00000
9106
Putting multiple graphs & tables on
an HTML page
The guys at SAS have produced a wonderful new tagset
(thanks Eric!) called the HTML Panel tagset. This will be
available in SAS 9.2, but can be downloaded and used
now from this page
http://support.sas.com/rnd/base/topics/odsmarkup/htmlpa
nel.html, which also describes how to use it.
The tagset lets you do pretty much anything that you can
do with the normal ODS HTML destination, except you
can break your page up into rows and columns. So you
could have 2 graphs at the top, followed by a table, then
perhaps 3 columns with graphs in each, etc. Just use your
imagination.
The following code gives you a bit of an idea what can be
done with this tagset. It starts with 4 columns of bar
charts, over 3 rows. Then it has a report. And finally 5
columns of pie charts over 2 rows.
Note: before you can use this tagset you need to
download it and run the proc template code in SAS to
define it.
Sample Program
%let panelcolumns = 4;
%let panelborder = 4;
ods tagsets.htmlpanel file="C:bypanel2.html"
gpath='c:' options(doc='help');
goptions device=java xpixels=320 ypixels=240;
title1 'Product Reports' ;
footnote1 ;
proc summary data=sashelp.shoes nway ;
class region product ;
var stores sales inventory returns ;
output out=sum sum= mean= /autolabel autoname
;
run ;
proc gchart data=sum ;
by region ;
vbar product / sumvar=sales_sum
pattid=midpoint discrete ;
run;
quit;
proc summary data=sashelp.shoes nway ;
class region subsidiary ;
var stores sales inventory returns ;
output out=sum sum= mean= /autolabel autoname
;
run ;
%let panelcolumns = 5;
%let panelborder = 1;
ods tagsets.htmlpanel ;
title 'Summary data' ;
proc print data=sum ;
run ;
title 'Subsidiary Reports' ;
%let panelcolumns = 5;
%let panelborder = 1;
ods tagsets.htmlpanel ;
goptions dev=java xpixels=160 ypixels=120;
Programming & ManipulationNESUG 18
7. 7
proc gchart data=sum ;
by region ;
pie subsidiary / sumvar=sales_sum discrete ;
run;
quit;
ods _all_ close;
Running VB macros in EXCEL from
SAS
Using DDE, you can send an Excel 4.0 DDE function
call to execute a saved EXCEL Visual Basic macro. This
works with all versions of EXCEL, including EXCEL
2000 & EXCEL XP.
filename excdata dde 'Excel|System';
data _null_;
file excdata;
put ' RUN("File.xls!Macro2",FALSE)]';
run;
where File.xls is the name of the Excel file where the
macro is stored and Macro2 is the name of the Macro
you wish to run. Note: these names are case-sensitive.
Using unusual variable names
From version 8 onwards there is some extra functionality
provided with variable names within SAS, compared to
what can be done in version 6. For instance variable
names can be:
• Upper & lower case
• Up to 32 characters long
• Referencing variables is case insensitive
• Spaces and some special symbols are allowed
(depending on options)
To use embedded spaces and special symbols you need to
specify the following option
options validvarname=any;
The following example shows how to then create a
variable name and use it.
data test ;
'#1 @ the "Top"'n='John' ;
"Applied Statistician's"N=1 ;
run ;
proc print ;
id '#1 @ the "Top"'n ;
var "Applied Statistician's"N ;
run ;
Partial output from a PROC CONTENTS on the dataset
TEST follows.
Alphabetic List of Variables and Attributes
# Variable Type Len
1 #1 @ the "Top" Char 4
2 Applied Statistician's Num 8
SQL views are now updatable
(mostly)
In SAS versions 8 onwards you can update a dataset
referenced by an SQL view, providing the SQL view
meets some criteria such as:
• Only 1 table is referenced
• Table is not joined to another or linked via a set-
operator
• There are no sub-queries
• There is no ORDER BY
You can update columns provided they are not derived
columns.
See the following for more information -
http://v9doc.sas.com/cgi-
bin/sasdoc/cgigdoc?file=../proc.hlp/a000146905.htm#a00
0330615
SAS Program
proc sql ;
create view test as select height/weight as
ratio, * from sashelp.class ;
dm 'vt test' vt ;
After running this code I can edit TEST using the
viewtable window, and changes are reflected in
SASHELP.CLASS.
Using datasets without libnames
In SAS versions 8 onwards you can directly reference
SAS datasets, without needing to define a libname. This
is done by enclosing the physical file name in quotes.
SAS Log
15 * Create a version 6 dataset ;
16 data 'c:test.sd2' ; run ;
NOTE: c:test.sd2 is a Version 6 data set. In
future releases of SAS you may not be able to
create or update Version 6 data sets. Use PROC
COPY to convert the data set to Version 9.
NOTE: The data set c:test.sd2 has 1
observations and 0 variables.
NOTE: DATA statement used (Total process time):
real time 0.00 seconds
cpu time 0.00 seconds
17 * Create a version 8 dataset ;
18 data 'c:test.sd7' ; run ;
NOTE: The data set c:test.sd7 has 1
observations and 0 variables.
NOTE: DATA statement used (Total process time):
real time 0.01 seconds
cpu time 0.01 seconds
19 * Create a version 9 dataset ;
20 data 'c:test.sas7bdat' ; run ;
Programming & ManipulationNESUG 18
8. 8
NOTE: The data set c:test.sas7bdat has 1
observations and 0 variables.
NOTE: DATA statement used (Total process time):
real time 0.01 seconds
cpu time 0.01 seconds
21
22 * access a dataset directly ;
23 proc print data='c:test.sas7bdat' ; run ;
NOTE: No variables in data set c:test.sas7bdat.
NOTE: PROCEDURE PRINT used (Total process time):
real time 0.01 seconds
cpu time 0.00 seconds
Animated GIFs
SAS/Graph allows us to create animated GIF files. These
files can contain a number of graphs in the one file.
When displayed through an application which supports
them, we can see the graphs one by one. We can also
define whether the sequence repeats and how long
between each image.
For some nice examples of animated GIFs & the code to
produce them -
http://support.sas.com/rnd/samples/graph/gifanimovervie
w.html
SAS Program
filename anim 'c:anim.gif' ; /* file to create
*/
goptions device=gifanim /* animated GIF
driver */
gsfname=anim /* fileref to
save file to */
delay=100 /* 1/100s of a
second between each image */
gsfmode=replace /* wipe over
previous file */
disposal=background ; /* when graph is
erased background color returns */
proc gchart data=sashelp.prdsale ;
vbar3d prodtype ;
run ;
goptions gsfmode=append ; /* append the
next graph to existing image */
proc gplot data=sashelp.class ;
plot height*weight ;
run ;
goptions gepilog='3b'x; /* write end-of-
file character after next graph */
proc gchart data=sashelp.prdsale ;
hbar3d country ;
Some nice stuff on the web
o You can access the latest SAS Online
documentation at
o http://V8doc.sas.com/sashtml
o You can view & search SAS-L as well as SUGI,
NESUG, Pharmasug & other conference
proceedings at
o http://www.sas-l.org
o There are lots of great resources at
o www.consig.com
o Some newsletters with tips & techniques are:
o The missing semicolon – www.sys-
seminar.com
o VIEWS news – www.views-uk.org
o SAS Technology Report Tips Archive -
support.sas.com/sassamples/archive.ht
ml
Contact Information
Email: philipmason@email.com
Web: http://how.to/usesas
SAS and all other SAS Institute Inc. product or service names
are registered trademarks or trademarks of SAS Institute Inc.
in the USA and other countries. ® indicates USA registration.
Other brand and product names are trademarks of their
respective companies.
Programming & ManipulationNESUG 18