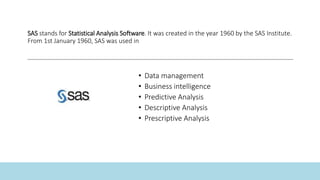
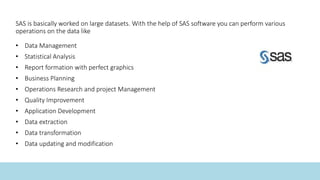
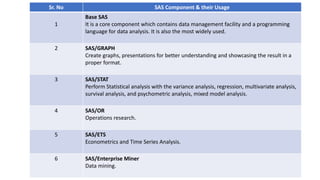
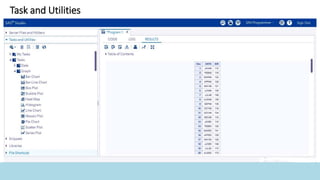
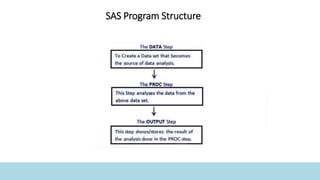
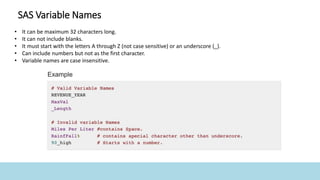
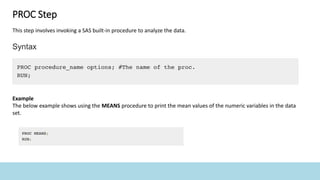
This document provides an overview of the Statistical Analysis System (SAS) software. It discusses what SAS is used for, including data management, statistical analysis, reporting, and more. It also covers SAS components and their usage, how to install and use the SAS studio interface, basic SAS syntax like variables and data sets, and common statistical procedures in SAS like PROC MEANS, PROC FREQ, and PROC UNIVARIATE to produce measures, frequencies and graphs.
This document provides an introduction and overview of the SAS statistical software system. It discusses that SAS was originally developed in the 1970s for agricultural research, but is now widely used statistical software. It also summarizes the main SAS product lines, resources for learning SAS including introductory books and online documentation, and provides a basic overview of the SAS programming language including data steps, procedure steps, and accessing SAS.
Learning
Base SAS,
Advanced SAS,
Proc SQl,
ODS,
SAS in financial industry,
Clinical trials,
SAS Macros,
SAS BI,
SAS on Unix,
SAS on Mainframe,
SAS interview Questions and Answers,
SAS Tips and Techniques,
SAS Resources,
SAS Certification questions...
visit http://sastechies.blogspot.com
The document provides an overview of SAS (Statistical Analysis System) software, including its applications, components, and tutorials. Key points include:
- SAS is an integrated suite of software used for data management, reporting, analytics, and more.
- It includes applications for executive information systems, data management, reporting, statistics, forecasting, and more.
- The document provides links to tutorials on base SAS, advanced SAS, macros, and certification preparation.
Aan introduction to SAS, one of the more frequently used statistical packages in business. With hands-on exercises, explore SAS's many features and learn how to import and manage datasets and and run basic statistical analyses. This is an introductory workshop appropriate for those with little or no experience with SAS.
Complete workshop materials include demo SAS programs available at http://projects.iq.harvard.edu/rtc/sas-intro
This document provides an overview of SAS (Statistical Analysis Software). It describes how SAS can handle large datasets with millions or billions of records. It also lists some common SAS modules and provides examples of DATA and PROC steps to create and process SAS datasets. Finally, it discusses the SAS programming environment and how to submit and run SAS programs.
This document provides instructions for inputting and managing data in SAS. It discusses creating a SAS library to organize data files. Steps are provided to manually create a SAS data set within a library and input data. Importing data from an external file is also mentioned as an alternative to manual input. The document reviews key SAS concepts like librefs and permanent vs temporary libraries.
This document provides an introduction and outline for using SAS software. It covers basic SAS windows and rules, loading and viewing data, manipulating data by selecting subsets, adding or deleting variables, sorting, summarizing data with procedures, and creating plots and outputting results to Word. Examples are provided for common procedures like SORT, MEANS, UNIVARIATE, FREQ, CORR and PLOT. Practice exercises are included to try these skills on a sample dataset.
This presentation is about -
Overview of SAS 9 Business Intelligence Platform,
SAS Data Integration,
Study Business Intelligence,
overview Business Intelligence Information Consumers ,navigating in SAS Data Integration Studio,
For more details Visit :-
http://vibranttechnologies.co.in/sas-classes-in-mumbai.html
htttps://www.smartprogram.in/sas
Learn SAS programming, SAS slides, SAS tutorials, SAS certification, SAS Sample Code, SAS Macro examples,SAS video tutorials, SAS ebooks, SAS tutorials, SAS tips and Techniques, Base SAS and Advanced SAS certification, SAS interview Questions and answers, Proc SQL, SAS syntax, Advanced SAS
SAS is a programming language that can be learned quickly. New users can write simple SAS programs within hours. SAS programs involve DATA and PROC steps - DATA steps input and process data, while PROC steps perform operations and output. The example SAS program reads student data from cards, assigns the values to variables in a DATA step, and prints the output in a PROC PRINT step. Additional PROC SORT and formatting options are demonstrated. The log file provides feedback on program execution and errors.
- PROC TABULATE creates customized tables that display descriptive statistics from SAS data. It allows users to classify and analyze variables to produce one, two, or three-dimensional tables.
- The procedure uses CLASS, VAR, and TABLE statements to specify how variables should be classified, analyzed, and presented in the table. Common statistics like frequency, mean, sum can be calculated and displayed.
- Two-way and multi-dimensional tables can be created to examine relationships between multiple variables. Formatting and summary options provide flexibility in customizing table output.
This document provides an overview of using PROC SQL in SAS Enterprise Guide 4.3. It discusses the basics of SAS Enterprise Guide 4.3, the typical SQL statement structure including common clauses, best practices for order of operations and joins, and how to use macro variables with PROC SQL. The purpose is to provide guidance for both beginners and advanced users on effectively working with PROC SQL.
This document provides an overview of SAS data sets and SAS programming. It discusses key concepts such as the two main parts of SAS programs (DATA and PROC steps), characteristics of SAS data sets such as variables and observations, and SAS libraries which are used to store SAS data sets. The document also provides examples of basic SAS code.
This document provides an overview and introduction to the SAS statistical software system. It discusses the origins and development of SAS, describes some of the main SAS products and their uses, and provides resources for further learning including introductory books and online materials. The document also outlines the basic structure of SAS programs including data steps, procedure steps, and accessing SAS on UNIX systems. It provides explanations of key concepts such as the structure of the data step and using the INPUT statement.
This document provides an introduction to SAS (Statistical Analysis System) including data management and analysis. It covers general topics such as the SAS interface, programs, data libraries and help/documentation. Specific techniques are explained like importing external data, combining and subsetting datasets, and commonly used functions. The document also gives examples of SAS statements for creating and analyzing datasets.
This document provides an overview of SAS programming concepts and techniques for working with data. It discusses reading raw data using DATA steps and PROC IMPORT, selecting and transforming data, merging datasets, handling missing values, and working with dates. Functions for character manipulation, arithmetic, ranking and summarizing data are also explained. Overall, the document serves as a helpful cheat sheet for common SAS programming tasks.
SAS is a software suite for advanced analytics. It was developed in the 1960s and includes components for statistical analysis, graphics, predictive modeling, and more. The main components of SAS are the data step for data manipulation and procedure steps for analysis. Common procedures include PROC PRINT, PROC MEANS, PROC FREQ and PROC REG. SAS programs are written in the SAS code editor and results are displayed in the SAS results window.
Understanding SAS Data Step Processingguest2160992
Learning
Base SAS,
Advanced SAS,
Proc SQl,
ODS,
SAS in financial industry,
Clinical trials,
SAS Macros,
SAS BI,
SAS on Unix,
SAS on Mainframe,
SAS interview Questions and Answers,
SAS Tips and Techniques,
SAS Resources,
SAS Certification questions...
visit http://sastechies.blogspot.com
The document provides answers to common questions asked in SAS interviews or for SAS certification. Key points:
- The OUTPUT statement overrides automatic output in DATA steps and writes observations only when executed.
- The STOP statement stops processing the current DATA step and resumes after.
- DROP= in the SET statement drops variables from processing, while DROP= in the DATA statement drops them from the output dataset.
- The END= option reads the last observation of a dataset to a new dataset.
Learning
Base SAS,
Advanced SAS,
Proc SQl,
ODS,
SAS in financial industry,
Clinical trials,
SAS Macros,
SAS BI,
SAS on Unix,
SAS on Mainframe,
SAS interview Questions and Answers,
SAS Tips and Techniques,
SAS Resources,
SAS Certification questions...
visit http://sastechies.blogspot.com
The concept about SAS software and it high end tools.
Stay connected for SAS programming Keywords.
Please not this uploaded ppt is not a copy right of any anonymous,this were created by Sushil Kasar for his basic learnings' and sharing Knowledge activities.
Regards,
Sushil & team.
Learn SAS programming, SAS slides, SAS tutorials, SAS certification, SAS Sample Code, SAS Macro examples,SAS video tutorials, SAS ebooks, SAS tutorials, SAS tips and Techniques, Base SAS and Advanced SAS certification, SAS interview Questions and answers, Proc SQL, SAS syntax, Advanced SAS, Quick links, SAS Documentation, SAS Addin to Microsoft office, Oracle, ODS HTML, ODS< Clinical trials, Financial Industry, Q & A, SAS Resumes, SAS Blogs, http://sastechies.blogspot.com, http://www.sastechies.com
This document provides a step-by-step guide to learning SAS. It begins with an introduction to SAS and its windowing environment. Next, it discusses SAS datasets and variables, including importing data into SAS and basic procedures and functions. The document then covers combining datasets in SAS before concluding with next steps. It assumes some basic database and analytics knowledge and provides disclaimers about its intended use as a high-level summary.
Sas Enterprise Guide A Revolutionary Toolsysseminar
The document describes SAS Enterprise Guide as a revolutionary tool that provides a point-and-click interface for SAS, allowing users to modify, analyze and report data without coding. It can increase efficiency, empower analysts without coding knowledge, and organize all SAS processes. The document highlights how SAS Enterprise Guide allows analysts to access and manipulate data, build queries, run analyses, and create reports and graphs through an intuitive graphical user interface without needing to learn SAS coding.
This document summarizes the key differences in how SAS 9.4 communicates with Microsoft Excel and Access compared to previous 32-bit versions of SAS. It describes two new approaches in SAS 9.4 - the PCFILES LIBNAME engine and SAS PC Files Server, and the XLSX LIBNAME engine. These allow SAS 9.4 to connect to 32-bit Excel and Access even when SAS is now 64-bit. The document also addresses incompatible SAS format catalog issues and provides solutions to resolve them.
I need help with Applied Statistics and the SAS Programming Language.pdfMadansilks
I need help with Applied Statistics and the SAS Programming Language
Solution
Introduction :
All SAS jobs are a sequence of SAS steps, which are
made up of instructions, which are called SAS
statements. There are only two kinds of SAS steps:
DATA steps are used to read, edit, and transform data
(raw data or SAS data files), to prepare SAS data sets,
PROC steps are ready-to-use procedures which
analyze or process SAS data sets. In general, data
must be in a SAS data file before they can be
processed by SAS procedures.
Without going into the details at this time, here is a
skeletal example of a SAS job:
DATA STUDENTS;
INPUT NAME $ 1-14 SEX $ 15
SECTION $ 17-19 GRADE;
DATALINES;
. . . data lines . . .
;
PROC SORT DATA=STUDENTS;
BY SECTION DESCENDING GRADE;
PROC PRINT DATA=STUDENTS;
BY SECTION;
RUN
There are two kinds of SAS data sets: SAS data files (or tables), and SAS data views. A SAS
data file contains: the descriptor portion, which provides SAS procedures and some DATA step
statements with descriptive information (data set attributes and variable attributes) about the data
, and the data portion, a rectangular structure containing the data values, with rows (customarily
called observations), and columns (customarily called variables); and which is passed to most
procedures, observation by observation. A SAS catalog is a type of SAS file which stores many
different types of information used by the SAS System. All SAS files reside in a SAS data
library. The SAS System processes the program in two steps: (1) it compiles the program, and
(2) it executes the program. When the program is compiled, a program data vector (PDV) is
constructed for each DATA step. It is an area of memory which includes all variables which are
referenced either explicitly or implicitly in the DATA step. At execution time, the PDV is the
location where the current working values are stored as they are processed by the DATA step.
Variables are added to the PDV sequentially as they are encountered during parsing and
interpretation of SAS source statements. Each step (DATA or PROC) is compiled and executed
separately, in sequence. And at execution time within each DATA step, each observation is
processed iteratively through all of the SAS programming statements of the DATA step. SAS
procedures (PROCs) are programs that are designed to perform specific data processing and
analysis tasks on SAS data sets. Base/SAS procedures fall into the following categories: SAS
Utilities -- APPEND, CATALOG, CIMPORT, COMPARE, CONTENTS, COPY, CPORT,
DATASETS, DBCSTAB, DISPLAY, EXPLODE, EXPORT, FORMAT, FSLIST, IMPORT,
OPTIONS, PMENU, PRINTTO, RANK, REGISTRY, SORT, SQL, STANDARD,
TRANSPOSE, TRANTAB; Descriptive Statistics -- CORR, FREQ, MEANS, SQL,
SUMMARY, TABULATE, UNIVARIATE; Reporting -- CALENDAR, CHART, FORMS,
MEANS, PLOT, PRINT, REPORT, SQL, SUMMARY, TABULATE, TIMEPLOT.
Creating SAS Data Files Since SAS procedures can operate only on SAS data sets, then the first
step in processing any .
This document provides an overview of writing a SAS program and importing data. It discusses utilizing SAS Studio to write a program, printing data from the program, and importing different data types like CSV and Excel files. The learning objectives are to write a SAS program, print data from the program, and import various data types. Sample code is provided to demonstrate writing a program that imports a soccer dataset and prints the player, age, and goals.
The document provides an overview of the SAS system and its components. It describes the four main data-driven tasks of data access, data management, data analysis, and data presentation. It also outlines the structure of SAS programs and data sets, and how to run and submit SAS programs. Key concepts covered include DATA and PROC steps, the SAS log and output, browsing descriptor and data portions of SAS data sets, and SAS syntax rules.
This document provides a summary of the SAS programming language and various SAS procedures. It describes the basic structure of a SAS job, SAS language elements like statements, comments, and variables. It also summarizes how to work with SAS data sets, the DATA and PROC steps for data manipulation and analysis, and some common statistical and graphical procedures.
8323 Stats - Lesson 1 - 03 Introduction To Sas 2008untellectualism
This document provides an introduction to SAS, a statistical software used for business intelligence. It discusses the main programming windows in SAS including the editor, log, and output windows. It also describes how to access and manage SAS datasets by assigning libraries, and how SAS programs are made up of data and proc steps to import data, create and analyze SAS datasets, and produce outputs.
This document provides an overview of SAS products and the basic structure of SAS programs. It discusses that SAS programs typically have data and procedure steps, where the data step prepares data and procedure steps analyze the data. The document also outlines how to access files from external sources using FTP or %include statements and write comments in SAS programs.
This document summarizes the key information about installing and using SPSS 11.5 for Windows. It outlines the operating system requirements, installation process, new features in 11.5 including new data definition tools and two-step cluster analysis, and known issues such as limitations of using files saved in SAS formats in other applications and performance issues with large datasets. The document provides guidance on installation, configuration, use, and troubleshooting of SPSS 11.5 for Windows.
Top 140+ Advanced SAS Interview Questions and Answers.pdfDatacademy.ai
SAS Interview Questions and Answers is a guide for individuals preparing for a job interview in the field of SAS (Statistical Analysis System). The guide includes a range of commonly asked interview questions and their answers, covering topics such as SAS programming, data manipulation, analytics, and more. It aims to help candidates prepare for the interview and showcase their knowledge and expertise in SAS.
Visit by :- https://www.datacademy.ai/sas-interview-questions-answers/
#SASInterview #SASInterviewQuestions #SASInterviewPrep #SASProgramming #DataAnalytics #DataManipulation #SASJobs #SASCareer #SASSkills #DataScience #InterviewPreparation
MySQL is a relational database management system that is open-source and can be installed from binary packages. It is commonly used for small to medium web applications and can be managed through command line tools or graphical interfaces. SQL queries are used to manage the database structure and data.
This document provides an introduction to SAS analytics training. It begins with introducing the instructor and their qualifications. It then outlines what will be covered in the training, including an introduction to analytics, the top 5 features of SAS, different types of SAS datasets, how to read data into SAS, and how to plot graphs to understand data. It also discusses what SAS is and why it is widely used, highlighting its maturity, certification programs, product support, and role in large enterprises.
This document provides an overview of basic SAS commands for inputting and analyzing data. It describes the SAS data step for inputting and manipulating data to create SAS datasets. It then summarizes commonly used SAS statistical procedures like ANOVA, CHART, CORR, and REG for analyzing SAS dataset. It includes syntax examples and explanations of options for these procedures.
Vibrant Technologies is headquarted in Mumbai,India.We are the best SAS training provider in Navi Mumbai who provides Live Projects to students.We provide Corporate Training also.We are Best Statistical Analysis System classes in Mumbai according to our students and corporates
This document summarizes information about SAS and how its legacy and computing structure compares to R. It discusses key aspects of SAS like its data structures, macro language, procedures, and output delivery system. It also provides examples of how common statistical analyses like descriptive statistics, class level processing, linear regression can be conducted in both SAS and R. The document recommends books for users to learn more about transitioning from SAS to R.
This document provides an introduction and overview of SAS programming, including descriptions of SAS datasets, variables, syntax, windows, and common procedures. It discusses the structure of SAS datasets which have a descriptor section and data section, and describes attributes of variables like name, type, and format. It also summarizes SAS syntax rules, comments, libraries, and how to use procedures like REG and UNIVARIATE.
This lesson covers creating and managing SAS datasets and formats. It teaches how to create permanent SAS datasets using the data statement, understand SAS libraries using the libname statement, modify SAS datasets, and create new variables using formats. Formats and labels are also discussed as ways to change how data values appear without changing the raw values. The key learning objectives are to create permanent SAS datasets, manage multiple SAS data sets and libraries, modify SAS datasets, understand the difference between formats and labels, and create new variables using formats.
Sample Questions The following sample questions are not in.docxtodd331
This document provides sample questions and content guides for the SAS 9.4 Base Programming certification exam. The exam will test skills in accessing and managing SAS data, conditional processing, using SAS functions, and generating reports. It will include performance-based practical programming questions involving reading, sorting, and categorizing SAS data, as well as standard multiple choice questions covering topics like using SAS procedures, formats, and loops.
The document provides an overview of SAS 9.3 and the SAS environment. It discusses what SAS is, who uses it, and its evolution. It then outlines the SAS user interface and describes the main windows, including the editor window, explorer window, log window, output window, and results window. The remainder of the document focuses on SAS programs, data sets, libraries, and procedures for working with data like PROC PRINT, PROC PLOT, PROC UNIVARIATE, PROC MEANS, PROC FREQ, and PROC SQL.
Enroll for Certified SAS Base course, training by SAS Certified experts. Find job globally with help of digital badge, become Certified SAS Base Programmer, get job placement assistance.
The document discusses new features in IBM Information Server/DataStage 11.3. Key points include:
- The Hierarchical Data stage was renamed and can now process JSON and includes new REST, JSON parsing, and composition steps.
- The Big Data File stage supports more Hadoop distributions and Greenplum and Master Data Management connector stages were added.
- The Amazon S3 and Microsoft Excel connectors were enhanced.
- Sorting and record delimiting were optimized and Operations Console/Workload Manager are now default features.
Dynamic Publishing with Arbortext Data MergeClay Helberg
Dynamic Publishing with Arbortext Data Merge allows authors to insert database queries into documents and automatically update the published results. It provides advantages over manual cut-and-paste by avoiding errors and ensuring updates. The process involves configuring an ODBC data source, defining queries with parameters, and setting preferences to control updating. Queries can output data as tables or through arbitrary XSL formatting.
Essentials of Automations: The Art of Triggers and Actions in FMESafe Software
In this second installment of our Essentials of Automations webinar series, we’ll explore the landscape of triggers and actions, guiding you through the nuances of authoring and adapting workspaces for seamless automations. Gain an understanding of the full spectrum of triggers and actions available in FME, empowering you to enhance your workspaces for efficient automation.
We’ll kick things off by showcasing the most commonly used event-based triggers, introducing you to various automation workflows like manual triggers, schedules, directory watchers, and more. Plus, see how these elements play out in real scenarios.
Whether you’re tweaking your current setup or building from the ground up, this session will arm you with the tools and insights needed to transform your FME usage into a powerhouse of productivity. Join us to discover effective strategies that simplify complex processes, enhancing your productivity and transforming your data management practices with FME. Let’s turn complexity into clarity and make your workspaces work wonders!
UiPath Test Automation using UiPath Test Suite series, part 5DianaGray10
Welcome to UiPath Test Automation using UiPath Test Suite series part 5. In this session, we will cover CI/CD with devops.
Topics covered:
CI/CD with in UiPath
End-to-end overview of CI/CD pipeline with Azure devops
Speaker:
Lyndsey Byblow, Test Suite Sales Engineer @ UiPath, Inc.
Why You Should Replace Windows 11 with Nitrux Linux 3.5.0 for enhanced perfor...SOFTTECHHUB
The choice of an operating system plays a pivotal role in shaping our computing experience. For decades, Microsoft's Windows has dominated the market, offering a familiar and widely adopted platform for personal and professional use. However, as technological advancements continue to push the boundaries of innovation, alternative operating systems have emerged, challenging the status quo and offering users a fresh perspective on computing.
One such alternative that has garnered significant attention and acclaim is Nitrux Linux 3.5.0, a sleek, powerful, and user-friendly Linux distribution that promises to redefine the way we interact with our devices. With its focus on performance, security, and customization, Nitrux Linux presents a compelling case for those seeking to break free from the constraints of proprietary software and embrace the freedom and flexibility of open-source computing.
Infrastructure Challenges in Scaling RAG with Custom AI modelsZilliz
Building Retrieval-Augmented Generation (RAG) systems with open-source and custom AI models is a complex task. This talk explores the challenges in productionizing RAG systems, including retrieval performance, response synthesis, and evaluation. We’ll discuss how to leverage open-source models like text embeddings, language models, and custom fine-tuned models to enhance RAG performance. Additionally, we’ll cover how BentoML can help orchestrate and scale these AI components efficiently, ensuring seamless deployment and management of RAG systems in the cloud.
Best 20 SEO Techniques To Improve Website Visibility In SERPPixlogix Infotech
Boost your website's visibility with proven SEO techniques! Our latest blog dives into essential strategies to enhance your online presence, increase traffic, and rank higher on search engines. From keyword optimization to quality content creation, learn how to make your site stand out in the crowded digital landscape. Discover actionable tips and expert insights to elevate your SEO game.
Climate Impact of Software Testing at Nordic Testing DaysKari Kakkonen
My slides at Nordic Testing Days 6.6.2024
Climate impact / sustainability of software testing discussed on the talk. ICT and testing must carry their part of global responsibility to help with the climat warming. We can minimize the carbon footprint but we can also have a carbon handprint, a positive impact on the climate. Quality characteristics can be added with sustainability, and then measured continuously. Test environments can be used less, and in smaller scale and on demand. Test techniques can be used in optimizing or minimizing number of tests. Test automation can be used to speed up testing.
Unlocking Productivity: Leveraging the Potential of Copilot in Microsoft 365, a presentation by Christoforos Vlachos, Senior Solutions Manager – Modern Workplace, Uni Systems
In his public lecture, Christian Timmerer provides insights into the fascinating history of video streaming, starting from its humble beginnings before YouTube to the groundbreaking technologies that now dominate platforms like Netflix and ORF ON. Timmerer also presents provocative contributions of his own that have significantly influenced the industry. He concludes by looking at future challenges and invites the audience to join in a discussion.
HCL Notes and Domino License Cost Reduction in the World of DLAUpanagenda
Webinar Recording: https://www.panagenda.com/webinars/hcl-notes-and-domino-license-cost-reduction-in-the-world-of-dlau/
The introduction of DLAU and the CCB & CCX licensing model caused quite a stir in the HCL community. As a Notes and Domino customer, you may have faced challenges with unexpected user counts and license costs. You probably have questions on how this new licensing approach works and how to benefit from it. Most importantly, you likely have budget constraints and want to save money where possible. Don’t worry, we can help with all of this!
We’ll show you how to fix common misconfigurations that cause higher-than-expected user counts, and how to identify accounts which you can deactivate to save money. There are also frequent patterns that can cause unnecessary cost, like using a person document instead of a mail-in for shared mailboxes. We’ll provide examples and solutions for those as well. And naturally we’ll explain the new licensing model.
Join HCL Ambassador Marc Thomas in this webinar with a special guest appearance from Franz Walder. It will give you the tools and know-how to stay on top of what is going on with Domino licensing. You will be able lower your cost through an optimized configuration and keep it low going forward.
These topics will be covered
- Reducing license cost by finding and fixing misconfigurations and superfluous accounts
- How do CCB and CCX licenses really work?
- Understanding the DLAU tool and how to best utilize it
- Tips for common problem areas, like team mailboxes, functional/test users, etc
- Practical examples and best practices to implement right away
TrustArc Webinar - 2024 Global Privacy SurveyTrustArc
How does your privacy program stack up against your peers? What challenges are privacy teams tackling and prioritizing in 2024?
In the fifth annual Global Privacy Benchmarks Survey, we asked over 1,800 global privacy professionals and business executives to share their perspectives on the current state of privacy inside and outside of their organizations. This year’s report focused on emerging areas of importance for privacy and compliance professionals, including considerations and implications of Artificial Intelligence (AI) technologies, building brand trust, and different approaches for achieving higher privacy competence scores.
See how organizational priorities and strategic approaches to data security and privacy are evolving around the globe.
This webinar will review:
- The top 10 privacy insights from the fifth annual Global Privacy Benchmarks Survey
- The top challenges for privacy leaders, practitioners, and organizations in 2024
- Key themes to consider in developing and maintaining your privacy program
Goodbye Windows 11: Make Way for Nitrux Linux 3.5.0!SOFTTECHHUB
As the digital landscape continually evolves, operating systems play a critical role in shaping user experiences and productivity. The launch of Nitrux Linux 3.5.0 marks a significant milestone, offering a robust alternative to traditional systems such as Windows 11. This article delves into the essence of Nitrux Linux 3.5.0, exploring its unique features, advantages, and how it stands as a compelling choice for both casual users and tech enthusiasts.
Dr. Sean Tan, Head of Data Science, Changi Airport Group
Discover how Changi Airport Group (CAG) leverages graph technologies and generative AI to revolutionize their search capabilities. This session delves into the unique search needs of CAG’s diverse passengers and customers, showcasing how graph data structures enhance the accuracy and relevance of AI-generated search results, mitigating the risk of “hallucinations” and improving the overall customer journey.
UiPath Test Automation using UiPath Test Suite series, part 6DianaGray10
Welcome to UiPath Test Automation using UiPath Test Suite series part 6. In this session, we will cover Test Automation with generative AI and Open AI.
UiPath Test Automation with generative AI and Open AI webinar offers an in-depth exploration of leveraging cutting-edge technologies for test automation within the UiPath platform. Attendees will delve into the integration of generative AI, a test automation solution, with Open AI advanced natural language processing capabilities.
Throughout the session, participants will discover how this synergy empowers testers to automate repetitive tasks, enhance testing accuracy, and expedite the software testing life cycle. Topics covered include the seamless integration process, practical use cases, and the benefits of harnessing AI-driven automation for UiPath testing initiatives. By attending this webinar, testers, and automation professionals can gain valuable insights into harnessing the power of AI to optimize their test automation workflows within the UiPath ecosystem, ultimately driving efficiency and quality in software development processes.
What will you get from this session?
1. Insights into integrating generative AI.
2. Understanding how this integration enhances test automation within the UiPath platform
3. Practical demonstrations
4. Exploration of real-world use cases illustrating the benefits of AI-driven test automation for UiPath
Topics covered:
What is generative AI
Test Automation with generative AI and Open AI.
UiPath integration with generative AI
Speaker:
Deepak Rai, Automation Practice Lead, Boundaryless Group and UiPath MVP
Driving Business Innovation: Latest Generative AI Advancements & Success StorySafe Software
Are you ready to revolutionize how you handle data? Join us for a webinar where we’ll bring you up to speed with the latest advancements in Generative AI technology and discover how leveraging FME with tools from giants like Google Gemini, Amazon, and Microsoft OpenAI can supercharge your workflow efficiency.
During the hour, we’ll take you through:
Guest Speaker Segment with Hannah Barrington: Dive into the world of dynamic real estate marketing with Hannah, the Marketing Manager at Workspace Group. Hear firsthand how their team generates engaging descriptions for thousands of office units by integrating diverse data sources—from PDF floorplans to web pages—using FME transformers, like OpenAIVisionConnector and AnthropicVisionConnector. This use case will show you how GenAI can streamline content creation for marketing across the board.
Ollama Use Case: Learn how Scenario Specialist Dmitri Bagh has utilized Ollama within FME to input data, create custom models, and enhance security protocols. This segment will include demos to illustrate the full capabilities of FME in AI-driven processes.
Custom AI Models: Discover how to leverage FME to build personalized AI models using your data. Whether it’s populating a model with local data for added security or integrating public AI tools, find out how FME facilitates a versatile and secure approach to AI.
We’ll wrap up with a live Q&A session where you can engage with our experts on your specific use cases, and learn more about optimizing your data workflows with AI.
This webinar is ideal for professionals seeking to harness the power of AI within their data management systems while ensuring high levels of customization and security. Whether you're a novice or an expert, gain actionable insights and strategies to elevate your data processes. Join us to see how FME and AI can revolutionize how you work with data!
Cosa hanno in comune un mattoncino Lego e la backdoor XZ?Speck&Tech
ABSTRACT: A prima vista, un mattoncino Lego e la backdoor XZ potrebbero avere in comune il fatto di essere entrambi blocchi di costruzione, o dipendenze di progetti creativi e software. La realtà è che un mattoncino Lego e il caso della backdoor XZ hanno molto di più di tutto ciò in comune.
Partecipate alla presentazione per immergervi in una storia di interoperabilità, standard e formati aperti, per poi discutere del ruolo importante che i contributori hanno in una comunità open source sostenibile.
BIO: Sostenitrice del software libero e dei formati standard e aperti. È stata un membro attivo dei progetti Fedora e openSUSE e ha co-fondato l'Associazione LibreItalia dove è stata coinvolta in diversi eventi, migrazioni e formazione relativi a LibreOffice. In precedenza ha lavorato a migrazioni e corsi di formazione su LibreOffice per diverse amministrazioni pubbliche e privati. Da gennaio 2020 lavora in SUSE come Software Release Engineer per Uyuni e SUSE Manager e quando non segue la sua passione per i computer e per Geeko coltiva la sua curiosità per l'astronomia (da cui deriva il suo nickname deneb_alpha).
3. SAS stands for Statistical Analysis Software. It was created in the year 1960 by the SAS Institute.
From 1st January 1960, SAS was used in
• Data management
• Business intelligence
• Predictive Analysis
• Descriptive Analysis
• Prescriptive Analysis
5. SAS is basically worked on large datasets. With the help of SAS software you can perform various
operations on the data like
• Data Management
• Statistical Analysis
• Report formation with perfect graphics
• Business Planning
• Operations Research and project Management
• Quality Improvement
• Application Development
• Data extraction
• Data transformation
• Data updating and modification
7. Sr. No SAS Component & their Usage
1
Base SAS
It is a core component which contains data management facility and a programming
language for data analysis. It is also the most widely used.
2 SAS/GRAPH
Create graphs, presentations for better understanding and showcasing the result in a
proper format.
3 SAS/STAT
Perform Statistical analysis with the variance analysis, regression, multivariate analysis,
survival analysis, and psychometric analysis, mixed model analysis.
4 SAS/OR
Operations research.
5 SAS/ETS
Econometrics and Time Series Analysis.
6 SAS/Enterprise Miner
Data mining.
25. SAS Variable Names
• It can be maximum 32 characters long.
• It can not include blanks.
• It must start with the letters A through Z (not case sensitive) or an underscore (_).
• Can include numbers but not as the first character.
• Variable names are case insensitive.
26. SAS Data Set
The DATA statement marks the creation of a new SAS data set. The rules for DATA set creation are as below.
• A single word after the DATA statement indicates a temporary data set name. Which means the data set gets
erased at the end of the session.
• The data set name can be prefixed with a library name which makes it a permanent data set. Which means the
data set persists after the session is over.
• If the SAS data set name is omitted then SAS creates a temporary data set with a name generated by SAS like -
DATA1, DATA2 etc.
27. The SAS programs, data files and the results of the programs are saved with various extensions in windows.
• .sas − It represents the SAS code file which can be edited using the SAS Editor or any text editor.
• .log − It represents the SAS Log File it contains information such as errors, warnings, and data set details for a
submitted SAS program.
• .mht / *.html −It represents the SAS Results file.
• .sas7bdat −It represents SAS Data File which contains a SAS data set including variable names, labels, and the results
of calculations.
SAS File Extensions
28. Comments in SAS
Following is a multiline comment example −
/*message*/ type comment
A comment in the form of /*message*/ is used more frequently and it can not be nested. But it can span multiple
lines and can be of any length. Following is a single line comment example
30. PROC Step
This step involves invoking a SAS built-in procedure to analyze the data.
Example
The below example shows using the MEANS procedure to print the mean values of the numeric variables in the data
set.
32. String Functions
SUBSTRN
This function extracts a substring using the start and end positions. In case of no end position is mentioned it extracts all
the characters till end of the string.
37. Input Methods
The input methods are used to read the raw data. The raw data may be from an external source or from in
stream datalines. The input statement creates a variable with the name that you assign to each field. So you
have to create a variable in the Input Statement. The same variable will be shown in the output of SAS
Dataset. Below are different input methods available in SAS.
• List Input Method
• Named Input Method
• Column Input Method
• Formatted Input Method
43. SAS can read data from various sources which includes many file formats. The file formats used in SAS environment is
discussed below.
• ASCII(Text) Data Set
• Delimited Data
• Excel Data
• Hierarchical Data
Reading ASCII(Text) Data Set
47. Similar to reading datasets, SAS can write datasets in different formats. It can write data from SAS files to normal text
file. These files can be read by other software programs. SAS uses PROC EXPORT to write data sets.
PROC EXPORT
It is a SAS inbuilt procedure used to export the SAS data sets for writing the data into files of different formats.
Syntax
The basic syntax for writing the procedure in SAS is −
48. Following is the description of the parameters used −
•SAS data-set is the data set name which is being exported. SAS can share the data sets from its environment with
other applications by creating files which can be read by different operating systems. It uses the inbuilt EXPORT
function to out the data set files in a variety of formats. In this chapter we will see the writing of SAS data sets using
proc export along with the options dlm and dbms.
•SAS data-set-options is used to specify a subset of columns to be exported.
•filename is the name of the file to which the data is written into.
•identifier is used to mention the delimiter that will be written into the file.
•LABEL option is used to mention the name of the variables written to the file.
49. On executing the above code we can see the output as a text file and right click on it to see its content as shown below.
50. In order to write a comma delimited file we can use the dlm option with a value "csv". The following code writes the file
car_data.csv.
Writing a CSV file
On executing the above code we get the below output.
51. Concatenate Data Sets
Multiple SAS data sets can be concatenated to give a single data set using the SET statement. The total number of
observations in the concatenated data set is the sum of the number of observations in the original data sets. The order of
observations is sequential. All observations from the first data set are followed by all observations from the second data
set, and so on.
Ideally all the combining data sets have same variables, but in case they have different number of variables, then in the
result all the variables appear, with missing values for the smaller data set.
Syntax
The basic syntax for SET statement in SAS is −
54. SAS offers extensive support to most of the popular relational databases by using SQL queries inside SAS programs. Most
of the ANSI SQL syntax is supported. The procedure PROC SQL is used to process the SQL statements. This procedure can
not only give back the result of an SQL query, it can also create SAS tables & variables. The example of all these scenarios
is described below.
Syntax
The basic syntax for using PROC SQL in SAS is −
55. SQL Create Operation
Using SQL we can create new data set form raw data. In the below example, first we declare a data set named TEMP
containing the raw data. Then we write a SQL query to create a table from the variables of this data set.
56. When the above code is executed we get the following result −
57. SQL Read Operation
The Read operation in SQL involves writing SQL SELECT queries to read the data from the tables. In The below program
queries the SAS data set named CARS available in the library SASHELP. The query fetches some of the columns of the data
set.
58.
59. SQL SELECT with WHERE Clause
The below program queries the CARS data set with a where clause. In the result we get only the observation which have
make as 'Audi' and type as 'Sports'.
60. SQL UPDATE Operation
We can update the SAS table using the SQL Update statement. Below we first create a new table named EMPLOYEES2
and then update it using the SQL UPDATE statement.
61. SQL DELETE Operation
The delete operation in SQL involves removing certain values from the table using the SQL DELETE statement. We continue
to use the data from the above example and delete the rows from the table in which the salary of the employees is greater
than 900.
63. The output from a SAS program can be converted to more user friendly forms like .html or PDF. This is done by using
the ODS statement available in SAS. ODS stands for output delivery system. It is mostly used to format the output
data of a SAS program to nice reports which are good to look at and understand. That also helps sharing the output
with other platforms and soft wares. It can also combine the results from multiple PROC statements in one single
file.
Syntax
The basic syntax for using the ODS statement in SAS is −
64. Following is the description of the parameters used −
•PATH represents the statement used in case of HTML output.
In other types of output we include the path in the filename.
•Style represents one of the in-built styles available in the SAS
environment.
65. Creating HTML Output
We create HTML output using the ODS HTML statement.In the below example we create a html file in our desired path.
We apply a style available in the styles library. We can see the output file in the mentioned path and we can download it
to save in an environment different from the SAS environment. Please note that we have two proc SQL statements and
both their output is captured into a single file.
66. When the above code is executed we get the following result −
67. Creating PDF Output
In the below example we create a PDF file in our desired path. We apply a style available in the styles library. We can see
the output file in the mentioned path and we can download it to save in an environment different from the SAS
environment. Please note that we have two proc SQL statements and both their output is captured into a single file.
68. When the above code is executed we get the following result −
69. Creating TRF(Word) Output
In the below example we create a RTF file in our desired path. We apply a style available in the styles library. We can see the
output file in the mentioned path and we can download it to save in an environment different from the SAS environment.
Please note that we have two proc SQL statements and both their output is captured into a single file.
70. When the above code is executed we get the following result −
72. A Histogram is graphical display of data using bars of different heights. It groups the various numbers in
the data set into many ranges. It also represents the estimation of the probability of distribution of a
continuous variable. In SAS the PROC UNIVARIATE is used to create histograms with the below options.
Syntax
The basic syntax to create a histogram in SAS is −
Following is the description of parameters used −
•DATASET is the name of the dataset used.
•variables are the values used to plot the histogram.
73. Example
In the below example, we consider the minimum and maximum values of the variable horsepower and take a range of
50. So the values form a group in steps of 50.
74.
75. Histogram with Curve Fitting
We can fit some distribution curves into the histogram using additional options.
Example
In the below example we fit a distribution curve with mean and standard deviation values mentioned as EST. This option
uses and estimate of the parameters.
76.
77. Simple Bar chart
A simple bar chart is a bar chart in which a variable from the dataset is represented as bars.
Example
The below script will create a bar-chart representing the length of cars as bars.
78.
79. Stacked Bar chart
A stacked bar chart is a bar chart in which a variable from the dataset is calculated with respect to another variable.
Example
The below script will create a stacked bar-chart where the length of the cars are calculated for each car type. We use the
group option to specify the second variable.
80.
81. Clustered Bar chart
The clustered bar chart is created to show how the values of a variable are spread across a culture.
Example
The below script will create a clustered bar-chart where the length of the cars is clustered around the car type.So we see two
adjacent bars at length 191, one for the car type 'Sedan' and another for the car type 'Wagon'.
82.
83. Simple Pie Chart
In this pie chart we take a single variable form the dataset. The pie chart is created with value of the slices representing the
fraction of the count of the variable with respect to the total value of the variable.
Example
In the below example each slice represents the fraction of the type of car from the total number of cars.
84.
85. Pie Chart with Data Labels
In this pie chart we represent both the fractional value as well as the percentage value for each slice. We also change the
location of the label to be inside the chart. The style of appearance of the chart is modified by using the DATASKIN option. It
uses one of the inbuilt styles, available in the SAS environment.
86.
87. Grouped Pie Chart
In this pie chart the value of the variable presented in the graph is grouped with respect to another variable of the same
data set. Each group becomes one circle and the chart has as many concentric circles as the number of groups available.
Example
In the below example we group the chart with respect to the variable named "Make". As there are two values available
("Audi" and "BMW") so we get two concentric circles each representing slices of car types in its own make.
90. The arithmetic mean is the value obtained by summing value of numeric variables and then dividing the sum with the
number of variables. It is also called Average. In SAS arithmetic mean is calculated using PROC MEANS. Using this SAS
procedure we can find the mean of all variables or some variables of a dataset. We can also form groups and find mean
of variables of values specific to that group
Syntax
The basic syntax for calculating arithmetic mean in SAS is −
Following is the description of parameters used −
•DATASET − is the name of the dataset used.
•Variables − are the name of the variable from the dataset.
91. Mean of a Dataset
The mean of each of the numeric variable in a dataset is calculated by using the PROC by supplying only the dataset name
without any variables.
Example
In the below example we find the mean of all the numeric variables in the SAS dataset named CARS. We specify the
maximum digits after decimal place to be 2 and also find the sum of those variables.
92.
93. Mean of Select Variables
We can get the mean of some of the variables by supplying their names in the var option.
Example
In the below we calculate the mean of three variables.
94. Mean by Class
We can find the mean of the numeric variables by organizing them to groups by using some other variables.
Example
In the example below we find the mean of the variable horsepower for each type under each make of the car.
95.
96. Standard deviation (SD) is a measure of how varied is the data in a data set. Mathematically it measures how distant
or close are each value to the mean value of a data set. A standard deviation value close to 0 indicates that the data
points tend to be very close to the mean of the data set and a high standard deviation indicates that the data points
are spread out over a wider range of values
In SAS the SD values is measured using PROC MEAN as well as PROC SURVEYMEANS.
Using PROC MEANS
To measure the SD using proc means we choose the STD option in the PROC step. It brings out the SD values for each
numeric variable present in the data set.
Syntax
The basic syntax for calculating standard deviation in SAS is −
Following is the description of the parameters used −
•Dataset − is the name of the dataset.
97. Example
In the below example we create the data set CARS1 form the CARS data set in the SASHELP library. We choose the STD
option with the PROC means step.
98.
99. A frequency distribution is a table showing the frequency of the data points in a data set. Each entry in the table contains
the frequency or count of the occurrences of values within a particular group or interval, and in this way, the table
summarizes the distribution of values in the sample.
SAS provides a procedure called PROC FREQ to calculate the frequency distribution of data points in a data set.
Syntax
The basic syntax for calculating frequency distribution in SAS is −
Following is the description of the parameters used −
•Dataset is the name of the dataset.
•Variables_1 is the variable names of the dataset whose frequency distribution needs to be calculated.
•Variables_2 is the variables which categorised the frequency distribution result.
100. Single Variable Frequency Distribution
We can determine the frequency distribution of a single variable by using PROC FREQ. In this case the result will show the
frequency of each value of the variable. The result also shows the percentage distribution, cumulative frequency and
cumulative percentage.
Example
In the below example we find the frequency distribution of the variable horsepower for the dataset named CARS1 which is
created form the library SASHELP.CARS. We can see the result divided into two categories of results. One for each make of
the car.
101.
102. Multiple Variable Frequency Distribution
We can find the frequency distributions for multiple variables which groups them into all possible combinations.
Example
In the below example we calculate the frequency distribution for the make of a car for grouped by car type and also the
frequency distribution of each type of car grouped by each make.
103. Cross tabulation involves producing cross tables also called contingent tables using all possible combinations of two or
more variables. In SAS it is created using PROC FREQ along with the TABLES option. For example - if we need the
frequency of each model for each make in each car type category, then we need to use the TABLES option of PROC FREQ.
Syntax
The basic syntax for applying cross tabulation in SAS is −
Following is the description of the parameters used −
•Dataset is the name of the dataset.
•Variable_1 and Variable_2 are the variable names of the dataset whose frequency distribution needs to be calculated.
104. Example
Consider the case of finding how many car types are available under each car brand from the dataset cars1 which is
created form SASHELP.CARS as shown below. In this case we need the individual frequency values as well as the sum of
the frequency values across the makes and across the types. We can observer that the result shows values across the
rows and the columns.
105.
106. The T-tests are performed to compute the confidence limits for one sample or two independent samples by comparing
their means and mean differences. The SAS procedure named PROC TTEST is used to carry out t tests on a single variable
and pair of variables.
Syntax
The basic syntax for applying PROC TTEST in SAS is −
Following is the description of the parameters used −
•Dataset is the name of the dataset.
•Variable_1 and Variable_2 are the variable names of the dataset used in t test.
107. Example
Below we see one sample t test in which find the t test estimation for the variable horsepower with 95 percent confidence
limits.
108.
109. Correlation analysis deals with relationships among variables. The correlation coefficient is a measure of linear
association between two variables.Values of the correlation coefficient are always between -1 and +1. SAS provides the
procedure PROC CORR to find the correlation coefficients between a pair of variables in a dataset.
Syntax
The basic syntax for applying PROC CORR in SAS is −
Following is the description of the parameters used −
•Dataset is the name of the dataset.
•Options is the additional option with procedure like plotting a matrix etc.
•Variable is the variable name of the dataset used in finding the correlation.
110. Example
Correlation coefficients between a pair of variables available in a dataset can be obtained by use their names in the VAR
statement.In the below example we use the dataset CARS1 and get the result showing the correlation coefficients
between horsepower and weight.
111.
112. Correlation Between All Variables
Correlation coefficients between all the variables available in a dataset can be obtained by simply applying the procedure
with the dataset name.
Example
In the below example we use the dataset CARS1 and get the result showing the correlation coefficients between each pair
of the variables.
113.
114. Linear Regression is used to identify the relationship between a dependent variable and one or more independent
variables. A model of the relationship is proposed, and estimates of the parameter values are used to develop an
estimated regression equation.
Various tests are then used to determine if the model is satisfactory. If it is then, the estimated regression equation can
be used to predict the value of the dependent variable given values for the independent variables. In SAS the procedure
PROC REG is used to find the linear regression model between two variables.
Syntax
The basic syntax for applying PROC REG in SAS is −
Following is the description of the parameters used −
•Dataset is the name of the dataset.
•variable_1 and variable_2 are the variable names of the dataset used in finding the correlation.
115. Example
The below example shows the process to find the correlation between the two variables horsepower and weight of a car
by using PROC REG. In the result we see the intercept values which can be used to form the regression equation.
The below example shows a simple case of naming the data set, defining the variables, creating new variables and entering the data. Here the string variables have a $ at the end and numeric values are without it.
Following is the description of the parameters used −
data-set1,data-set2 are dataset names written one after another.