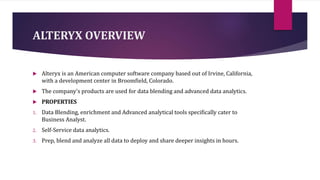
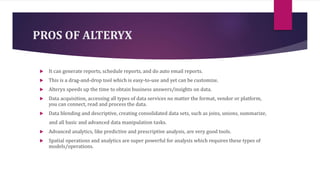
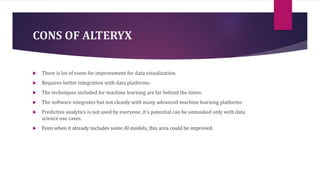
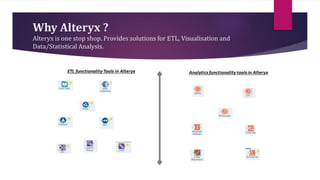
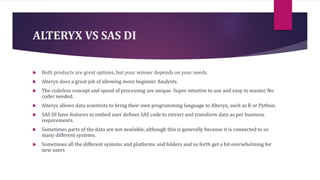
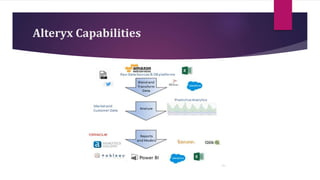
Alteryx is an American software company specializing in data blending and advanced analytics, aimed primarily at business analysts through its self-service tools. It offers several advantages including user-friendly drag-and-drop functionality, robust data acquisition capabilities, and advanced analytics features, though it has limitations in data visualization and machine learning integration. Alteryx is seen as an all-in-one solution for ETL, visualization, and statistical analysis, making it attractive compared to competitors like SAS DI.
INDEX
ALTERYX OVERVIEW
PROS OF ALTERYX
CONS OF ALTERYX
Why Alteryx ?
Alteryx vs SAS DI
ETL Transformation Workflow
Reporting Tools Work Flow
Data Cleaning tools Transformation
3.
ALTERYX OVERVIEW
Alteryxis an American computer software company based out of Irvine, California,
with a development center in Broomfield, Colorado.
The company's products are used for data blending and advanced data analytics.
PROPERTIES
1. Data Blending, enrichment and Advanced analytical tools specifically cater to
Business Analyst.
2. Self-Service data analytics.
3. Prep, blend and analyze all data to deploy and share deeper insights in hours.
4.
PROS OF ALTERYX
It can generate reports, schedule reports, and do auto email reports.
This is a drag-and-drop tool which is easy-to-use and yet can be customize.
Alteryx speeds up the time to obtain business answers/insights on data.
Data acquisition, accessing all types of data services no matter the format, vendor or platform,
you can connect, read and process the data.
Data blending and descriptive, creating consolidated data sets, such as joins, unions, summarize,
and all basic and advanced data manipulation tasks.
Advanced analytics, like predictive and prescriptive analysis, are very good tools.
Spatial operations and analytics are super powerful for analysis which requires these types of
models/operations.
5.
CONS OF ALTERYX
There is lot of room for improvement for data visualization.
Requires better integration with data platforms.
The techniques included for machine learning are far behind the times.
The software integrates but not cleanly with many advanced machine learning platforms
Predictive analytics is not used by everyone, it's potential can be unmasked only with data
science use cases.
Even when it already includes some AI models, this area could be improved.
6.
Why Alteryx ?
•SingleAnalytic Experience
•Drag and Drop Workflow
•Advance Data Modelling
•Spatial Analysis
•Visual competence
•Sharing
7.
Why Alteryx ?
Alteryxis one stop shop. Provides solutions for ETL, Visualisation and
Data/Statistical Analysis.
8.
ALTERYX VS SASDI
Both products are great options, but your winner depends on your needs.
Alteryx does a great job of allowing more beginner Analysts.
The codeless concept and speed of processing are unique. Super intuitive to use and easy to master. No
coder needed.
Alteryx allows data scientists to bring their own programming language to Alteryx, such as R or Python.
SAS DI have features to embed user defines SAS code to extract and transform data as per business
requirements.
Sometimes parts of the data are not available, although this is generally because it is connected to so
many different systems.
Sometimes all the different systems and platforms and folders and so forth get a bit overwhelming for
new users
9.
ETL Transformations
Cross –Transpose Tool Summarize Tool
Fuzzy Match Tool
Running Total Tool Random Sample Count Tool
10.
Tools Description
Cross-Tab- Pivot the orientation of the data stream so that vertical fields are on the horizontal
axis, summarized where specified.
Transpose Tool - Pivot the orientation of the data stream so that horizontal fields are on the
vertical axis.
Fuzzy Match - Identify non-identical duplicates in a data stream.
Summarize Tool - Summarize data by grouping, summing, counting, spatial processing, string
concatenation, and much more.
Running Total - Calculate a cumulative sum per record in a data stream.
Random Sample - Generate a random number or percentage of records passing through the
data stream.
Tools Description
Table- Create a data table for output via the Render tool.
Charting - Create a chart (Area, Column, Bar, Line, Pie, etc.) for output via the Render tool.
Report Header - Add a header to a report for output via the Render tool.
Report Footer - Add a footer to a report for output via the Render tool.
Report Text -Add and customize text for output via the Render tool.
Layout - Arrange two or more reporting snippets horizontally or vertically for output via the
Render tool.
Tools Description
DataCleansing - The Data Cleansing tool performs basic data cleansing operations
such as replacing null values, removing punctuation, and modifying capitalization.
Append Fields - Append the fields from a source input to every record of a target
input. Each record of the target input will be duplicated for every record in the
source input.
Find and Replace - Search for data in one field from one data stream and replace it
with a specified field from a different stream. Similar to an Excel VLOOKUP.
Imputation - Update specific values in a numeric data field with another selected
value. Useful for replacing NULL() values.