Download as PDF, PPTX

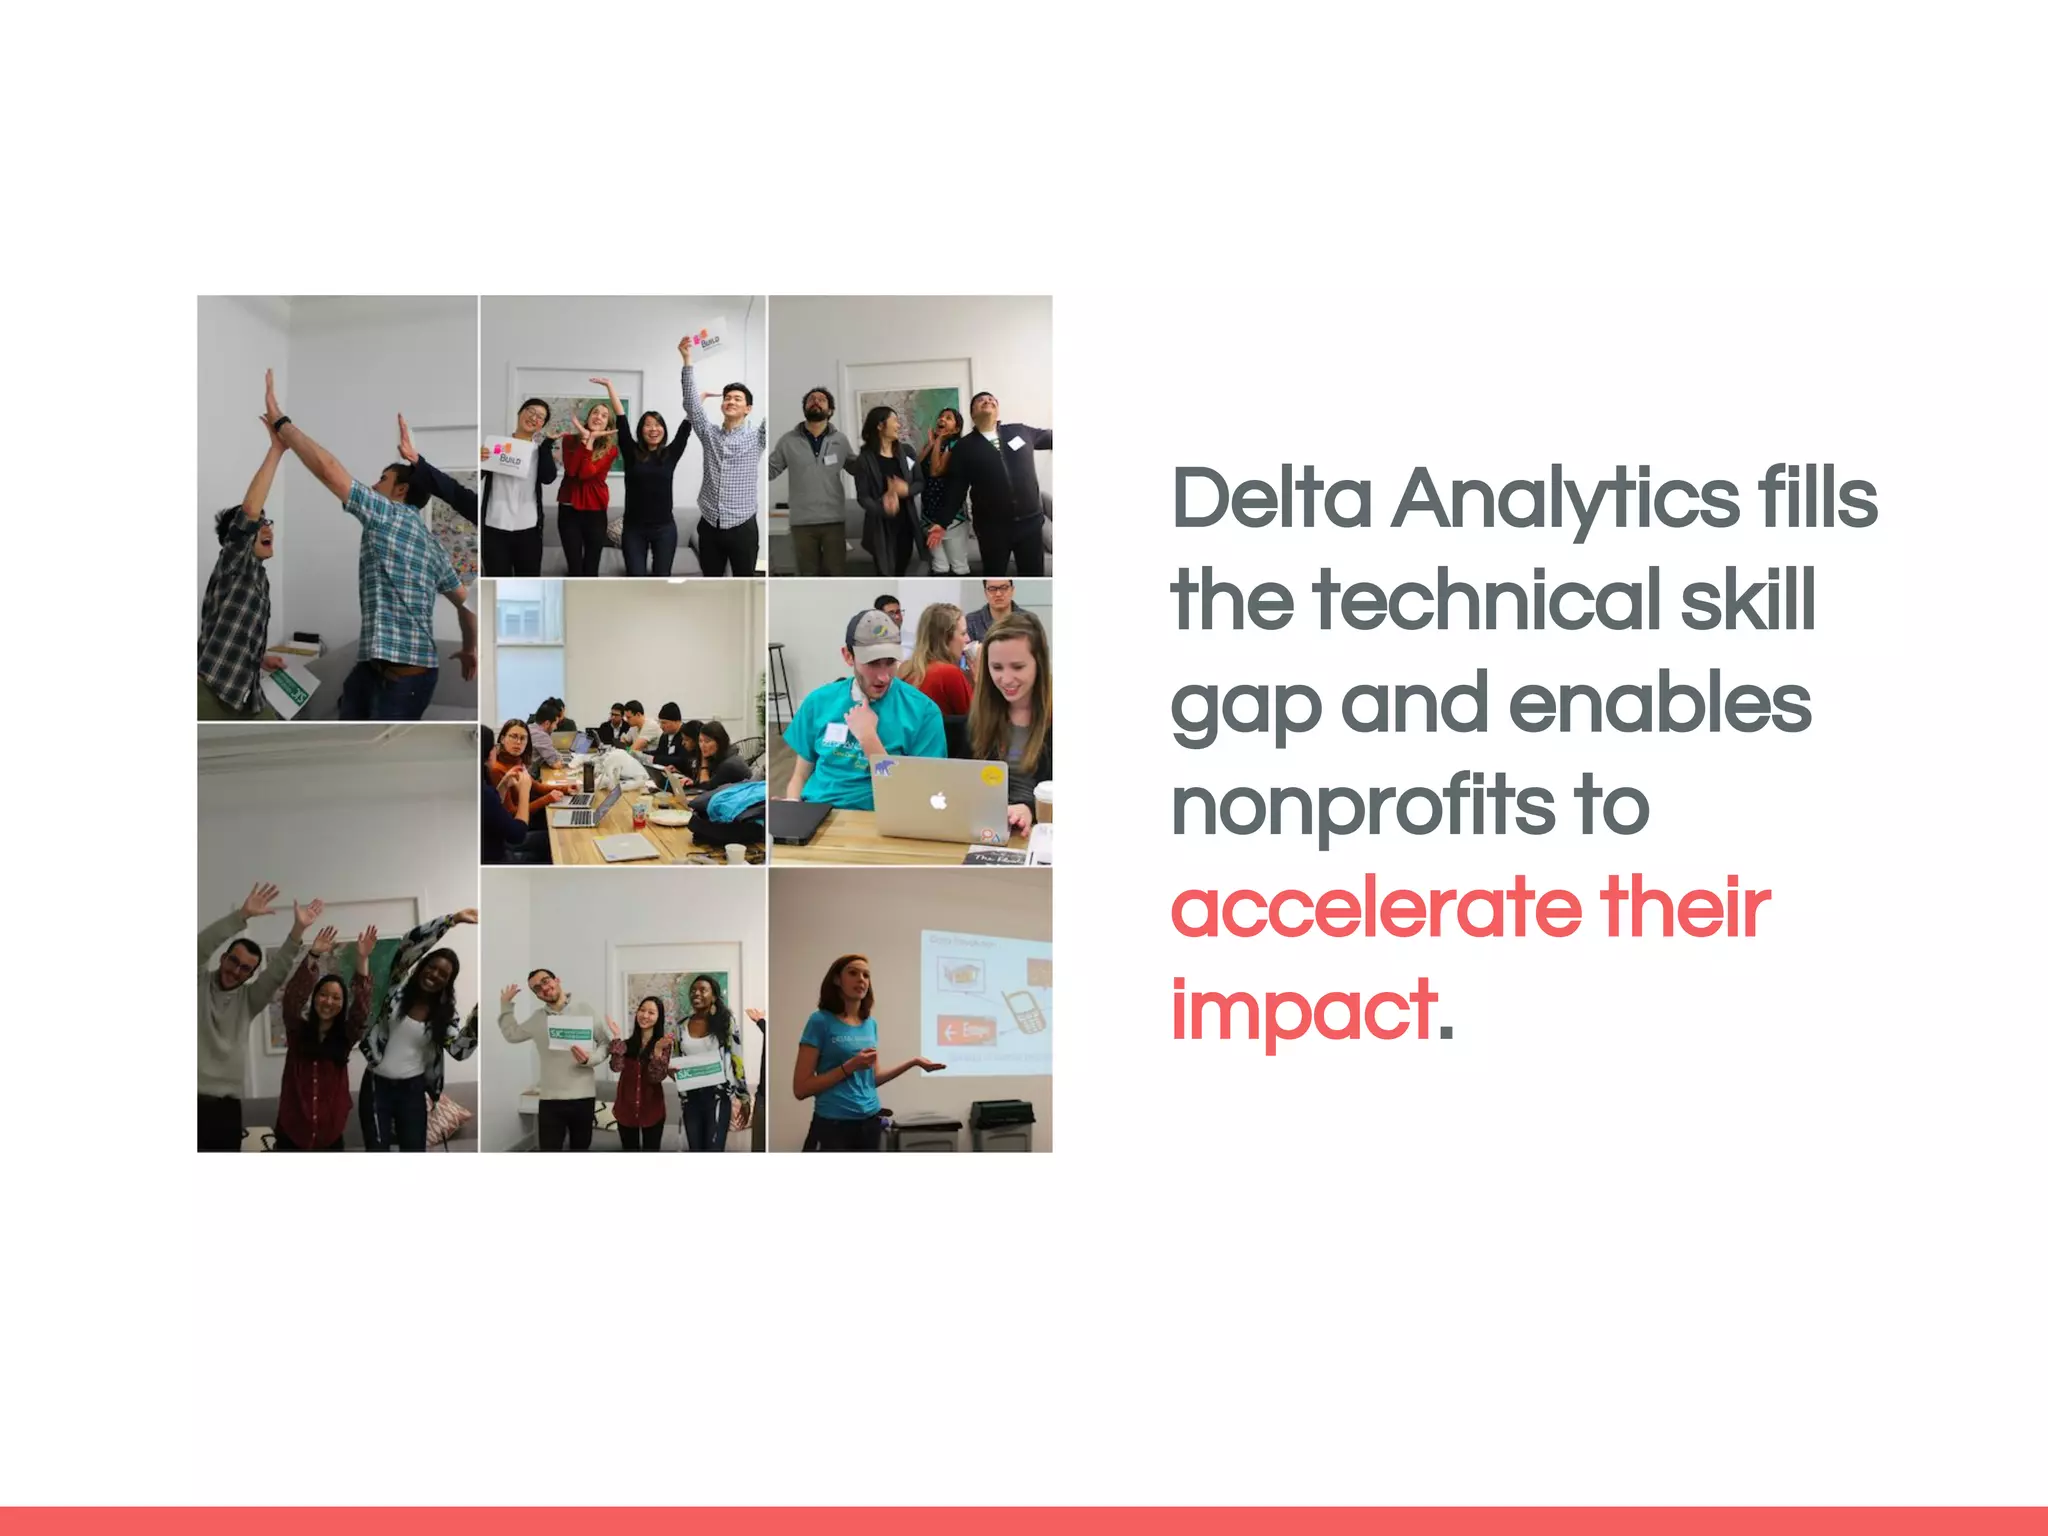
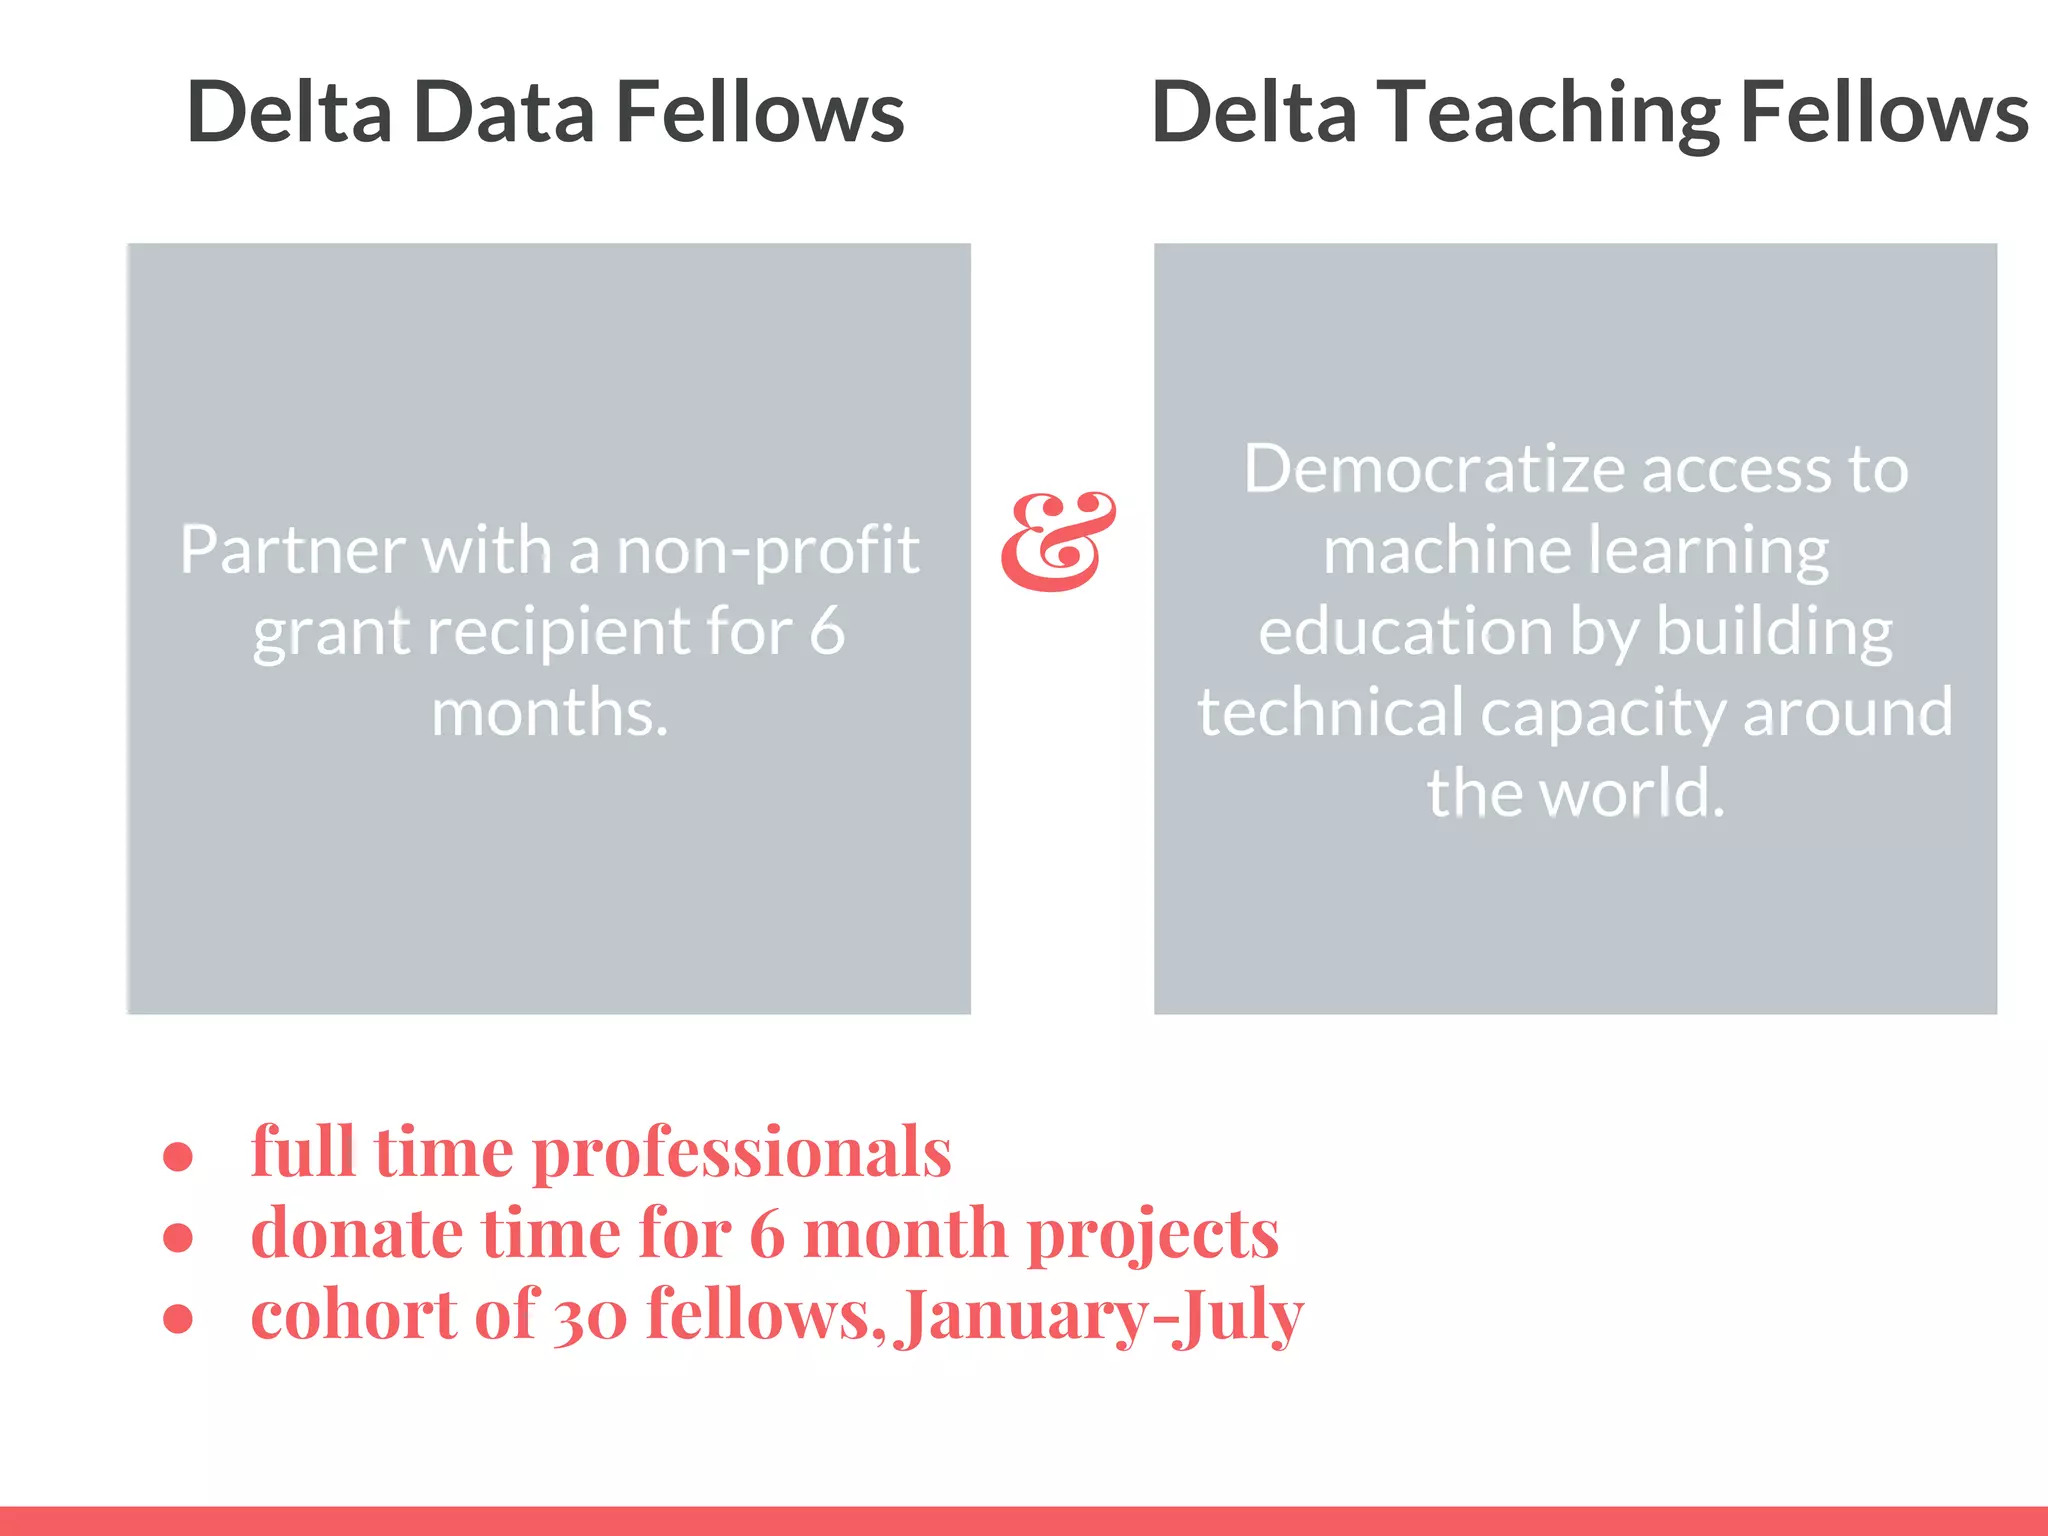
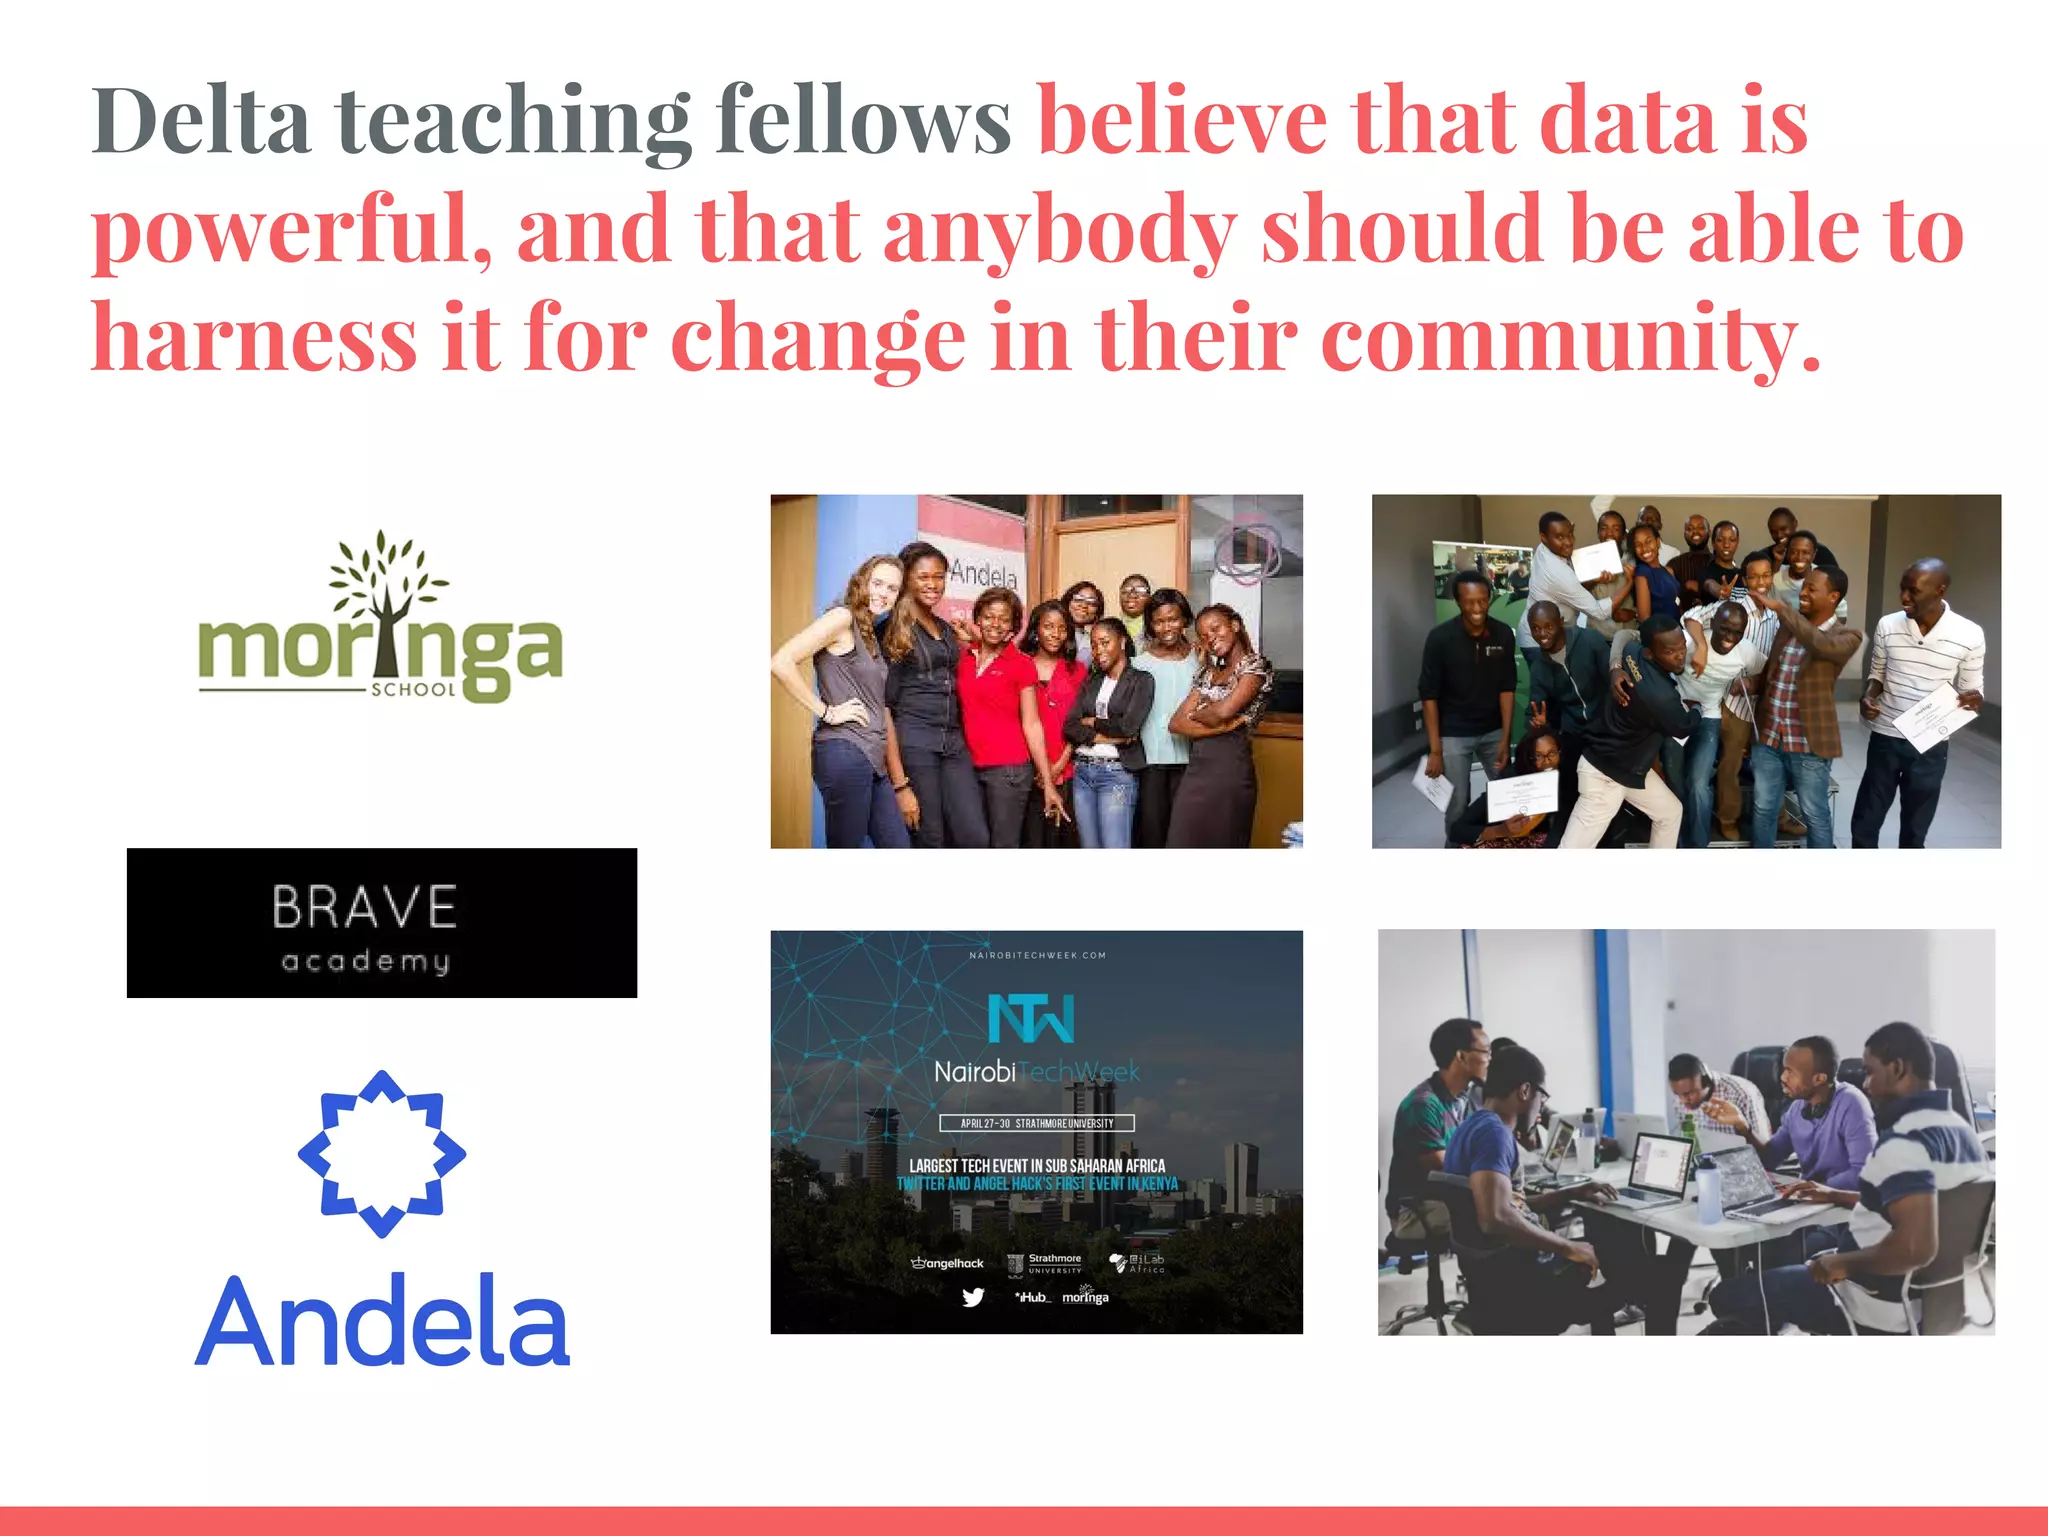
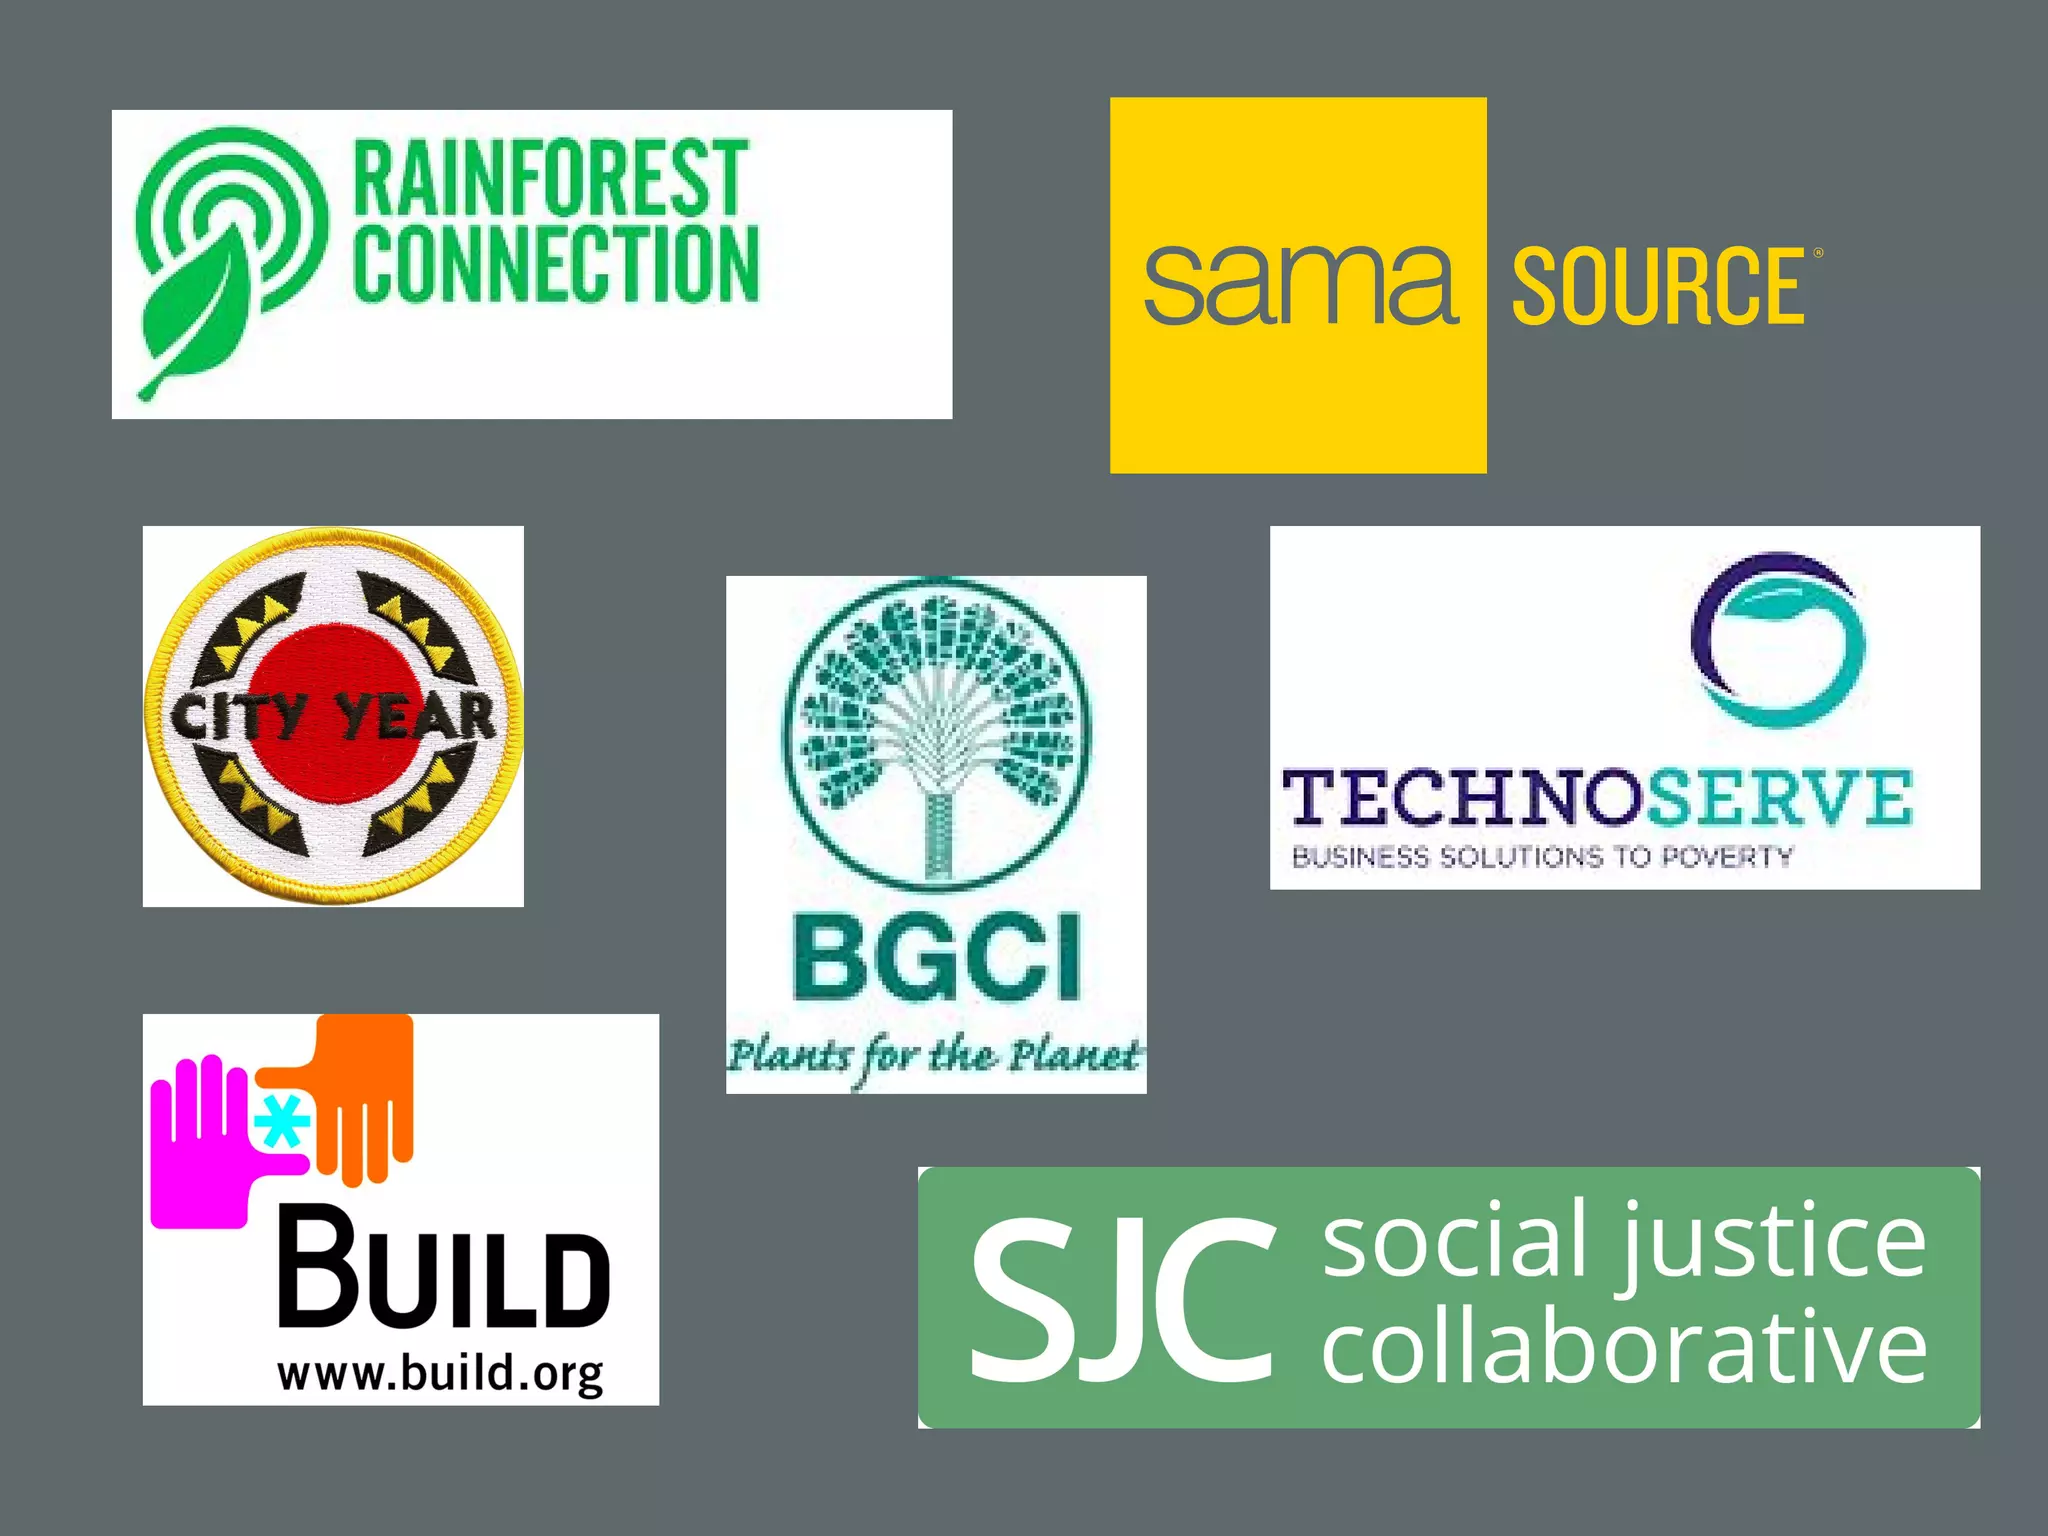
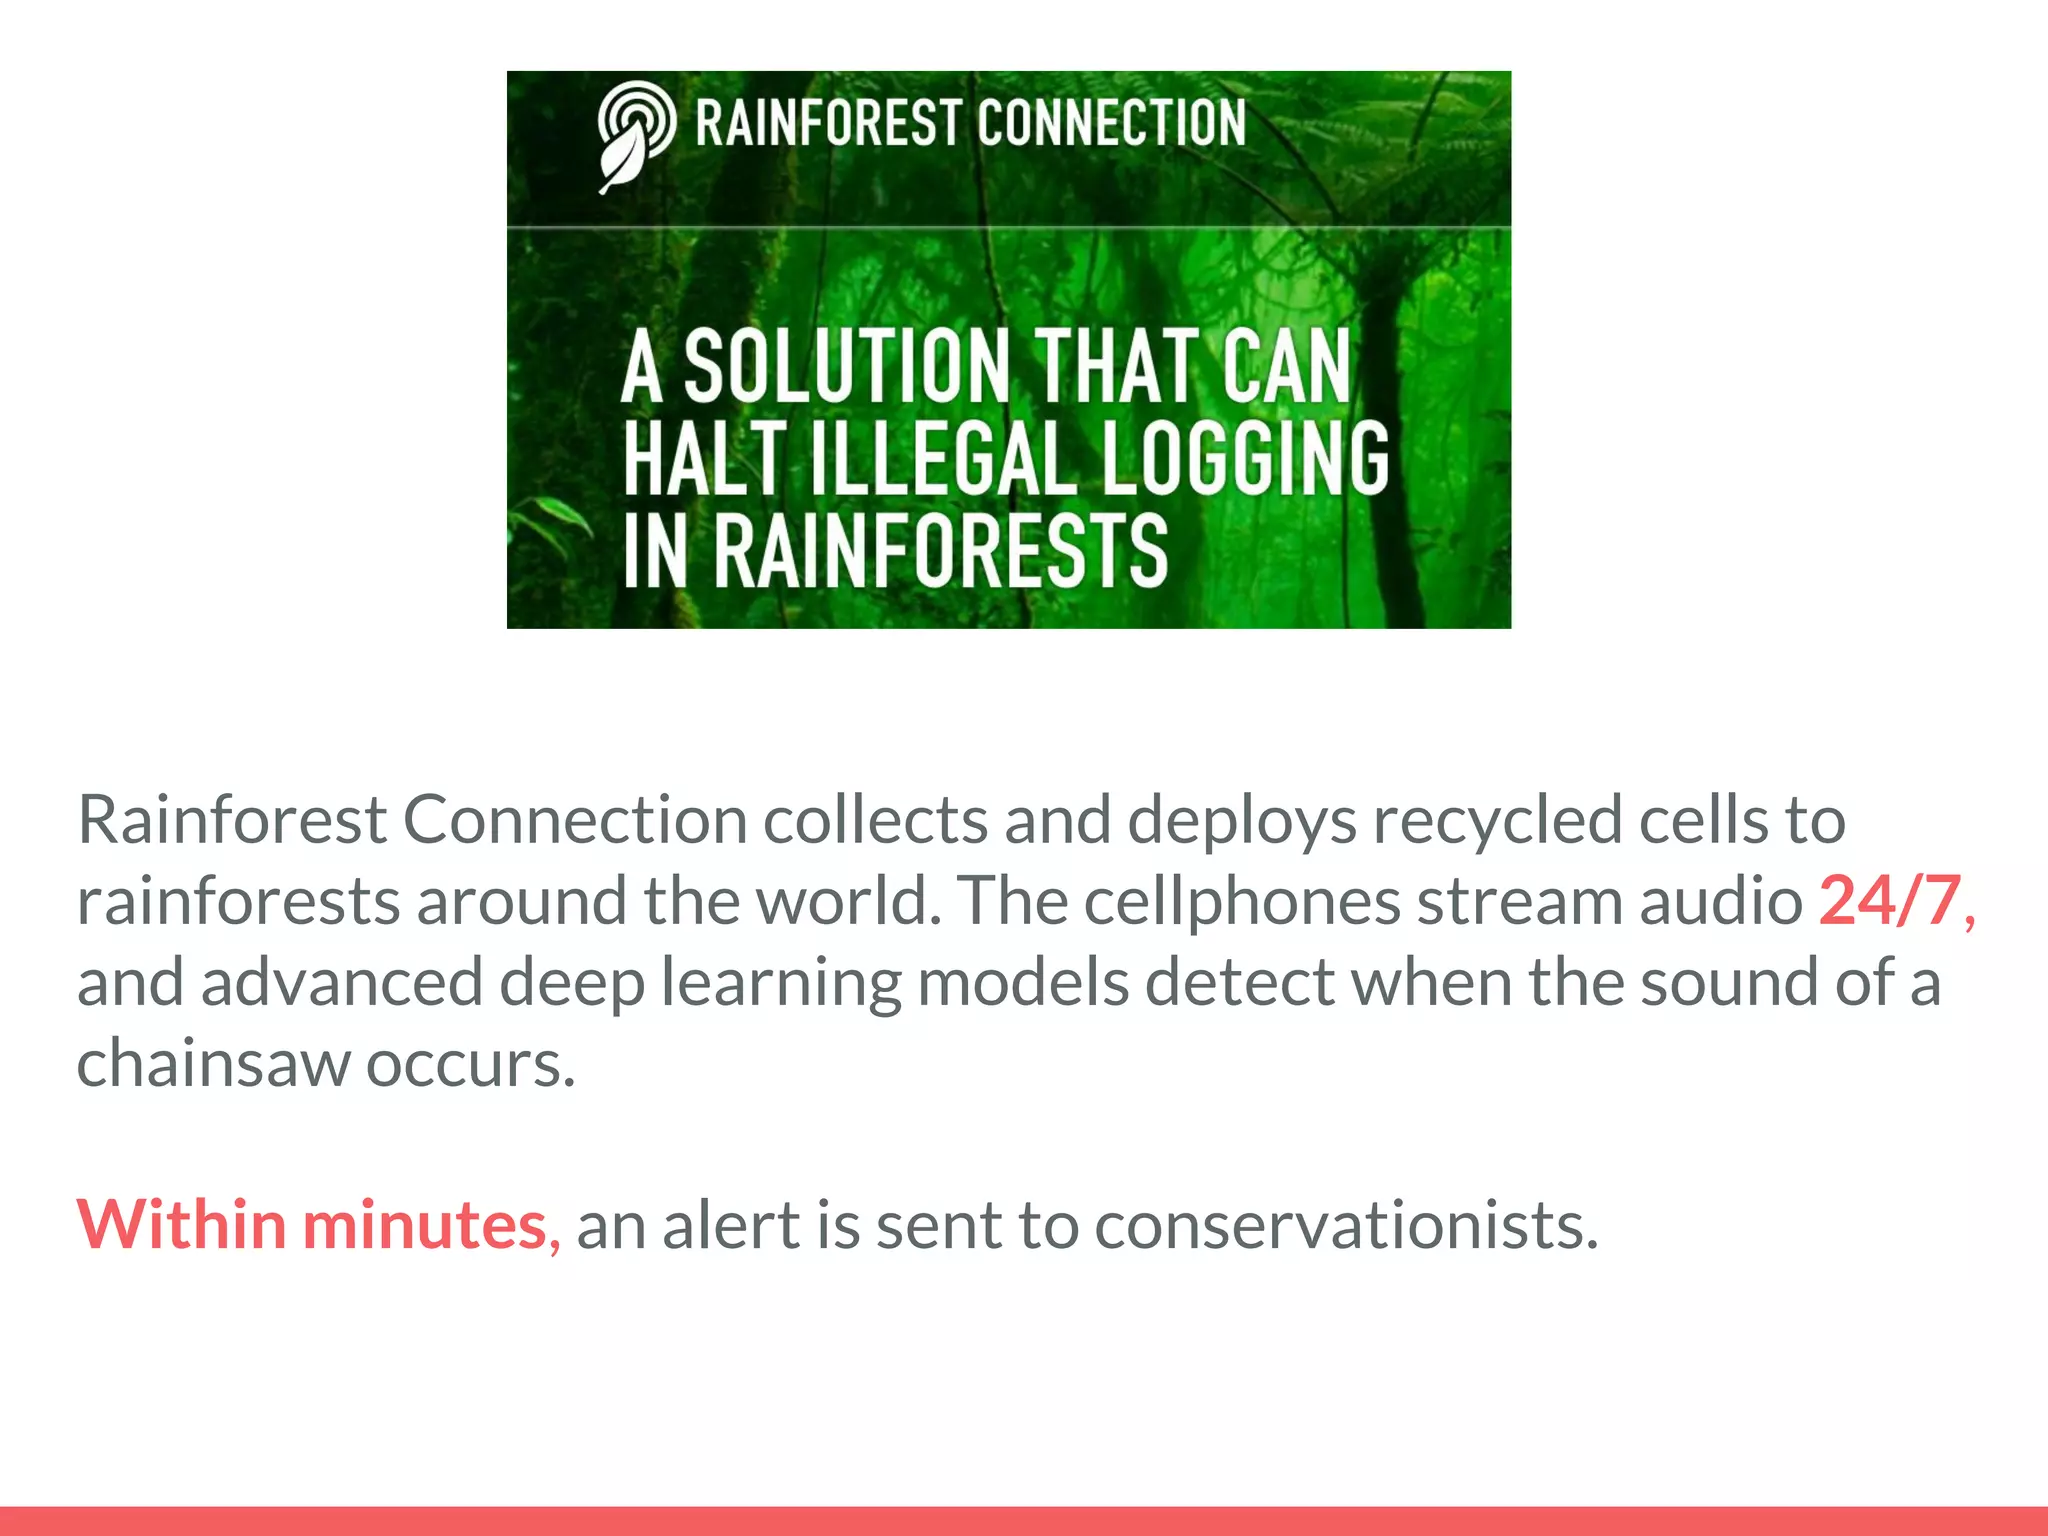
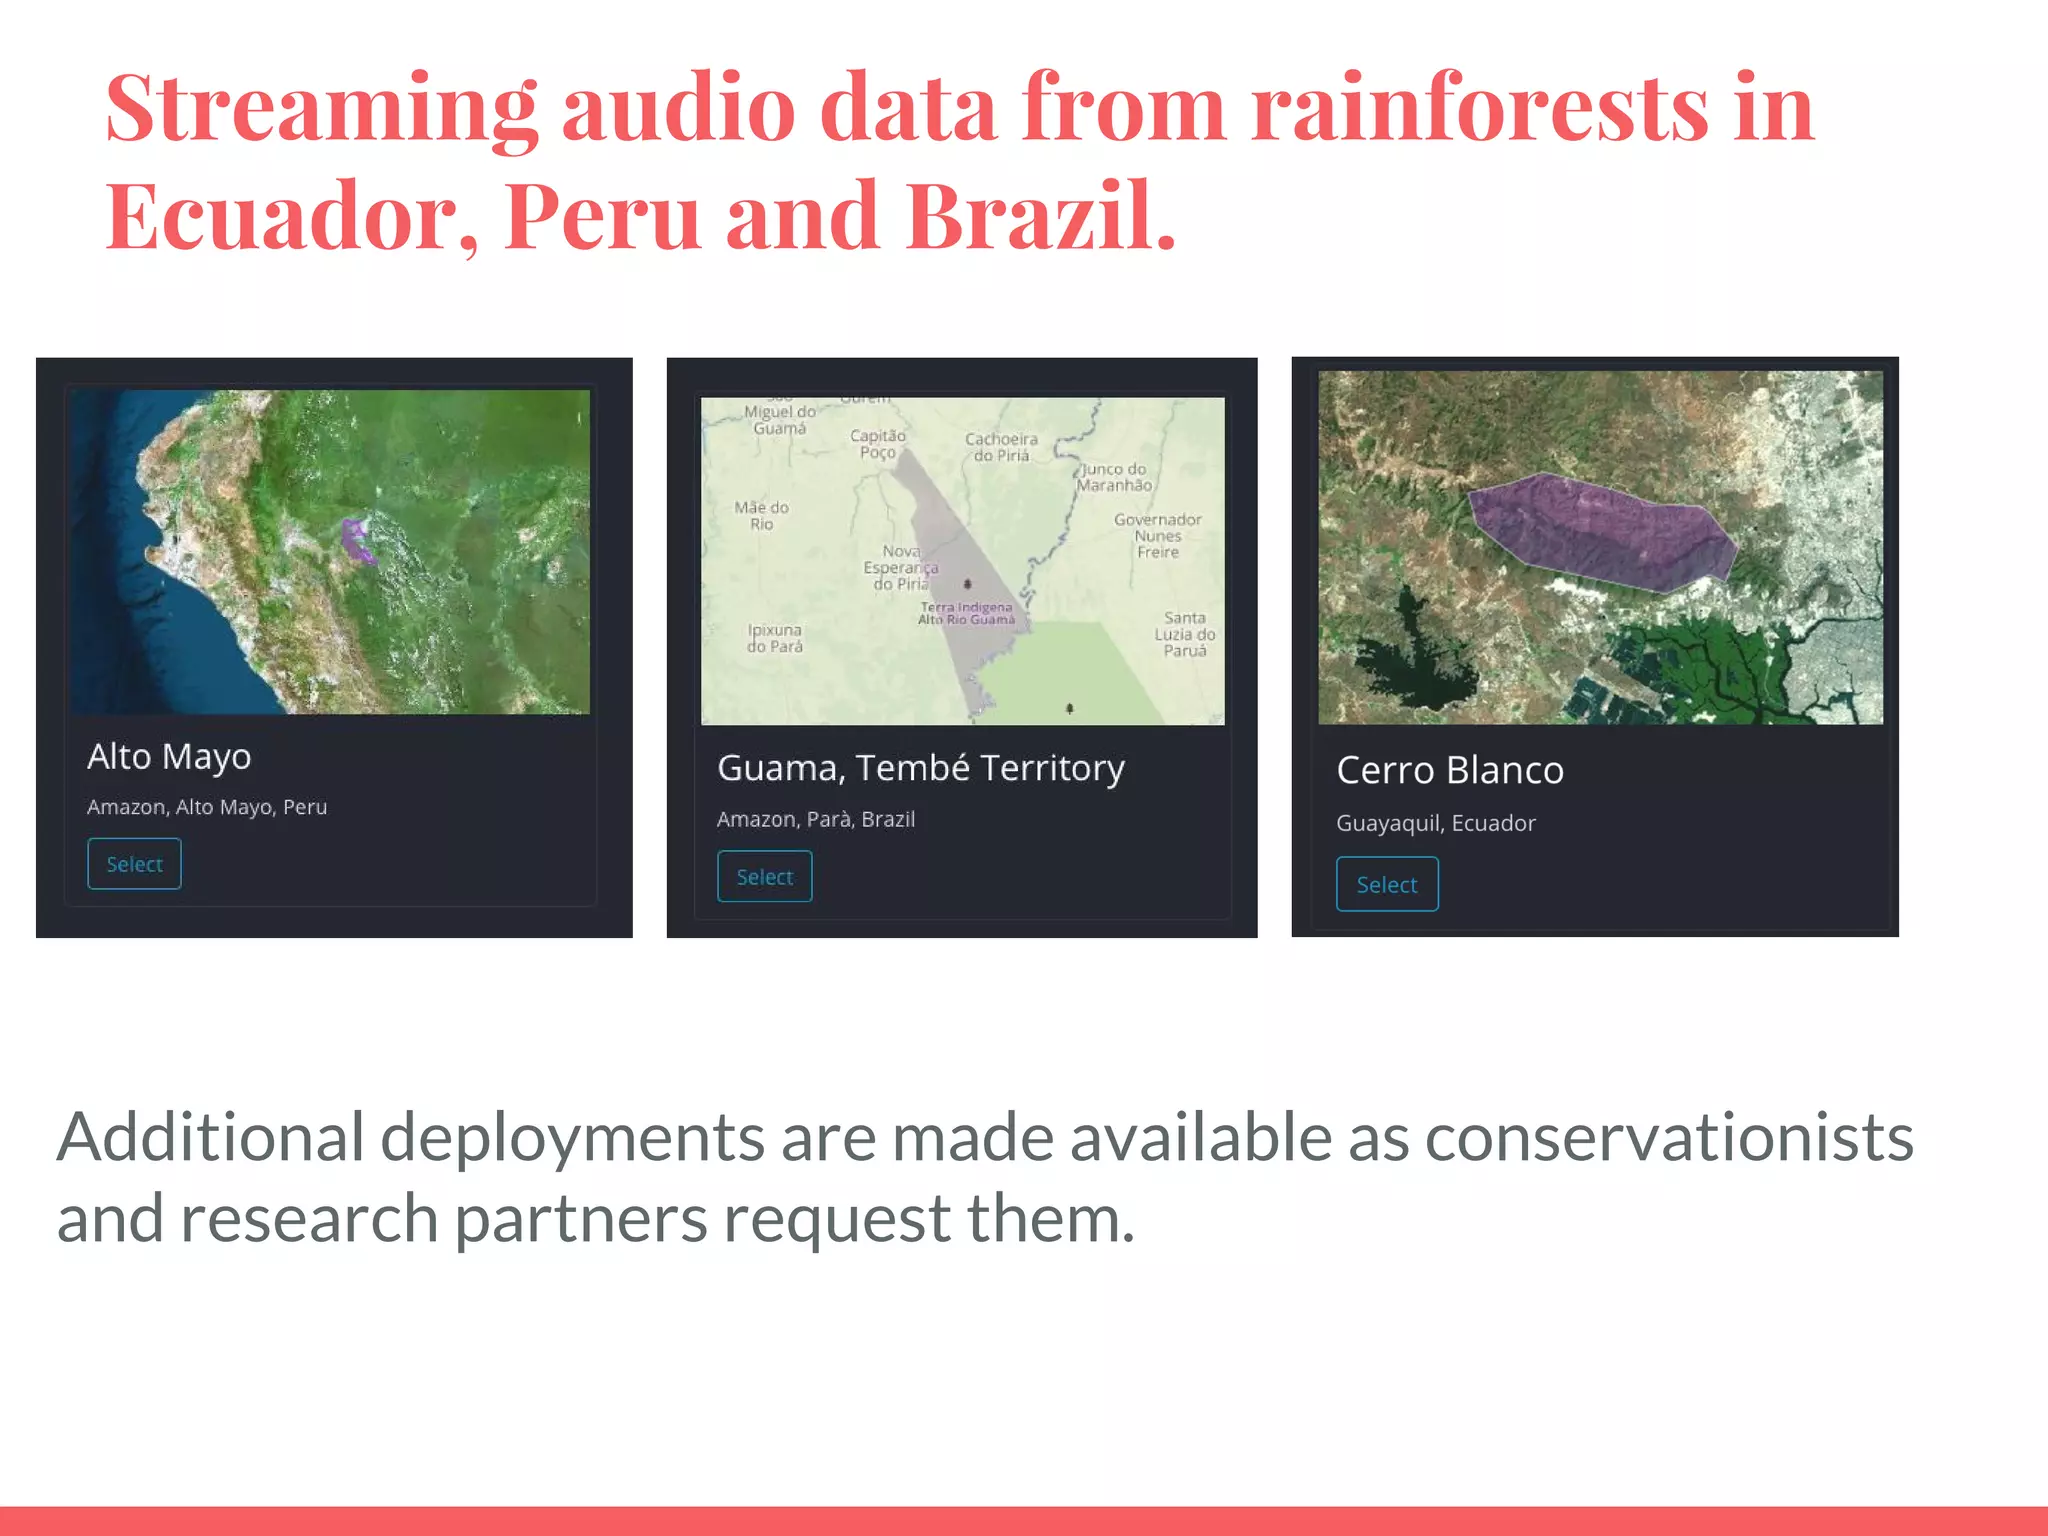
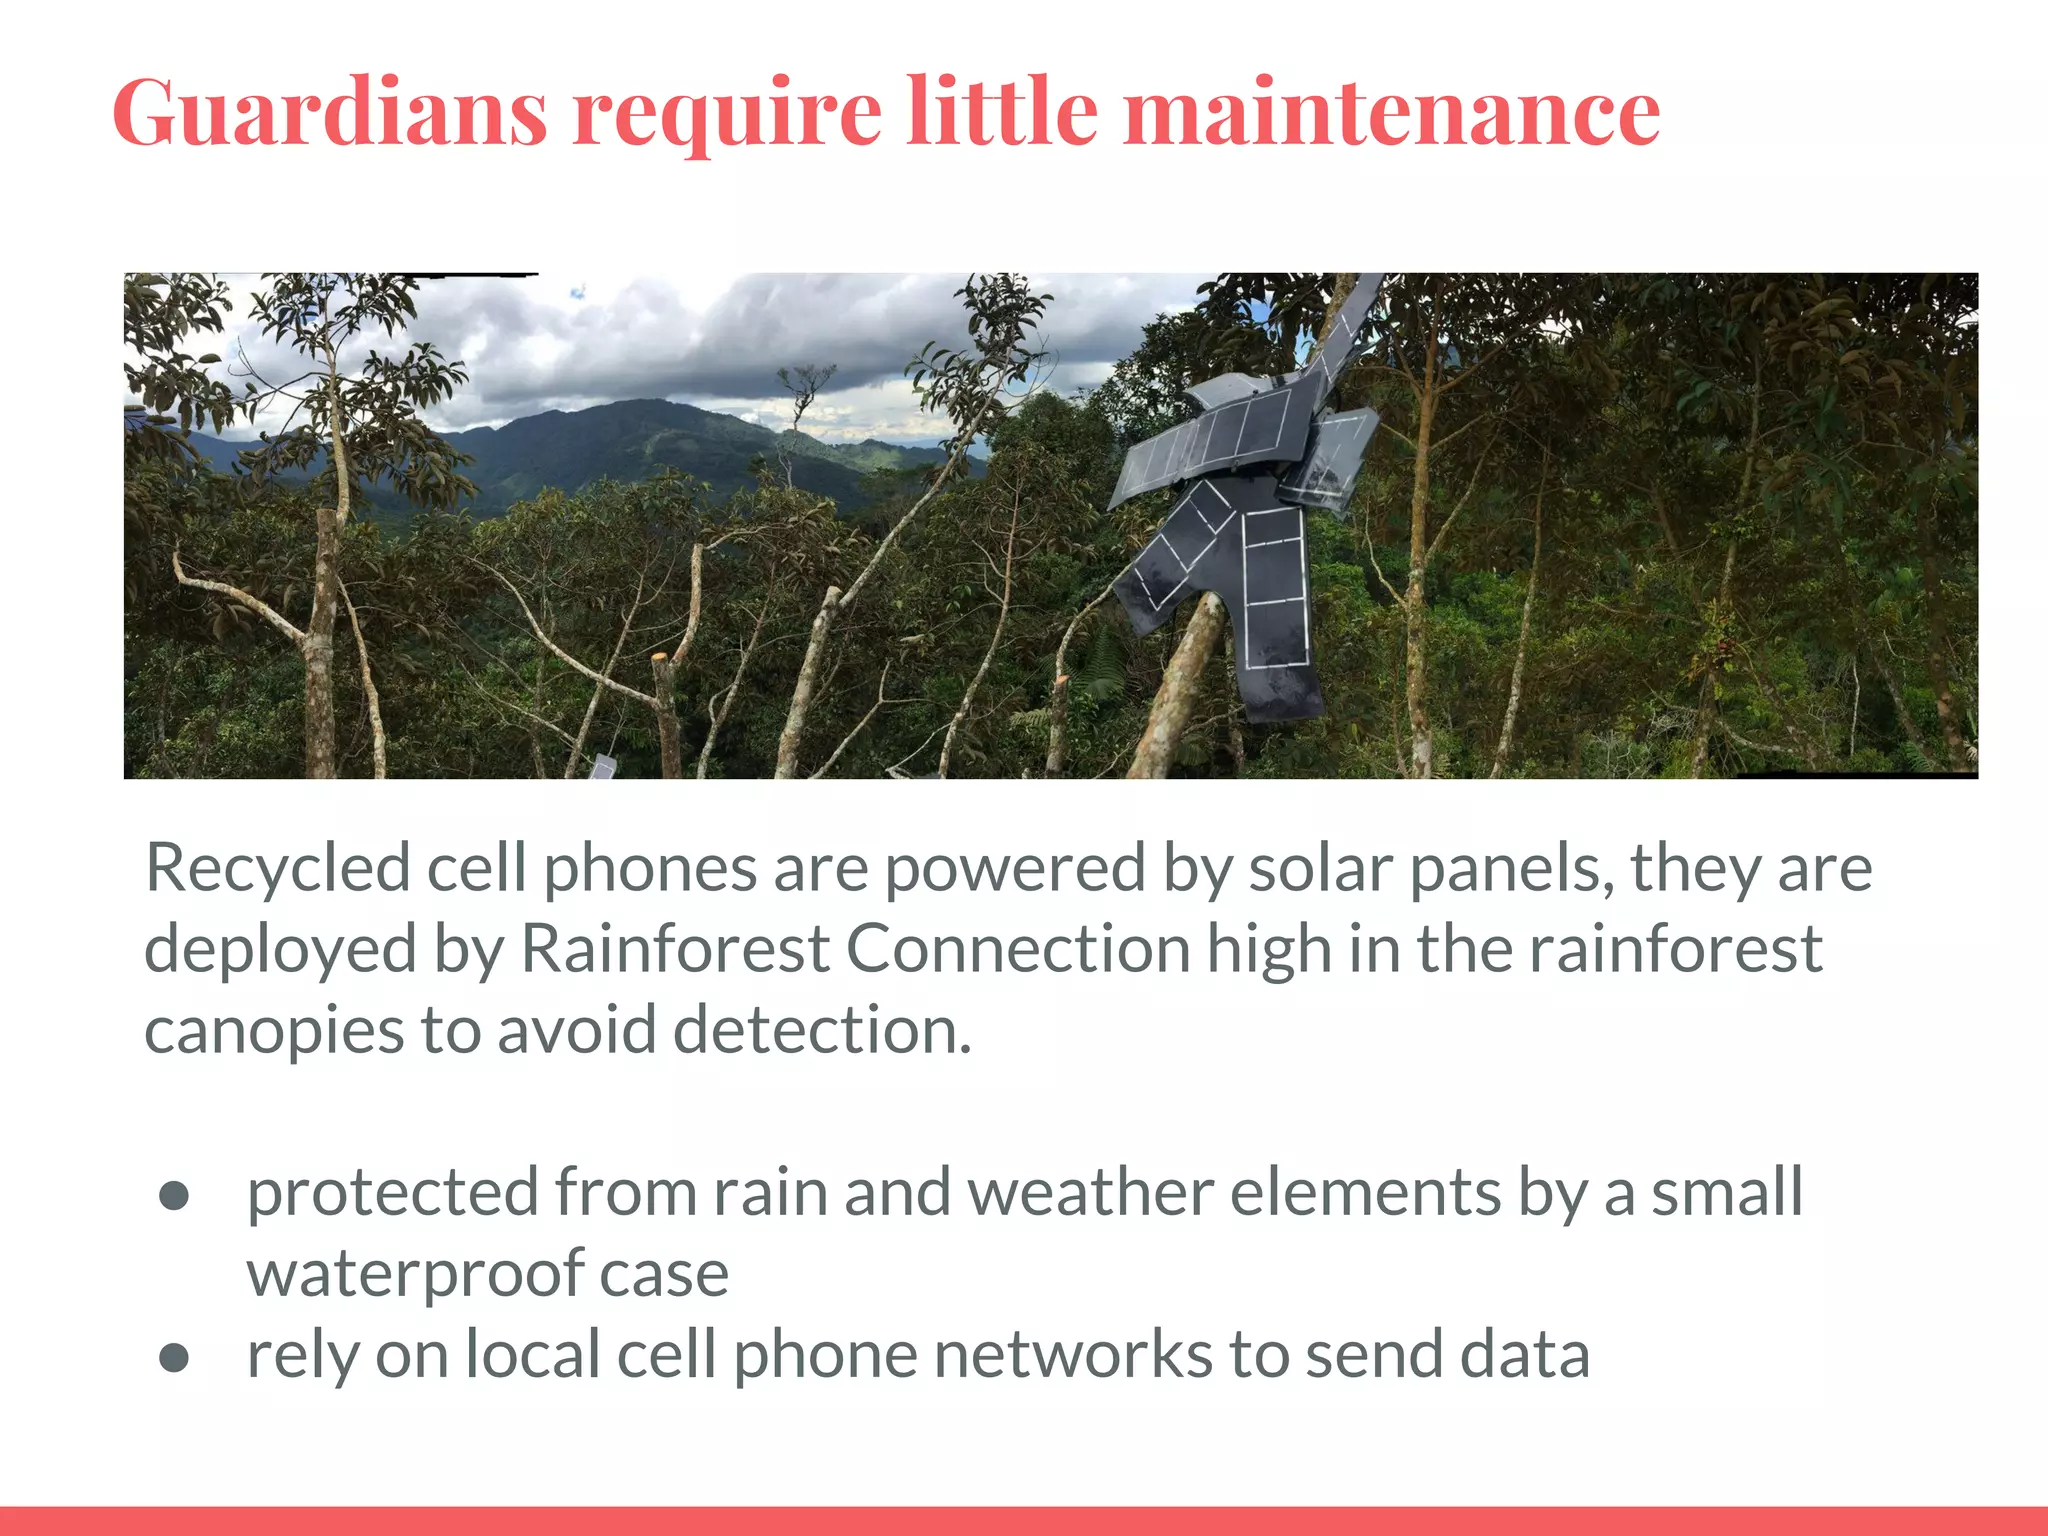
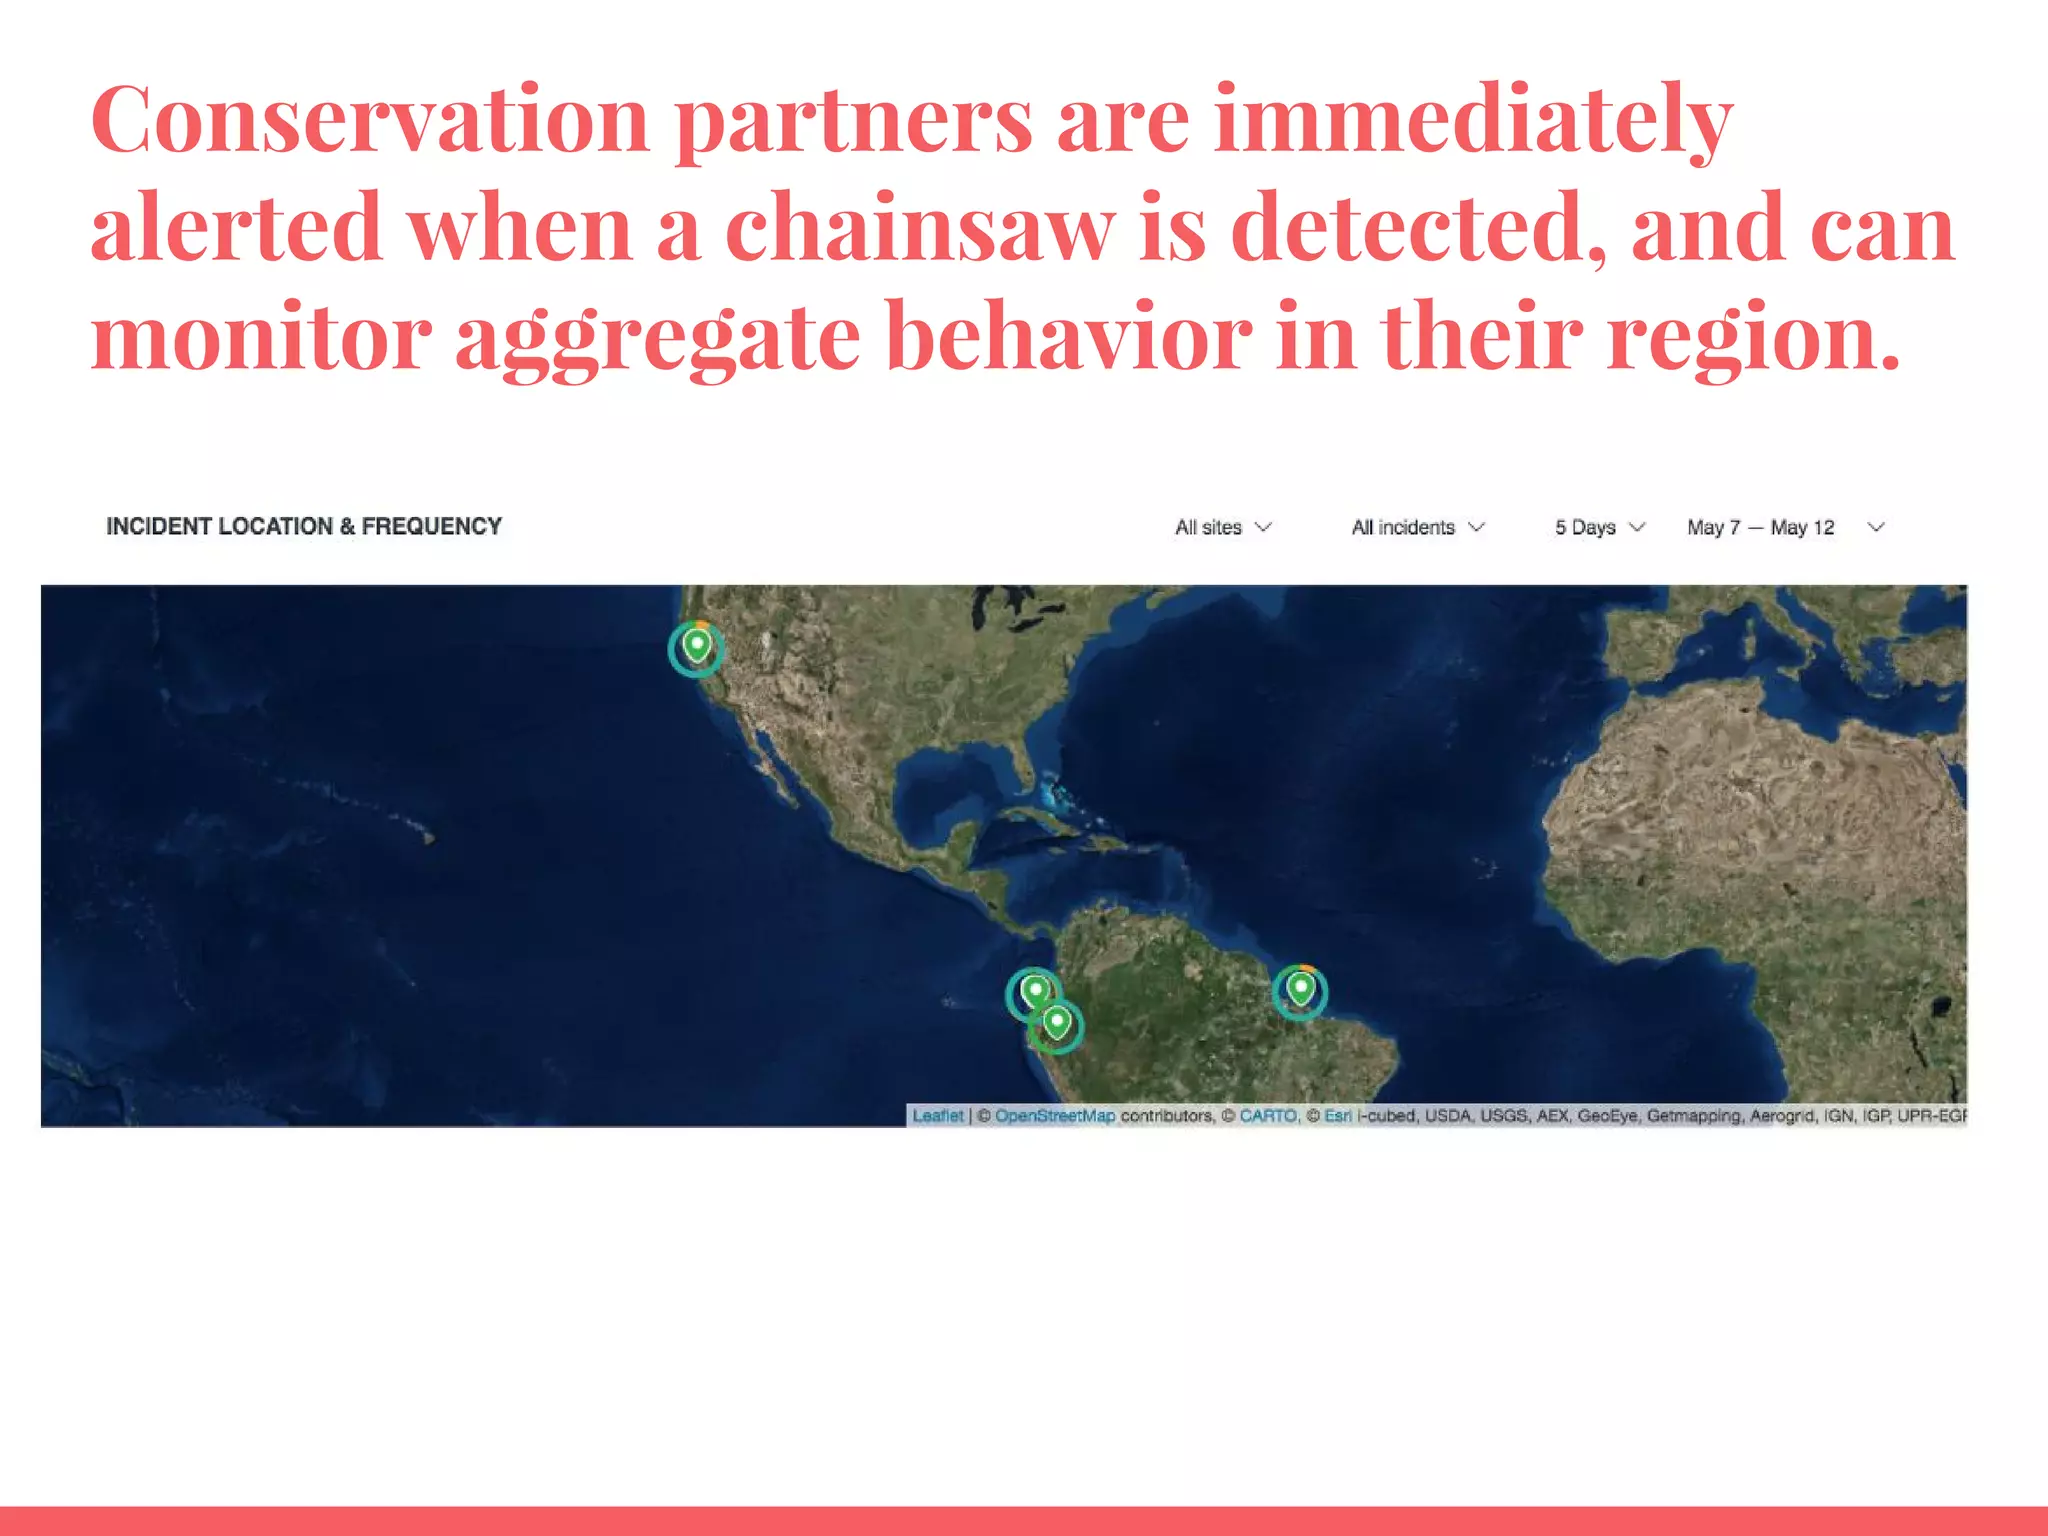
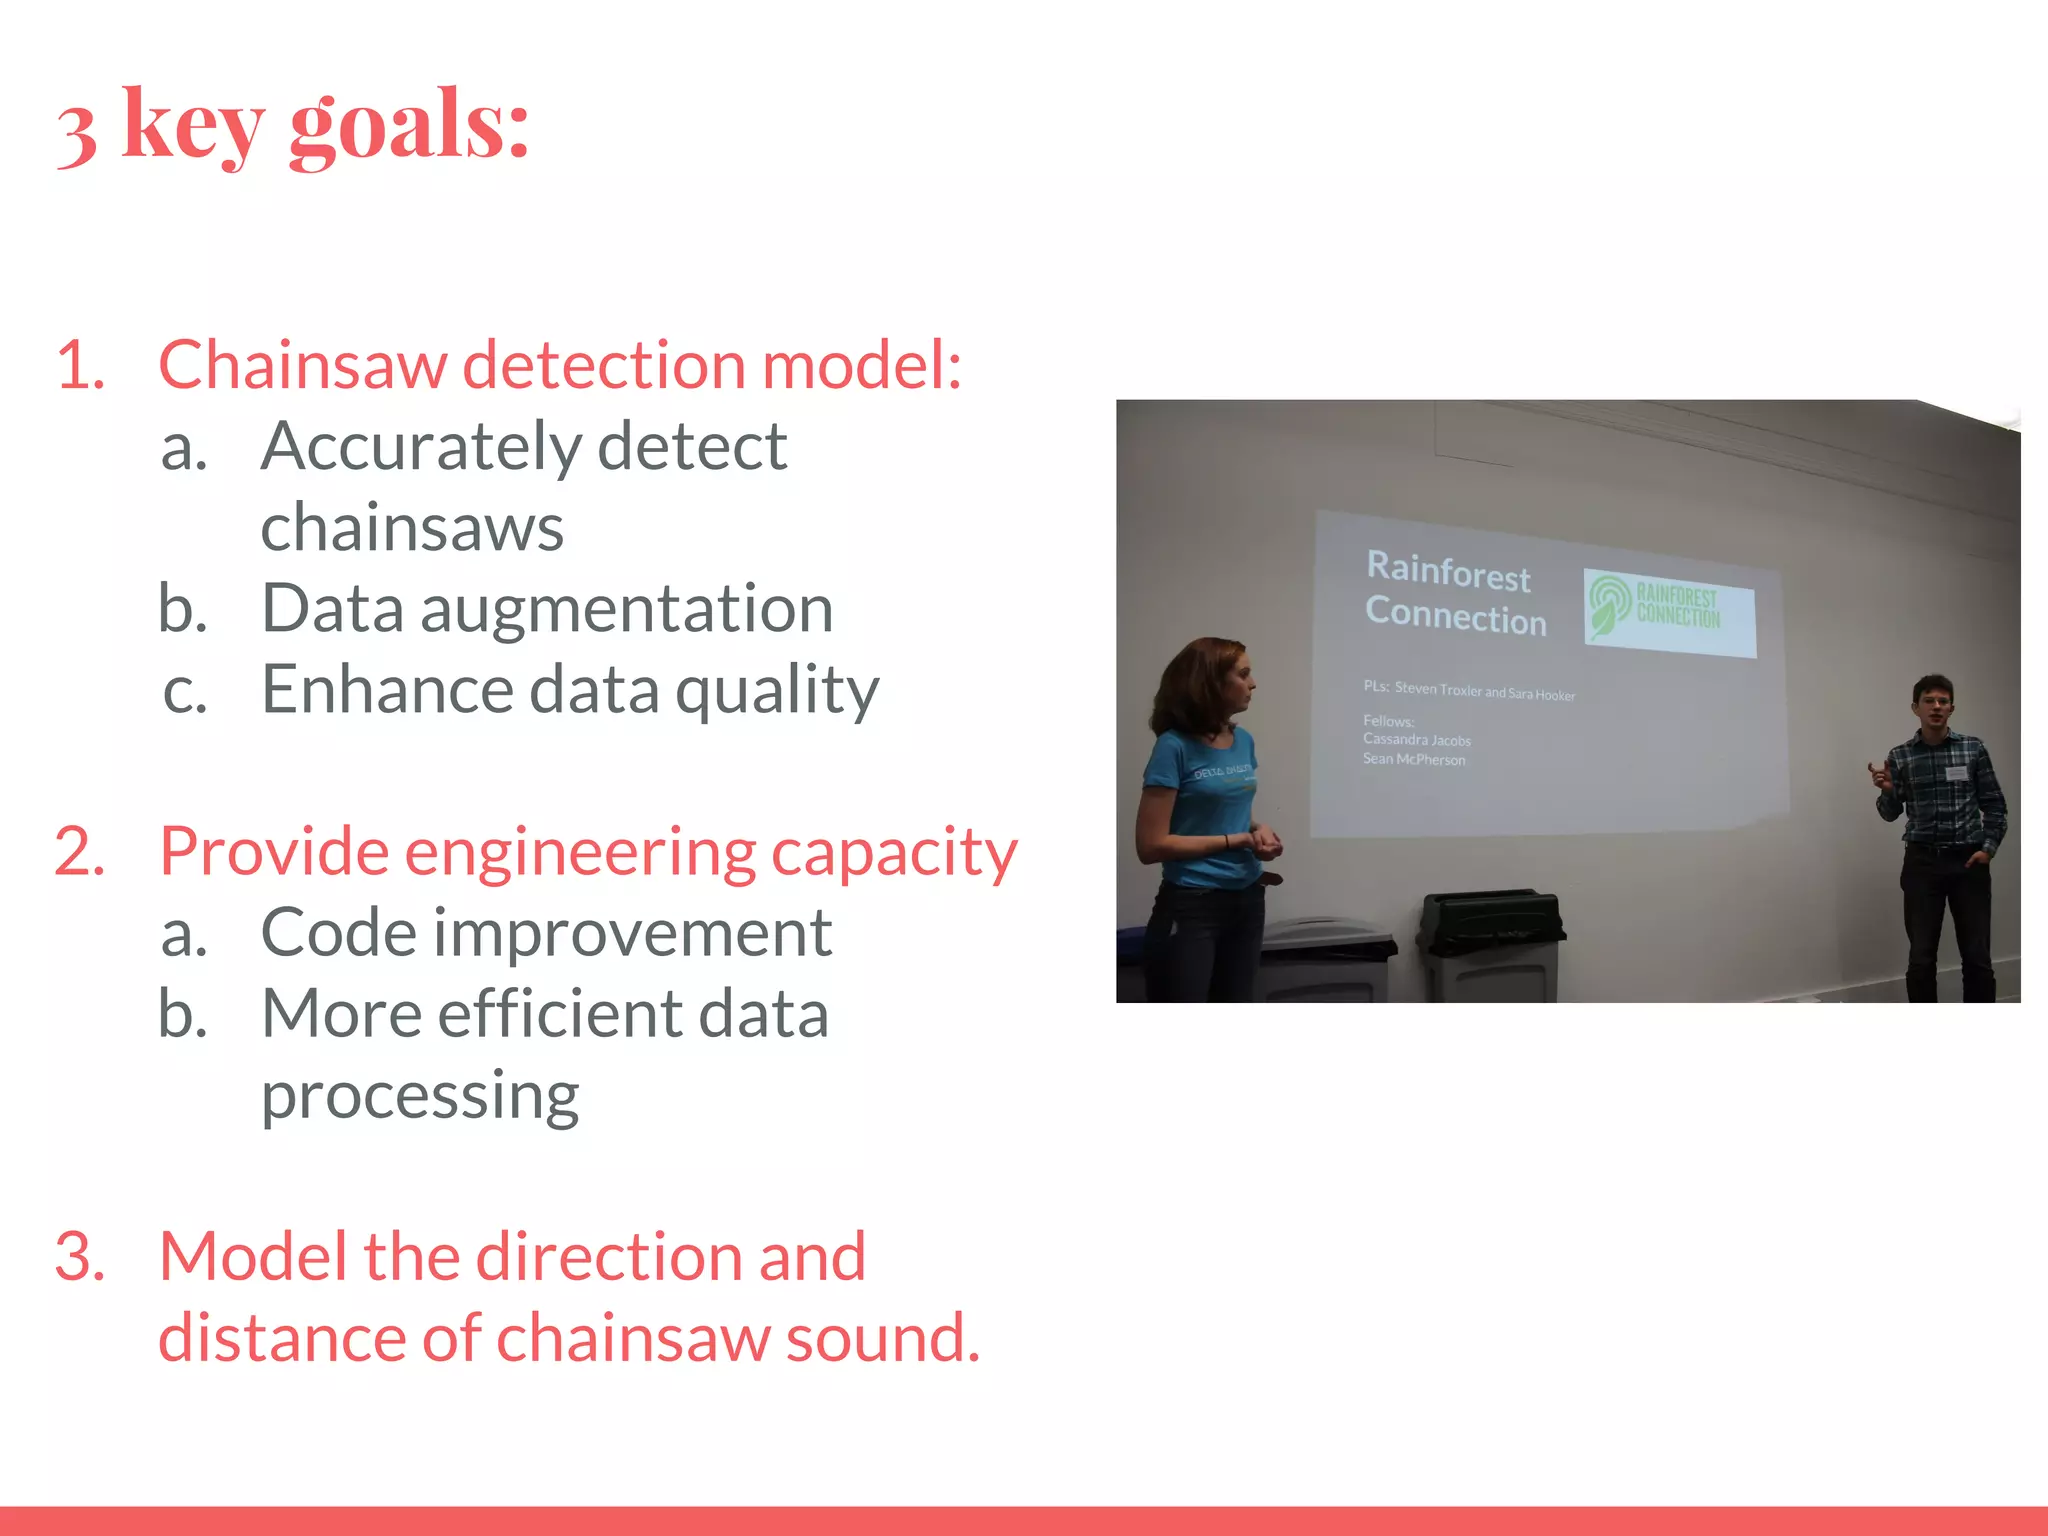
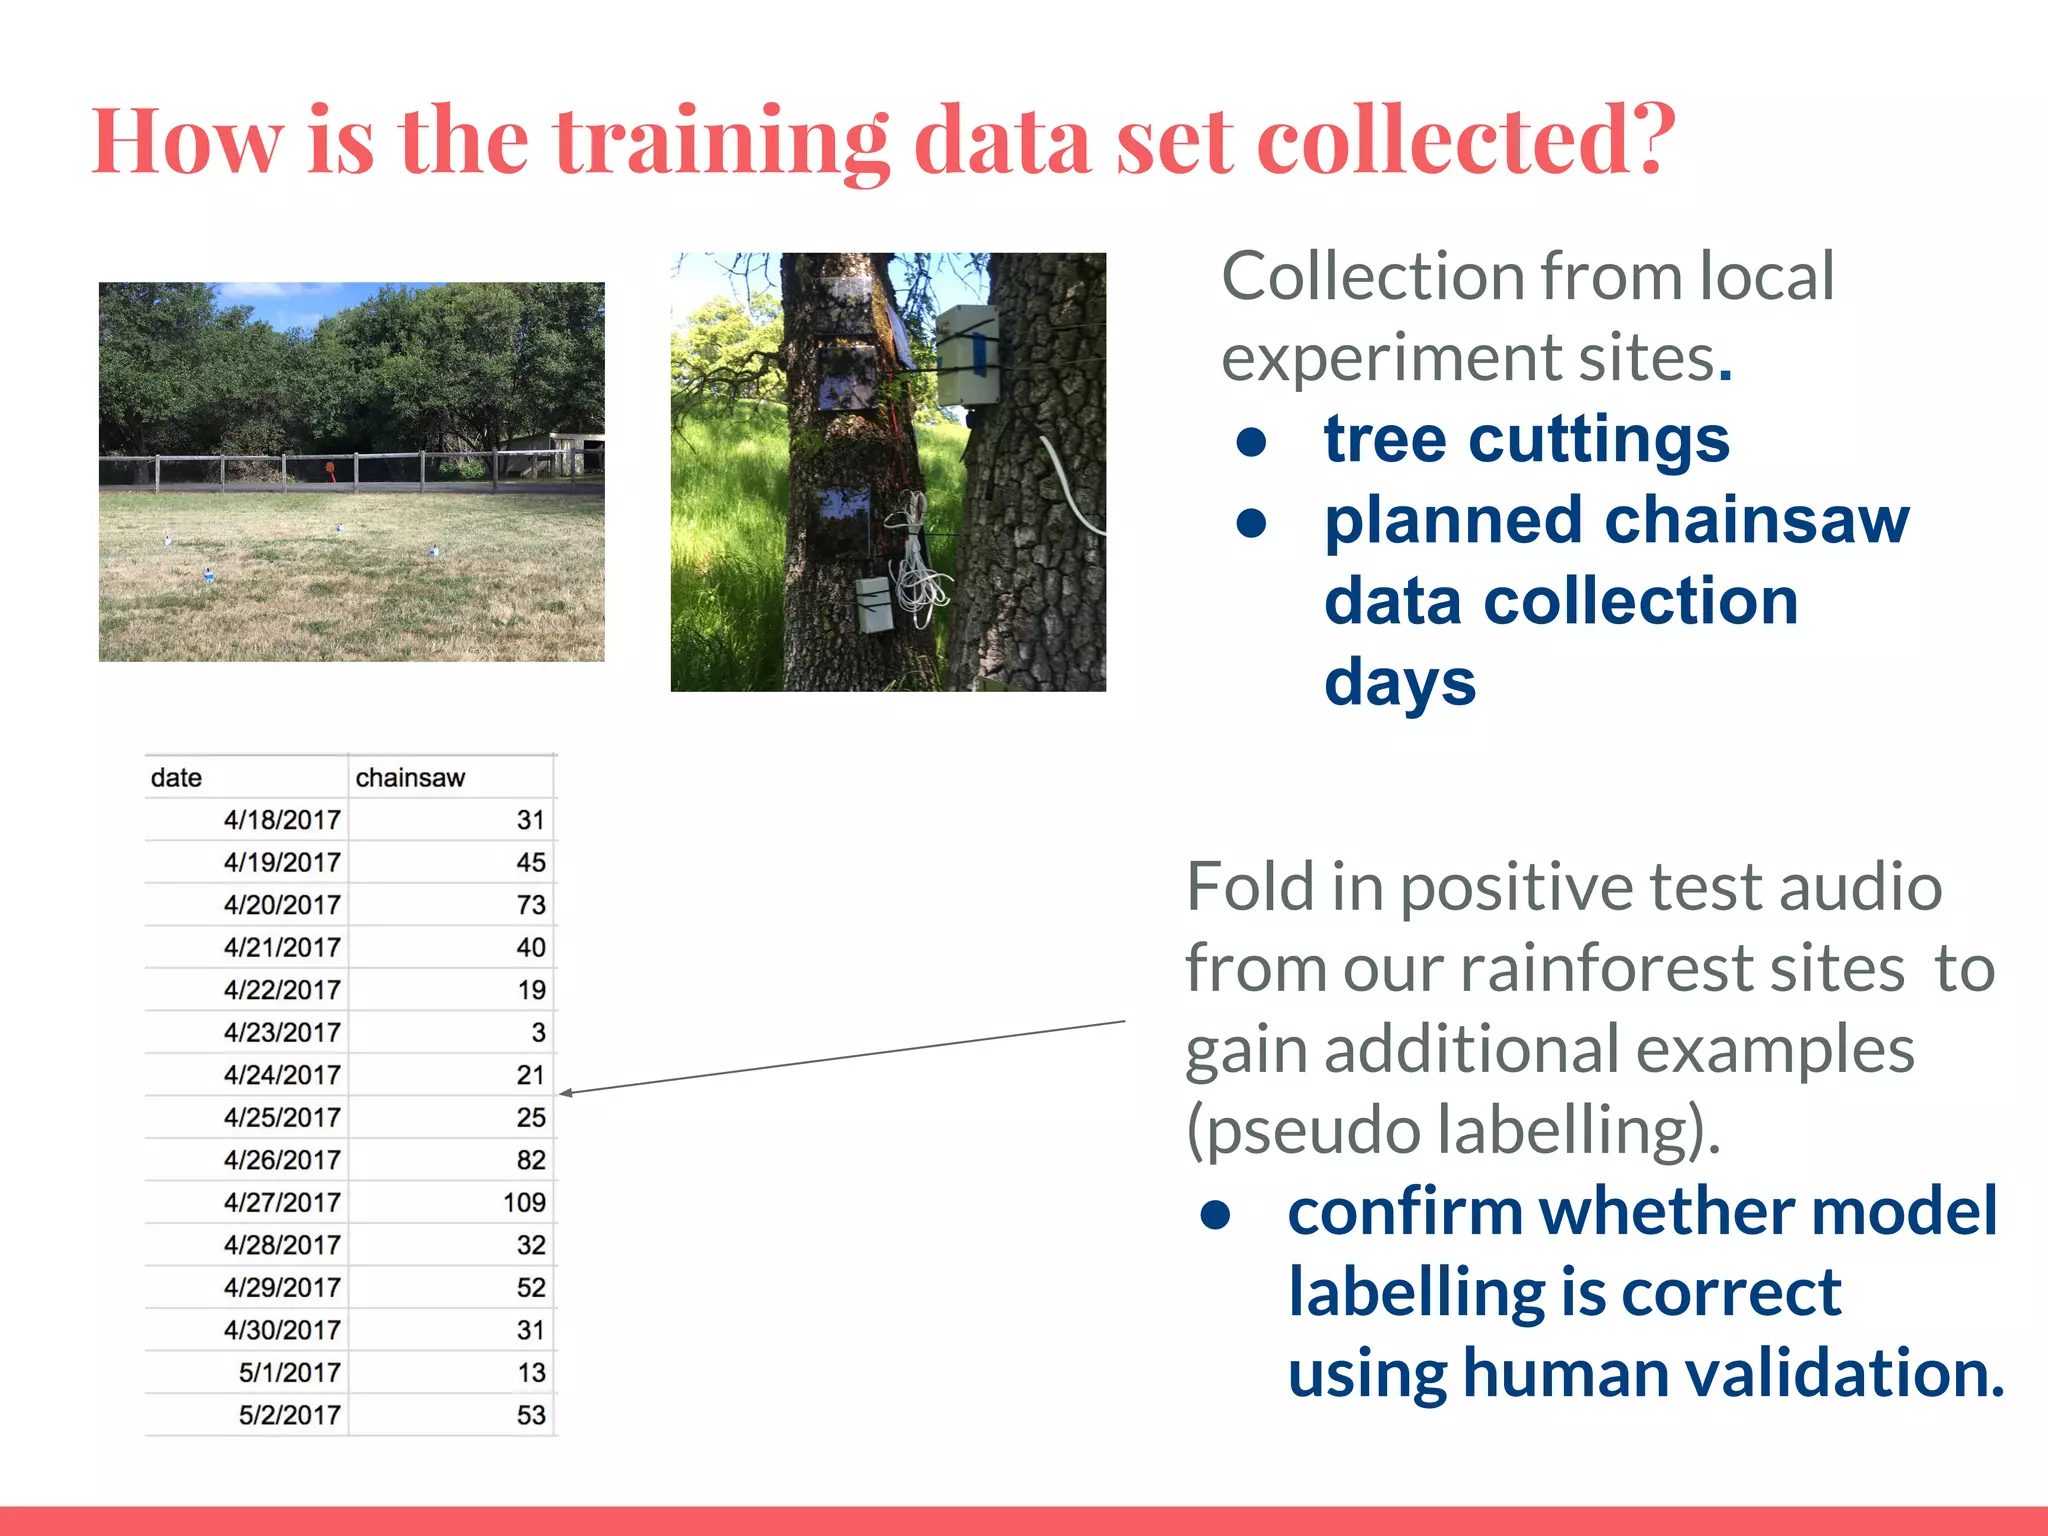
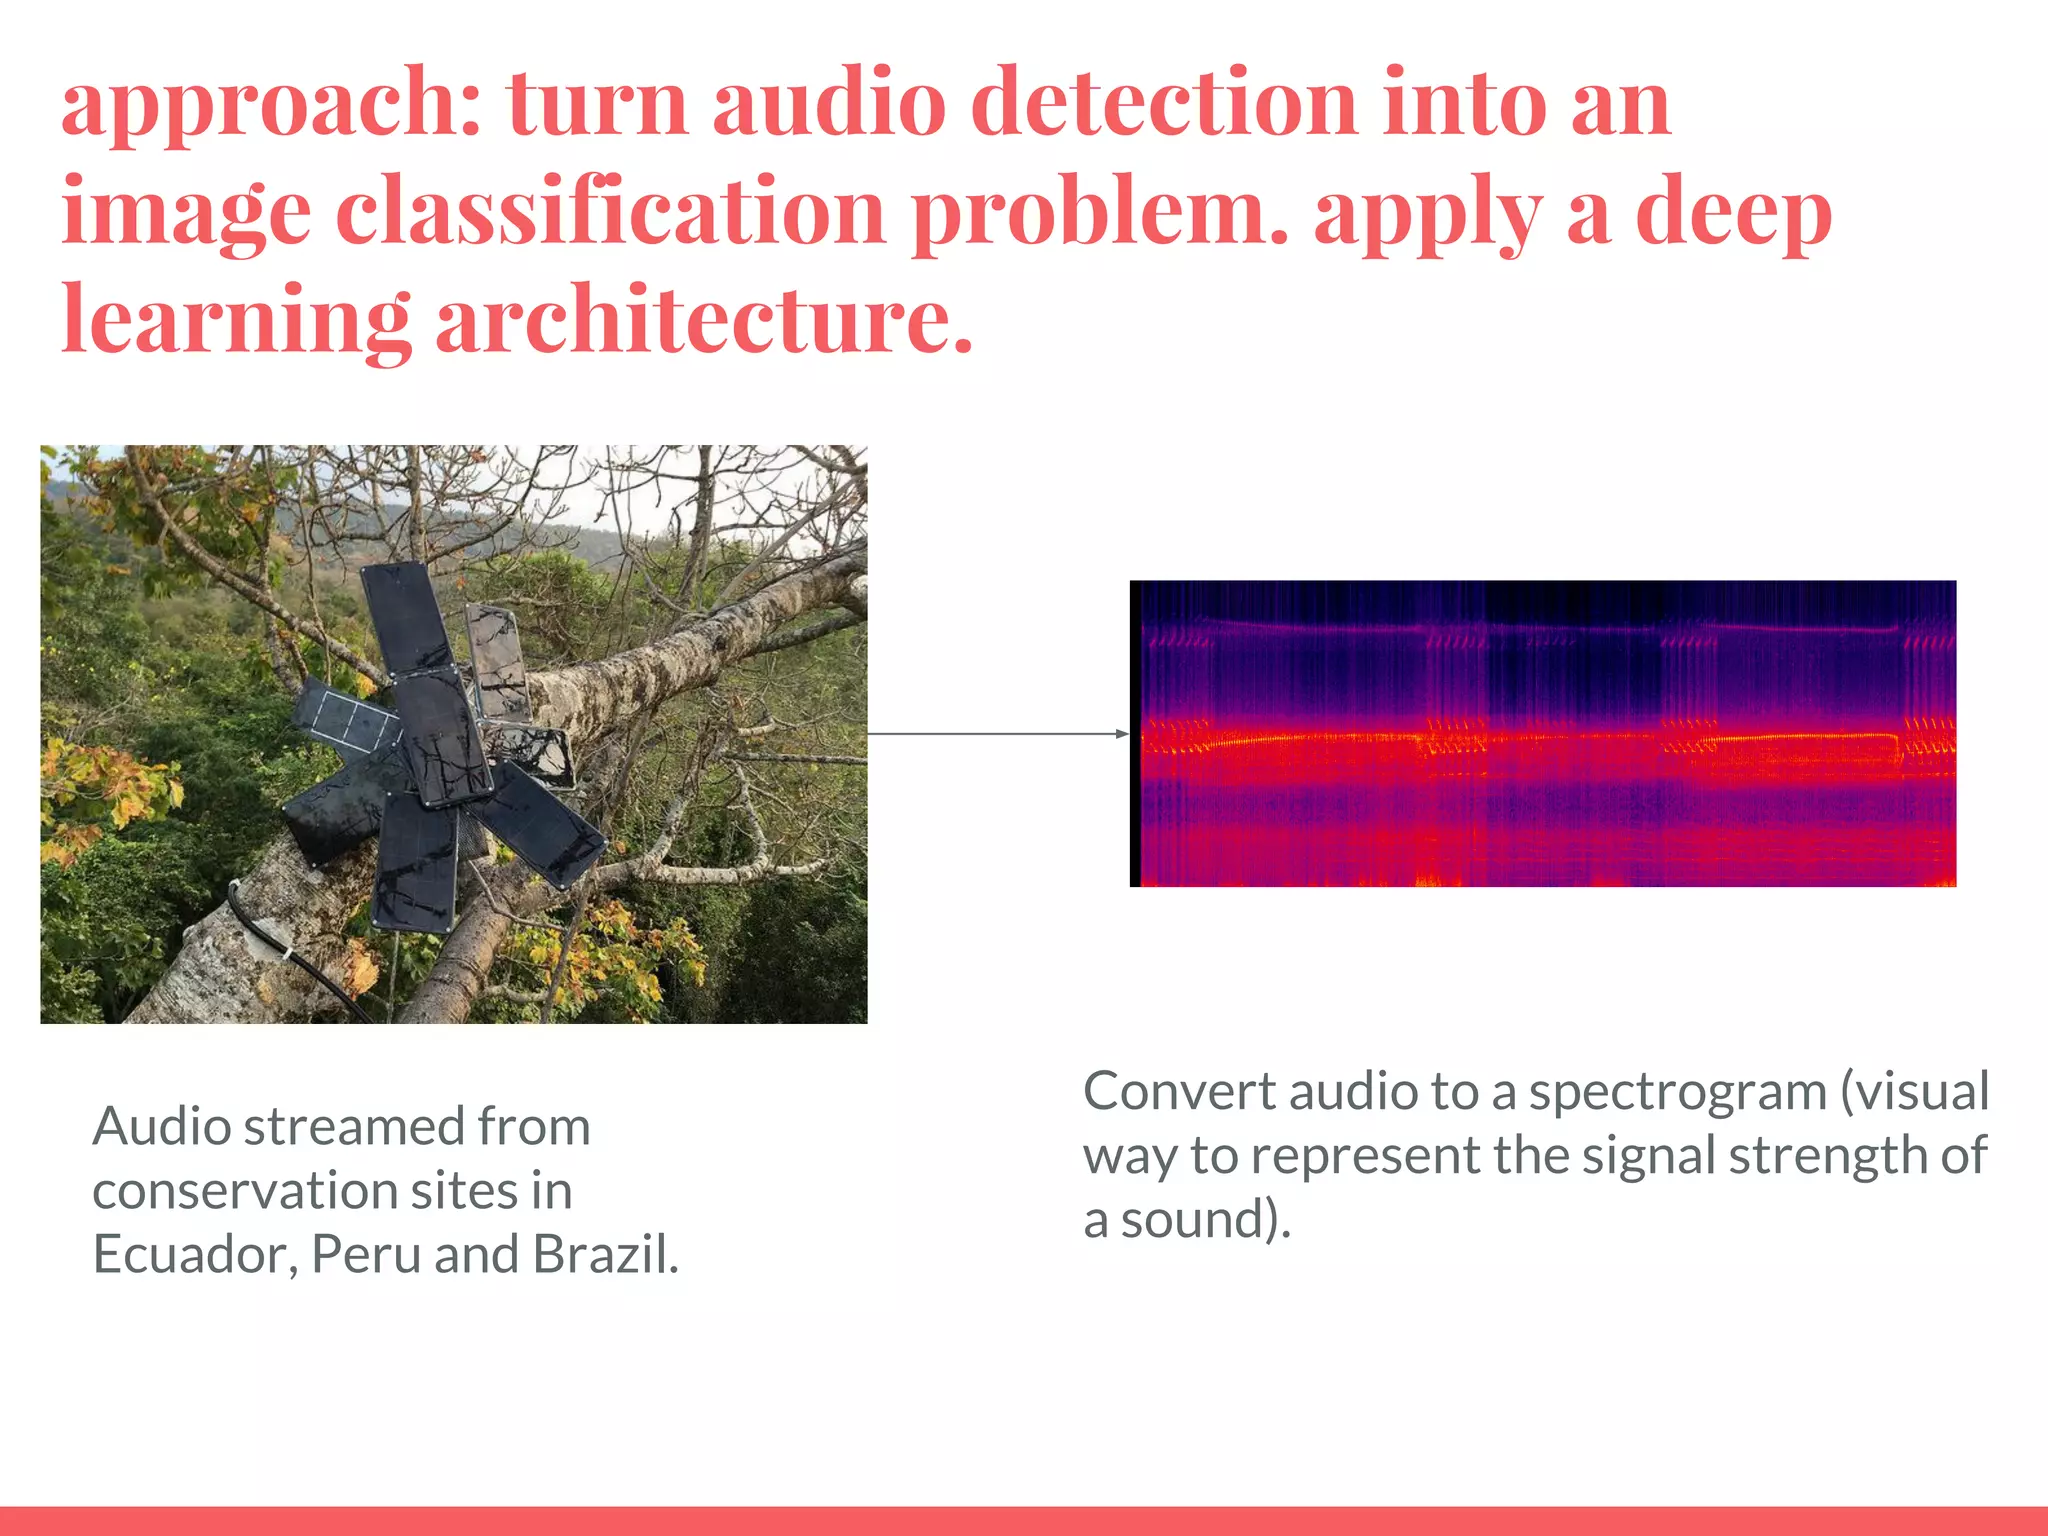
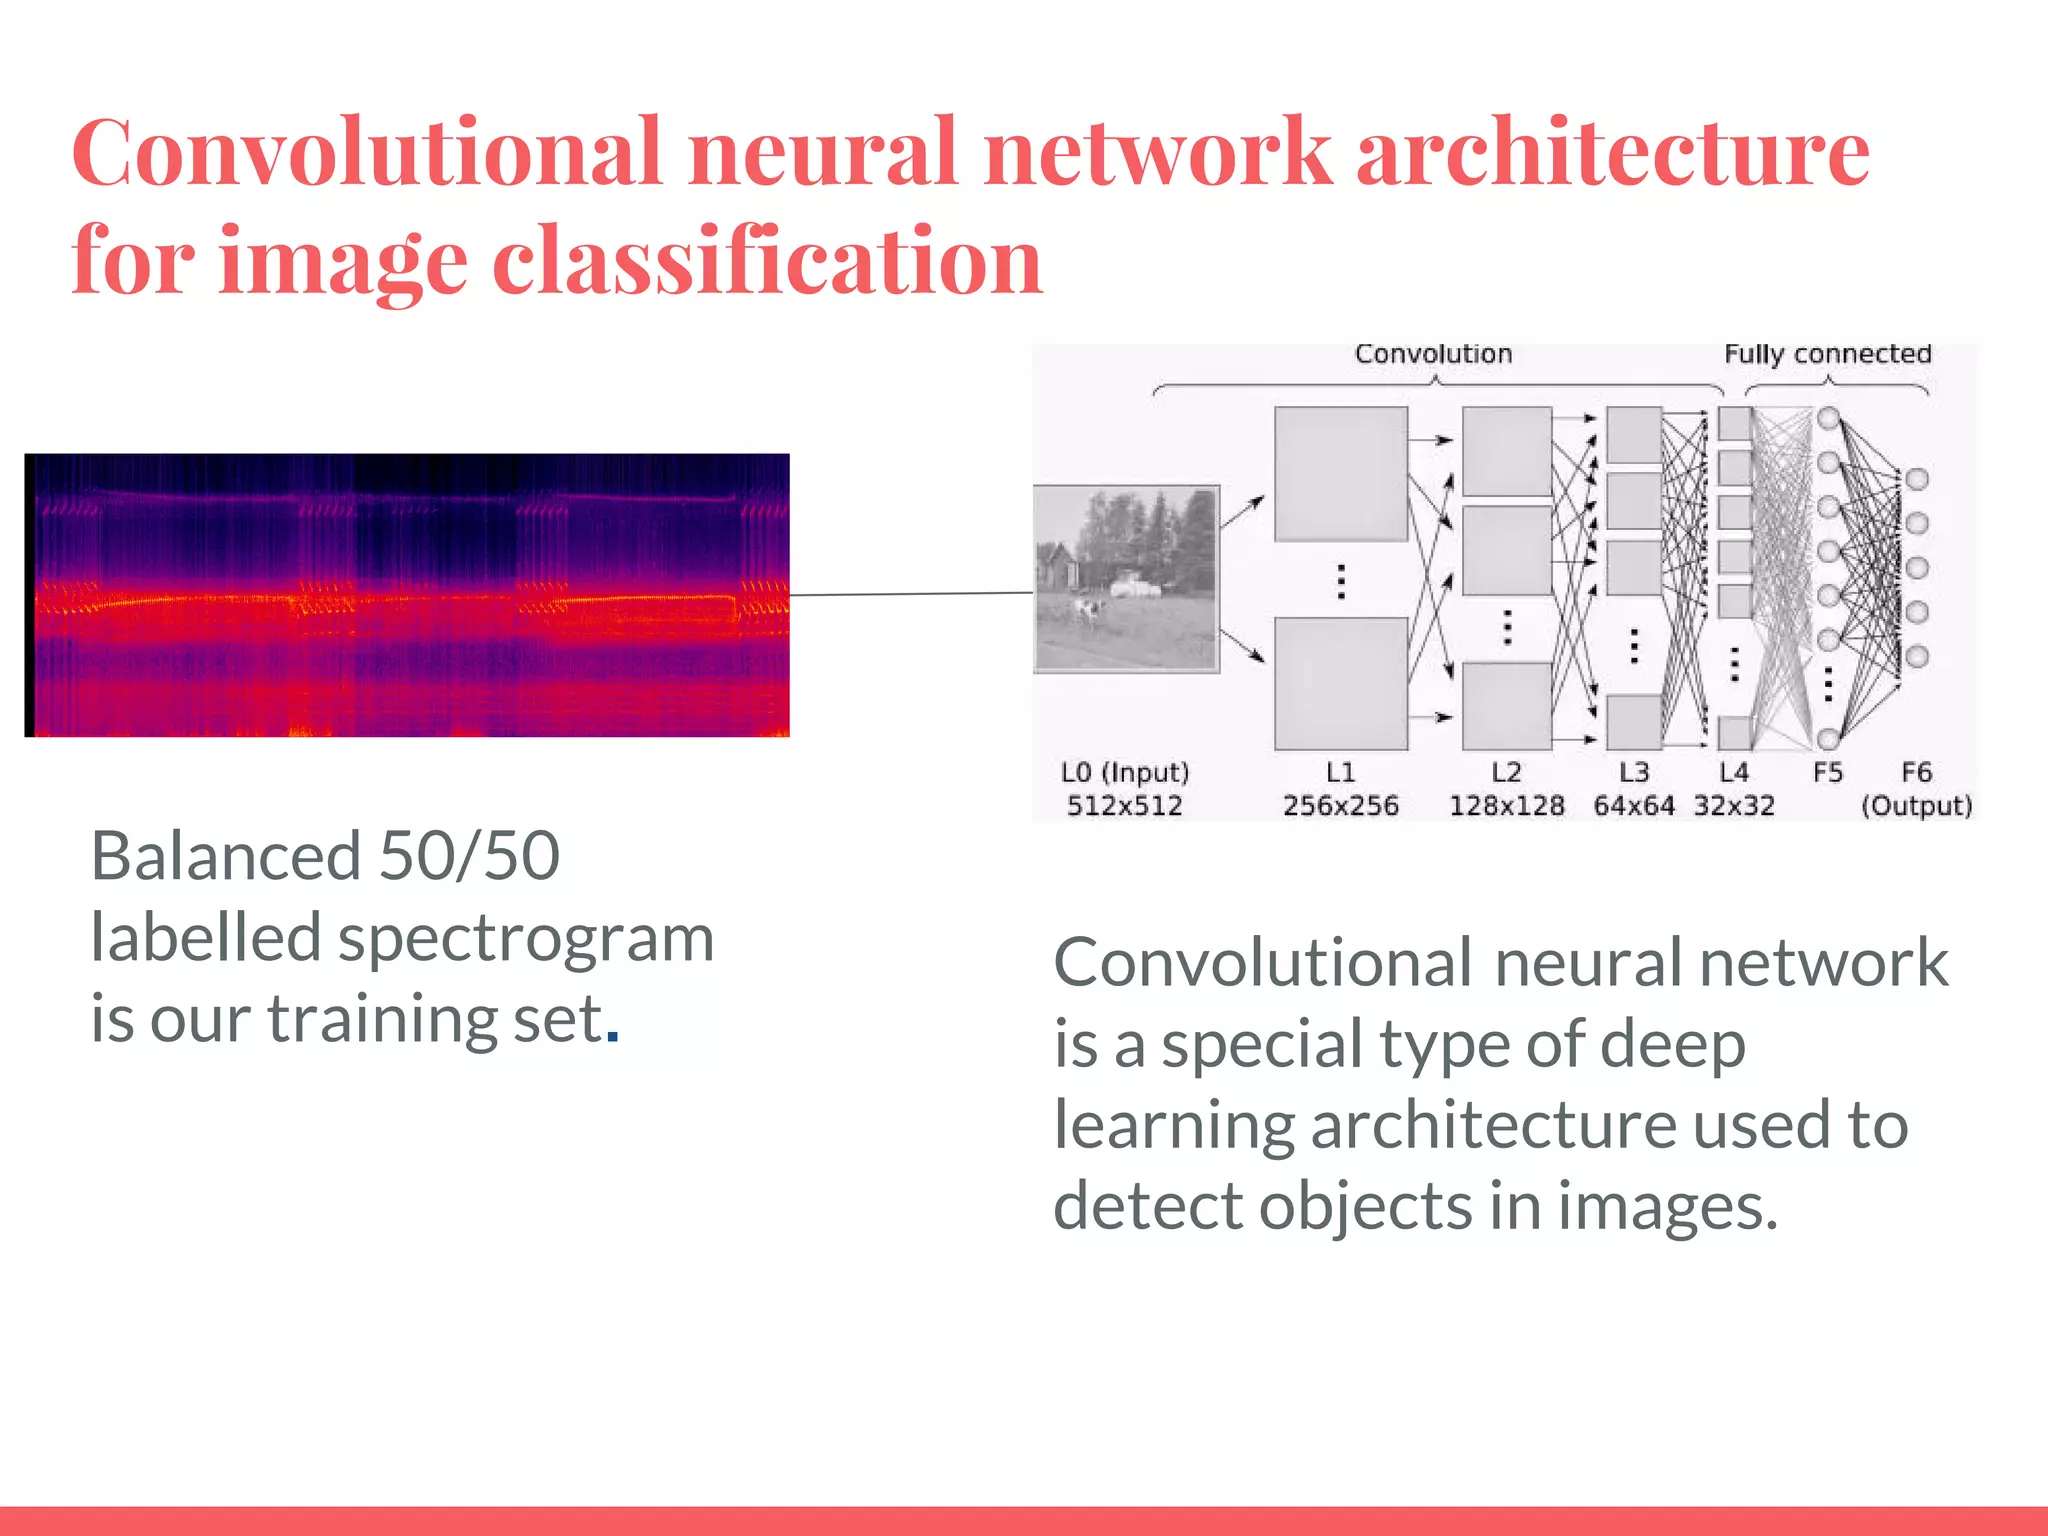
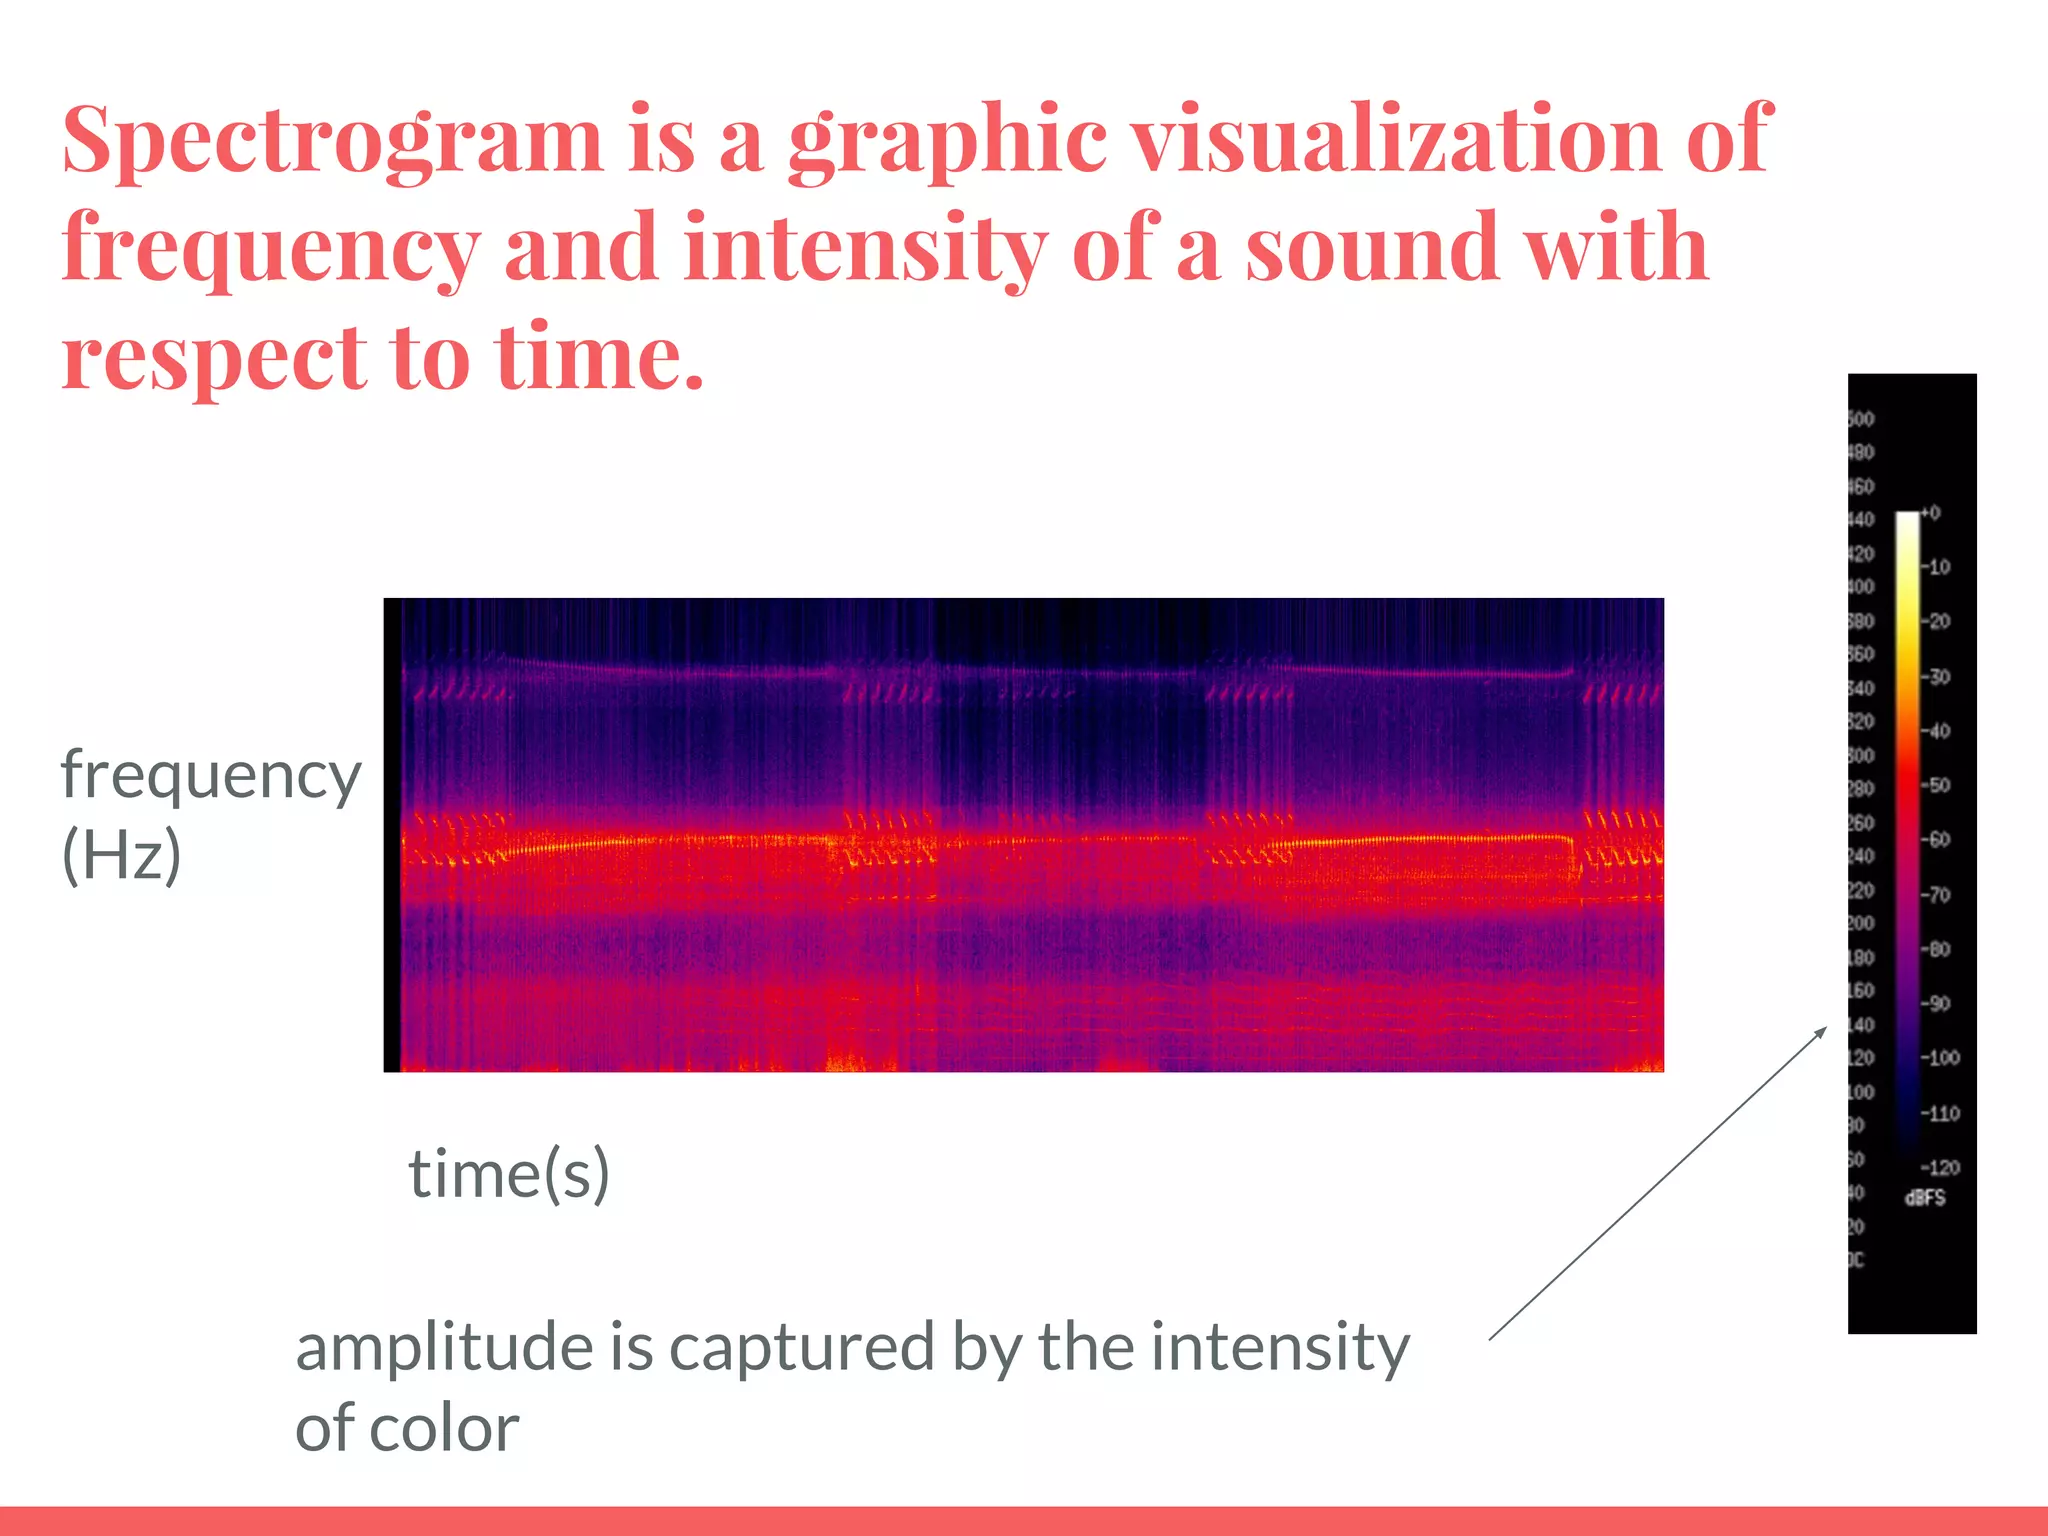
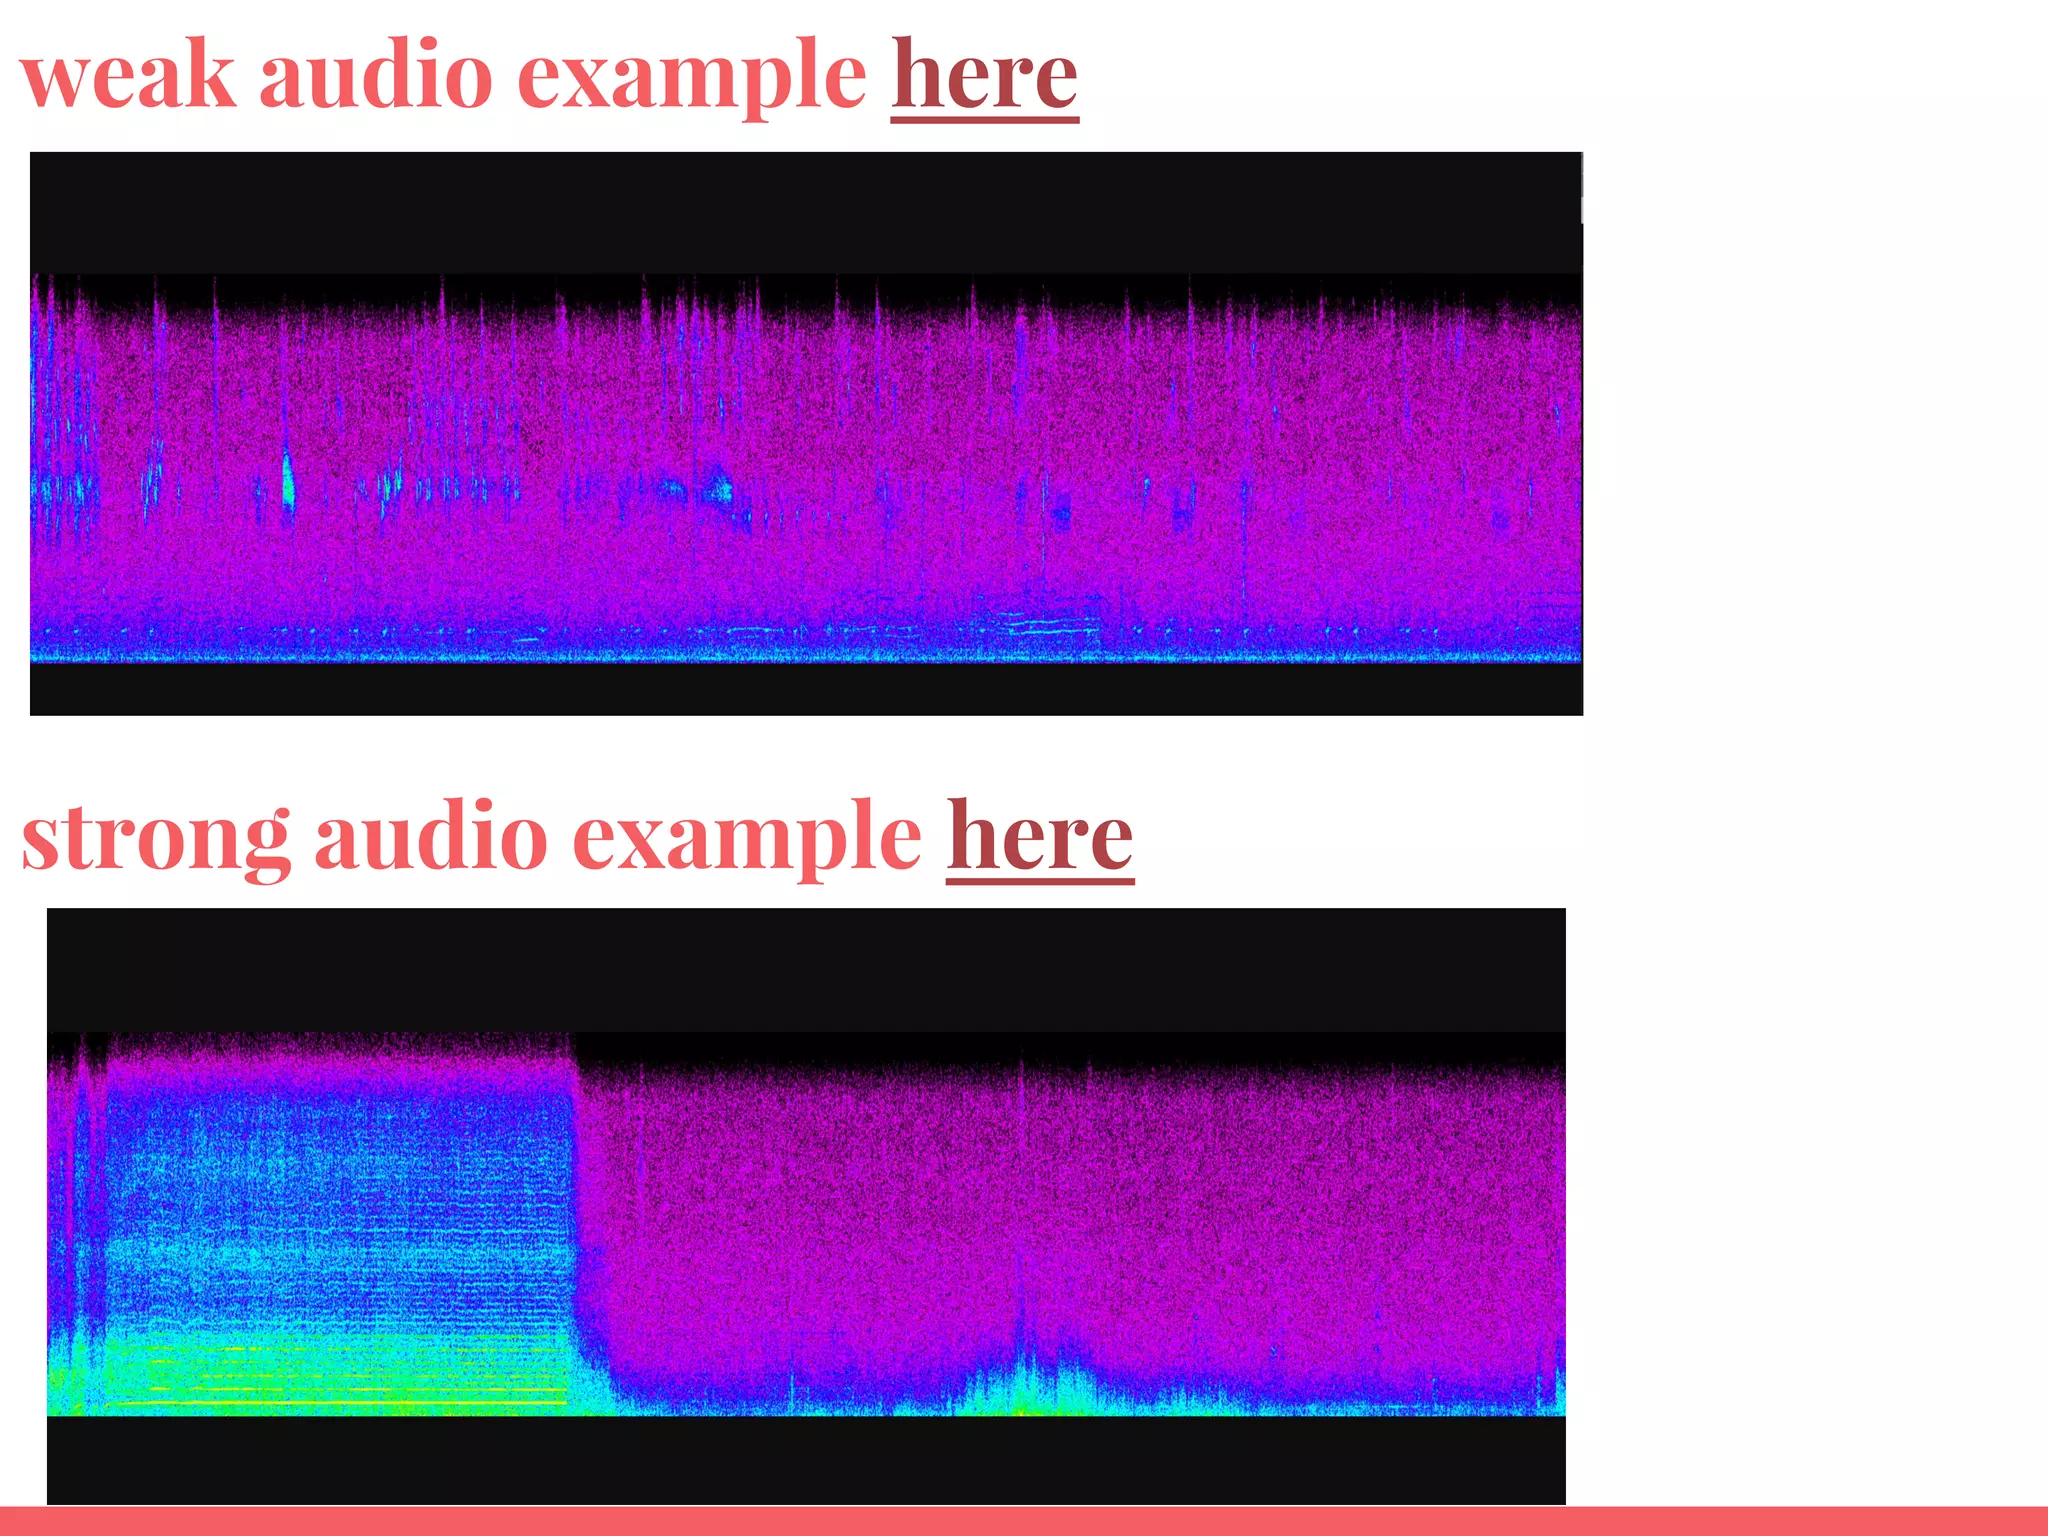
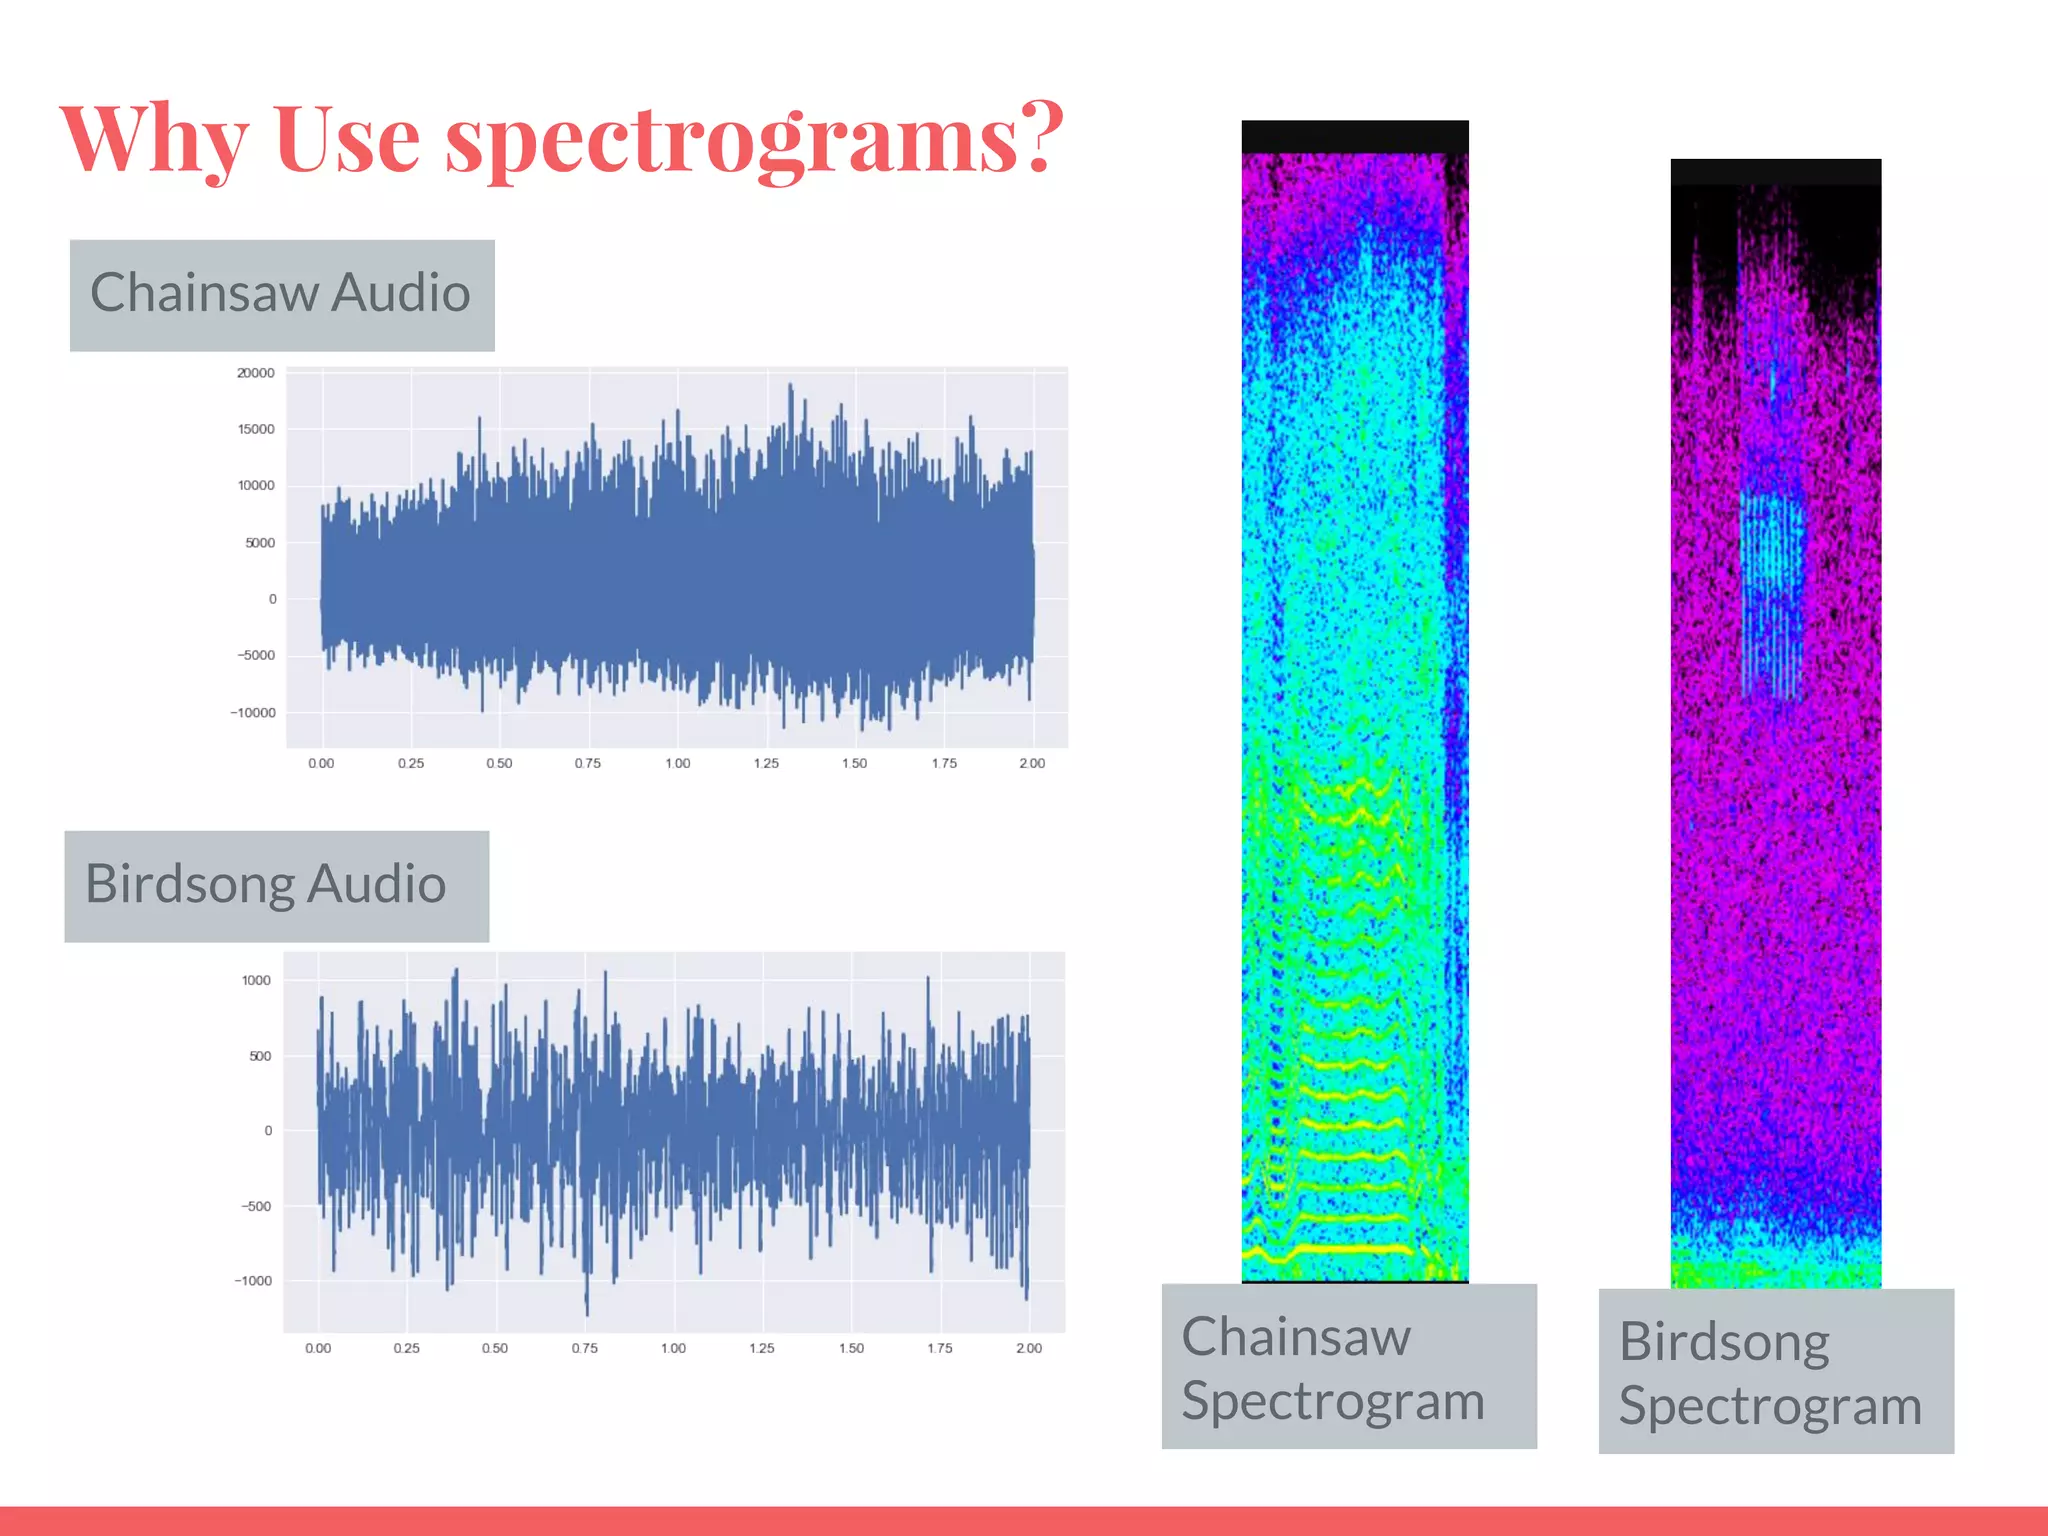
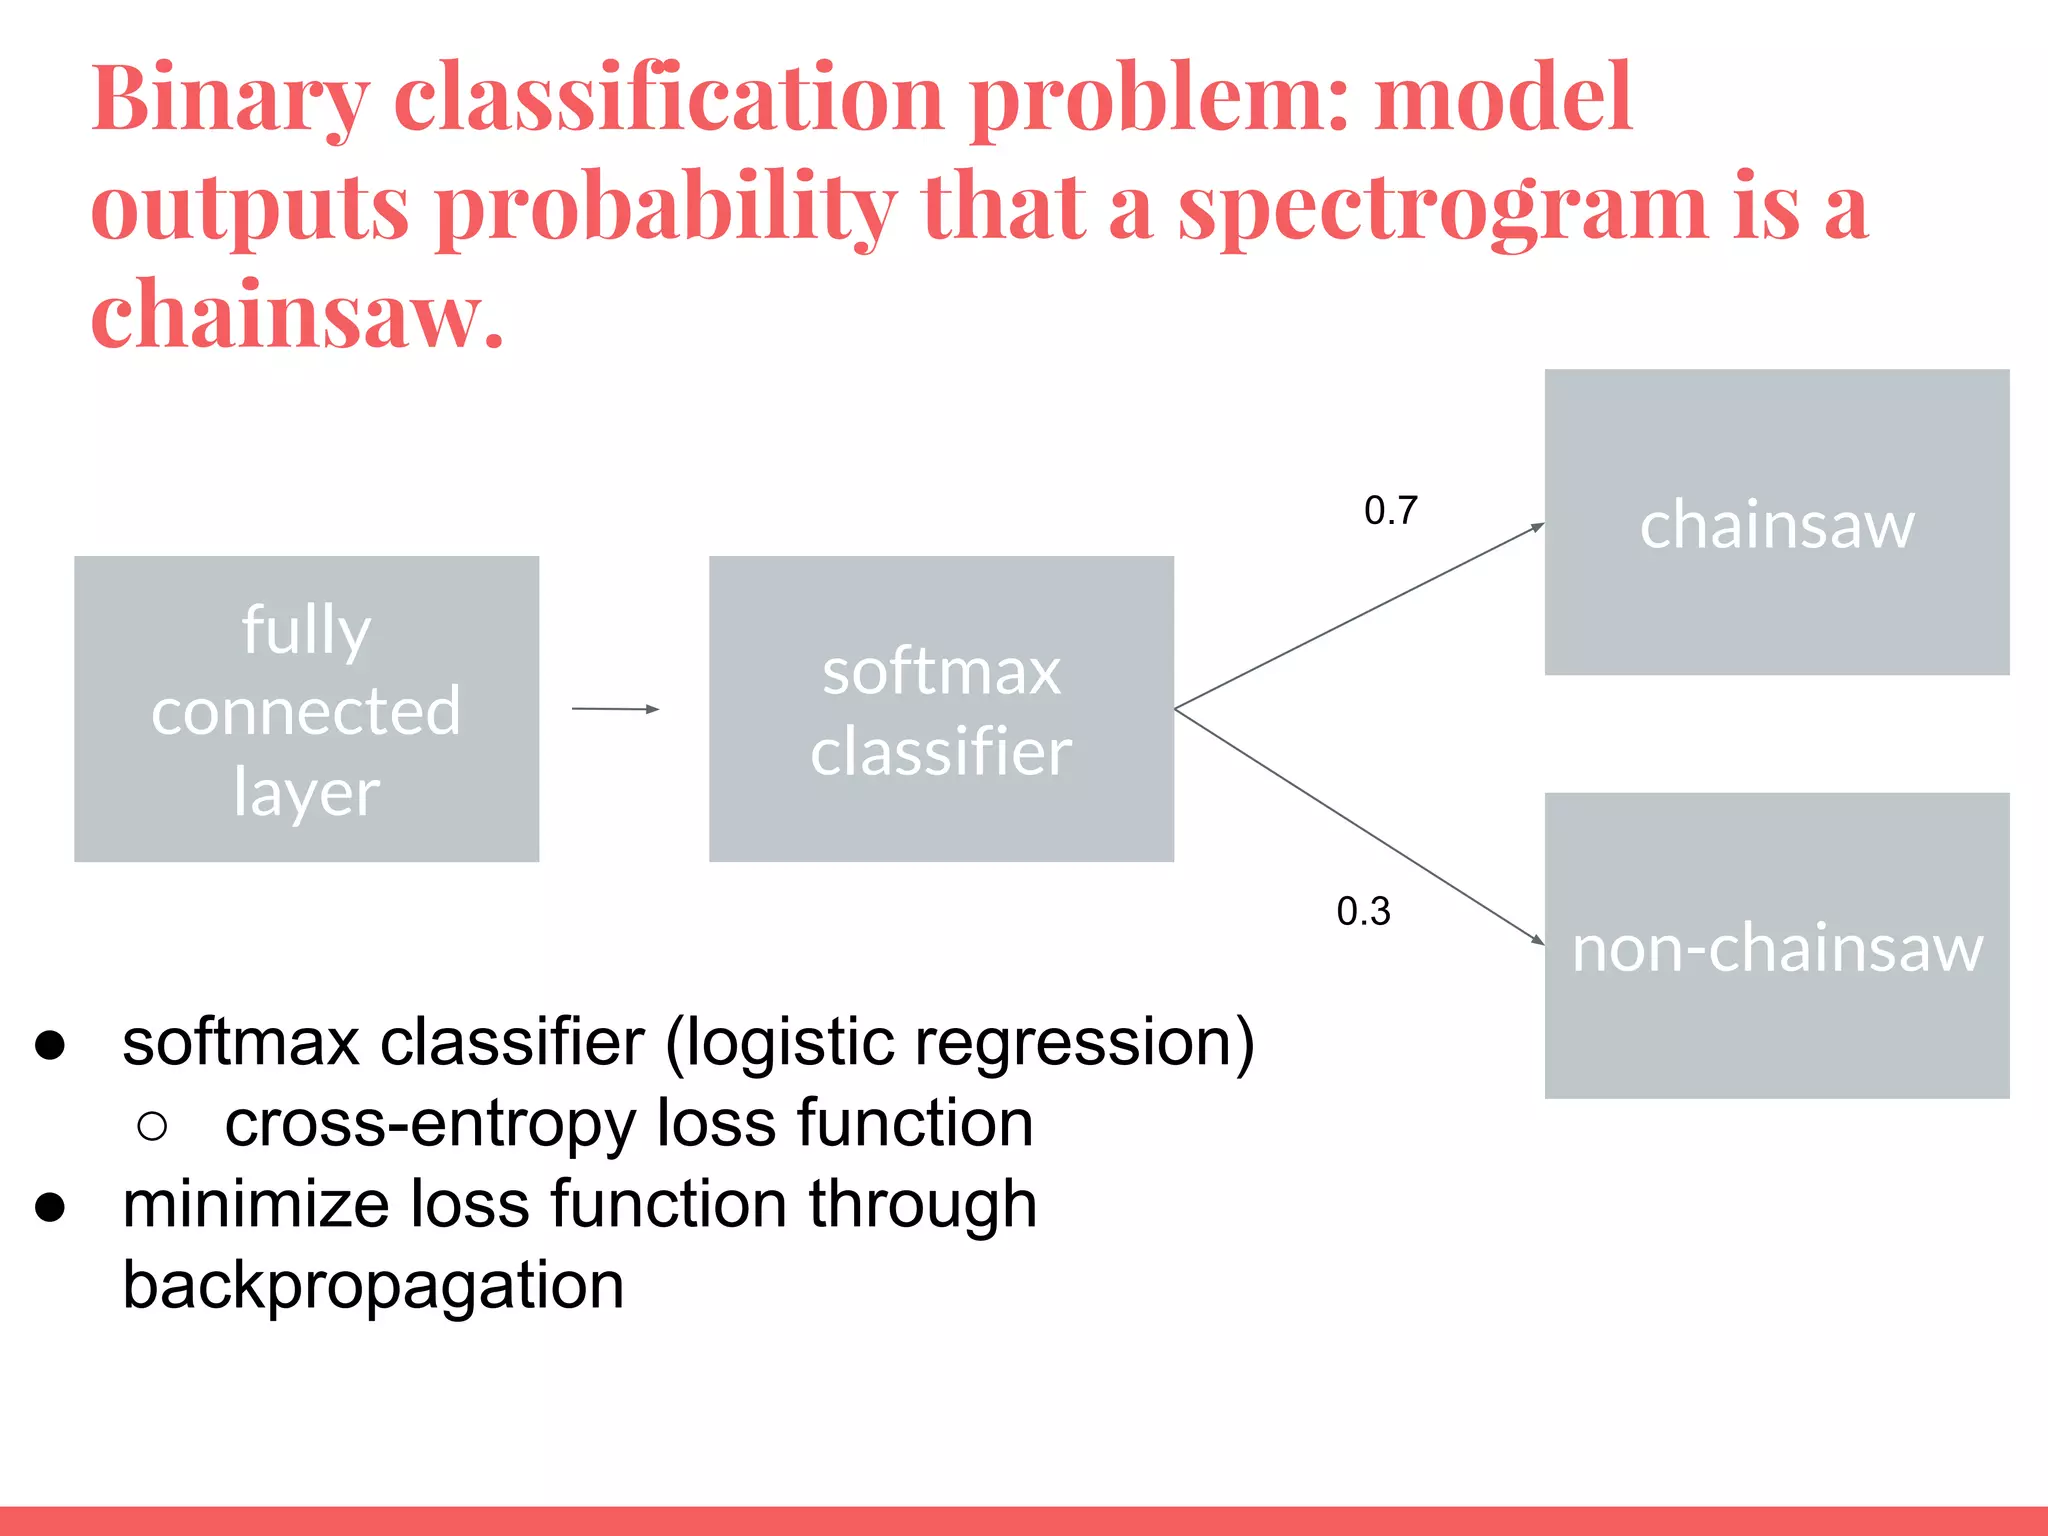
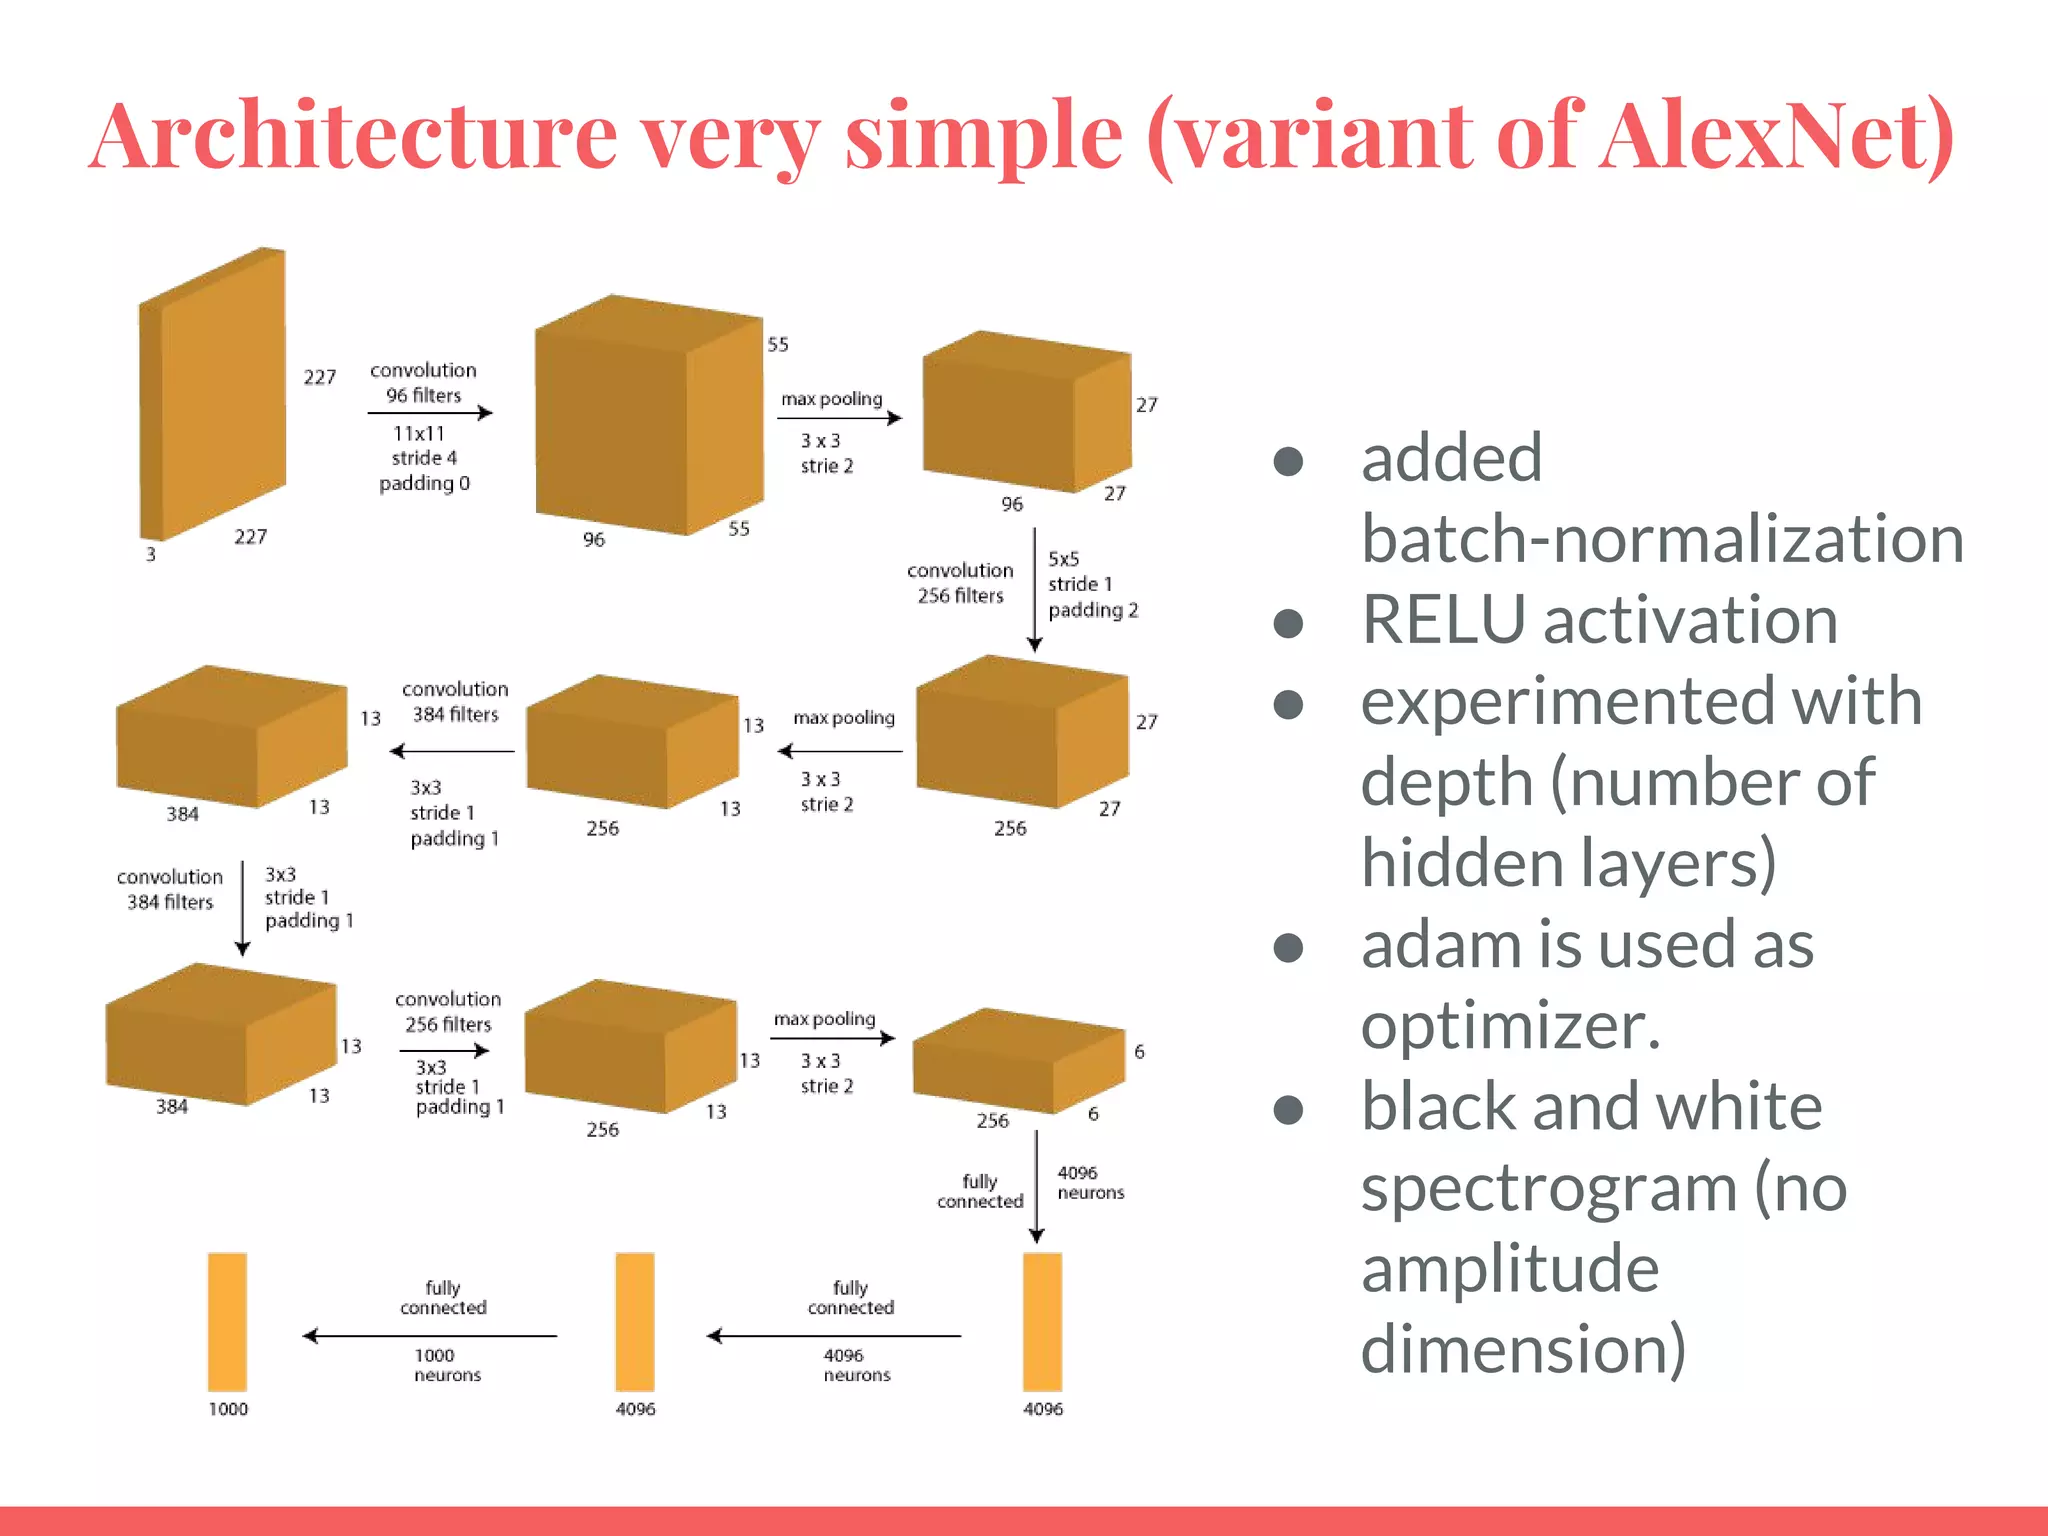
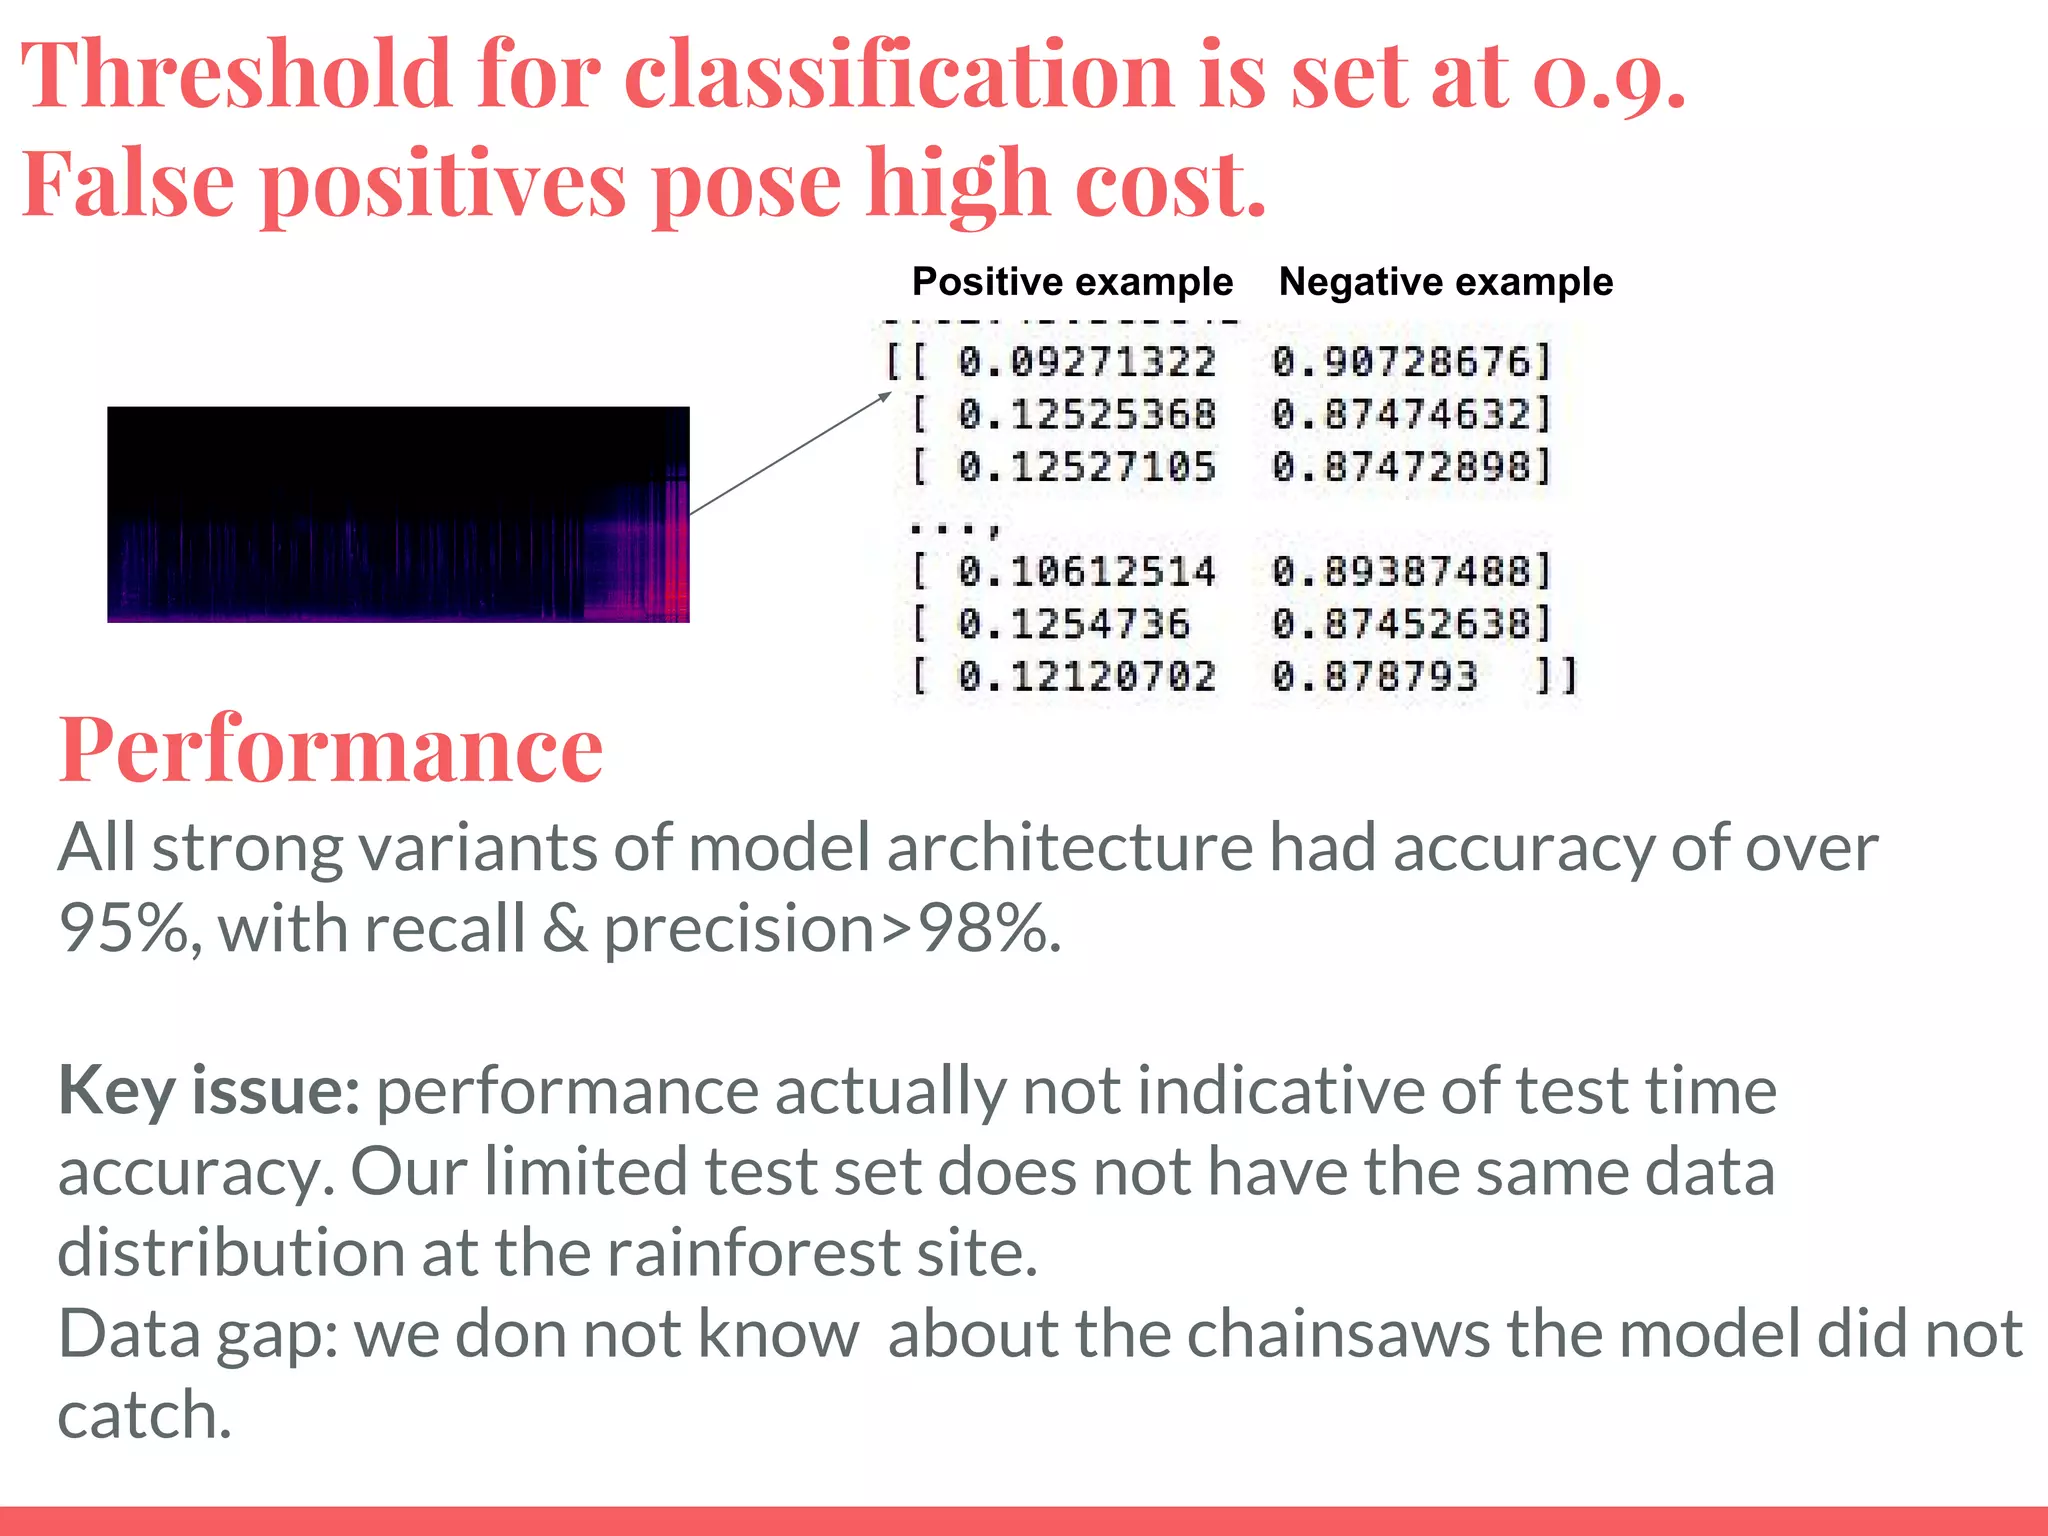
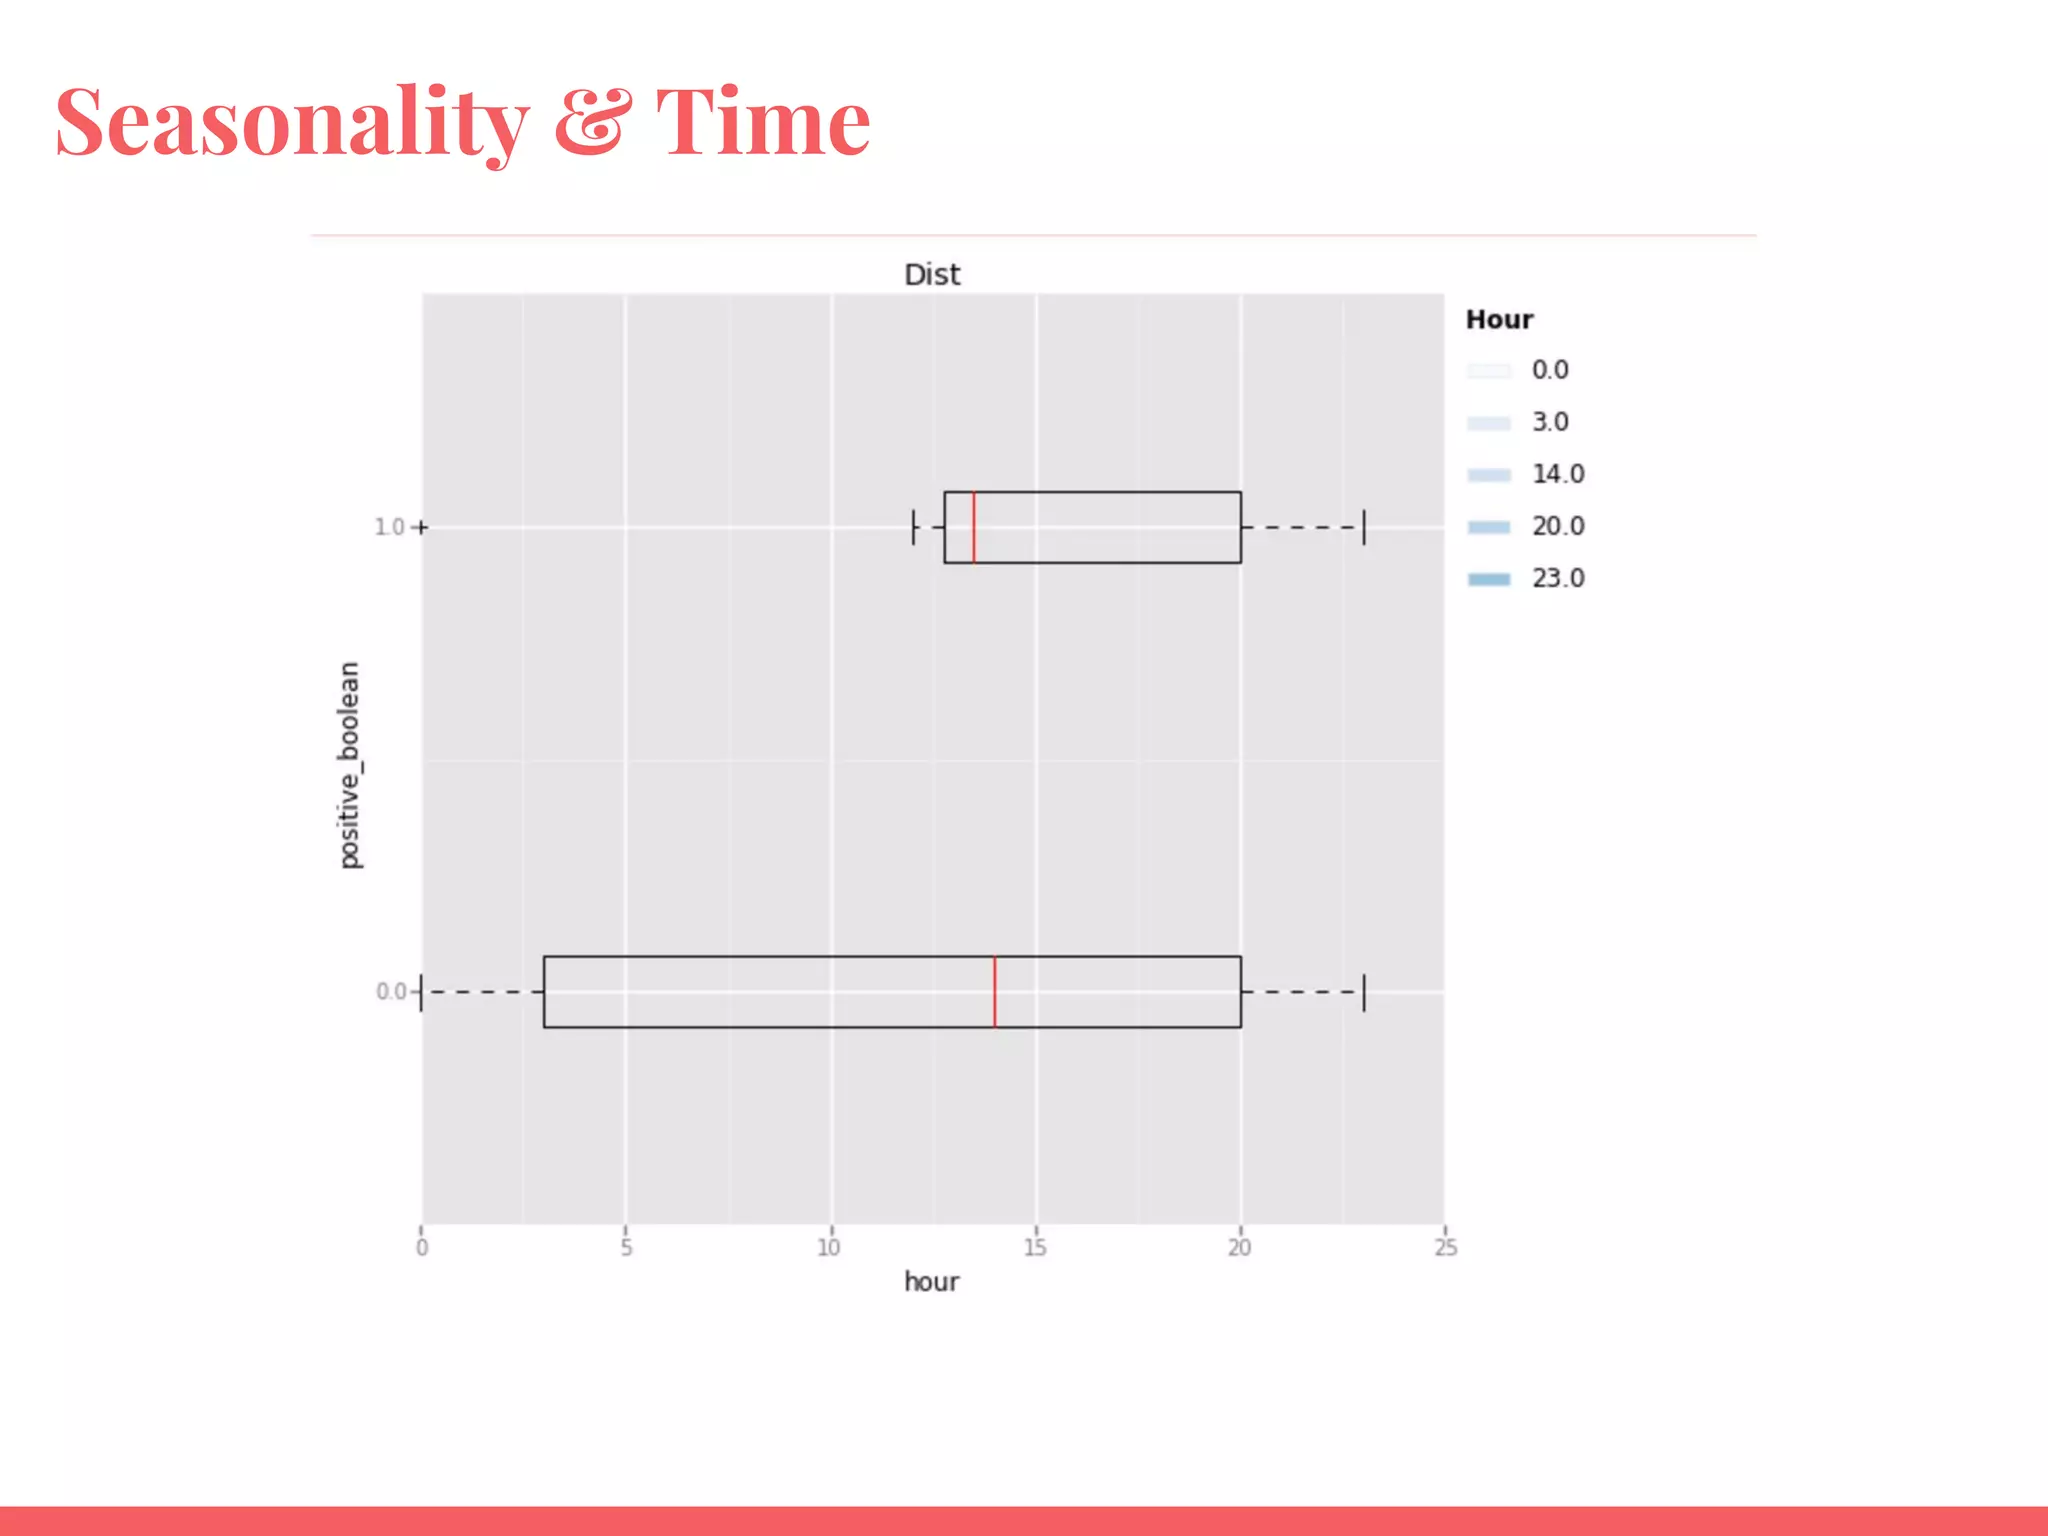
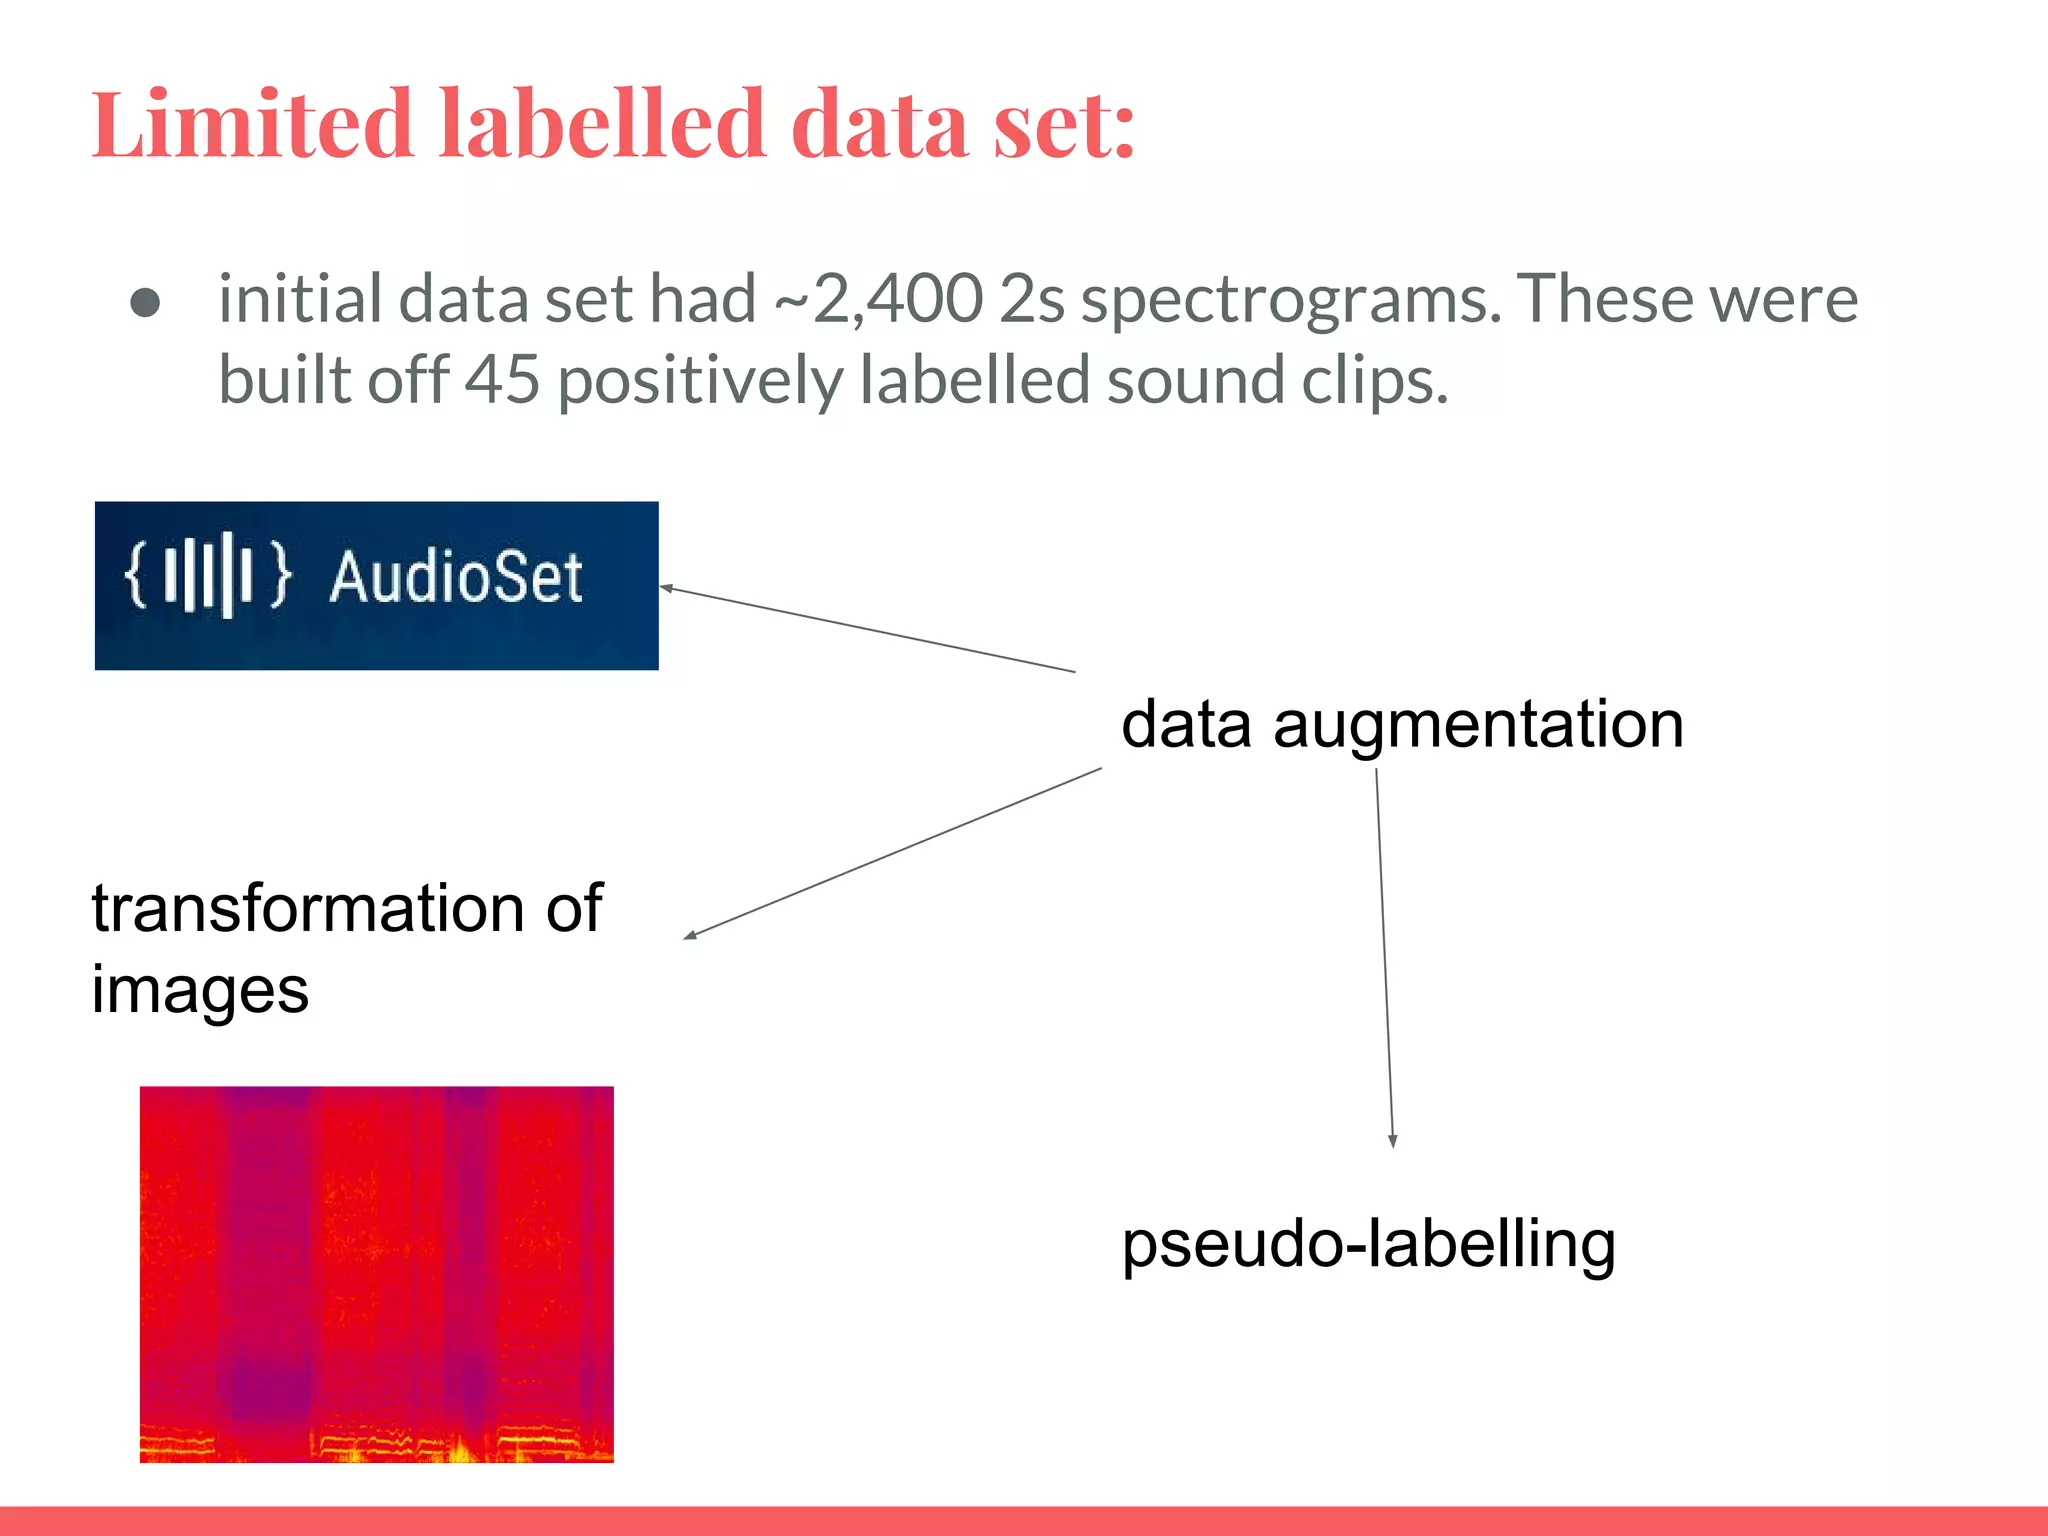
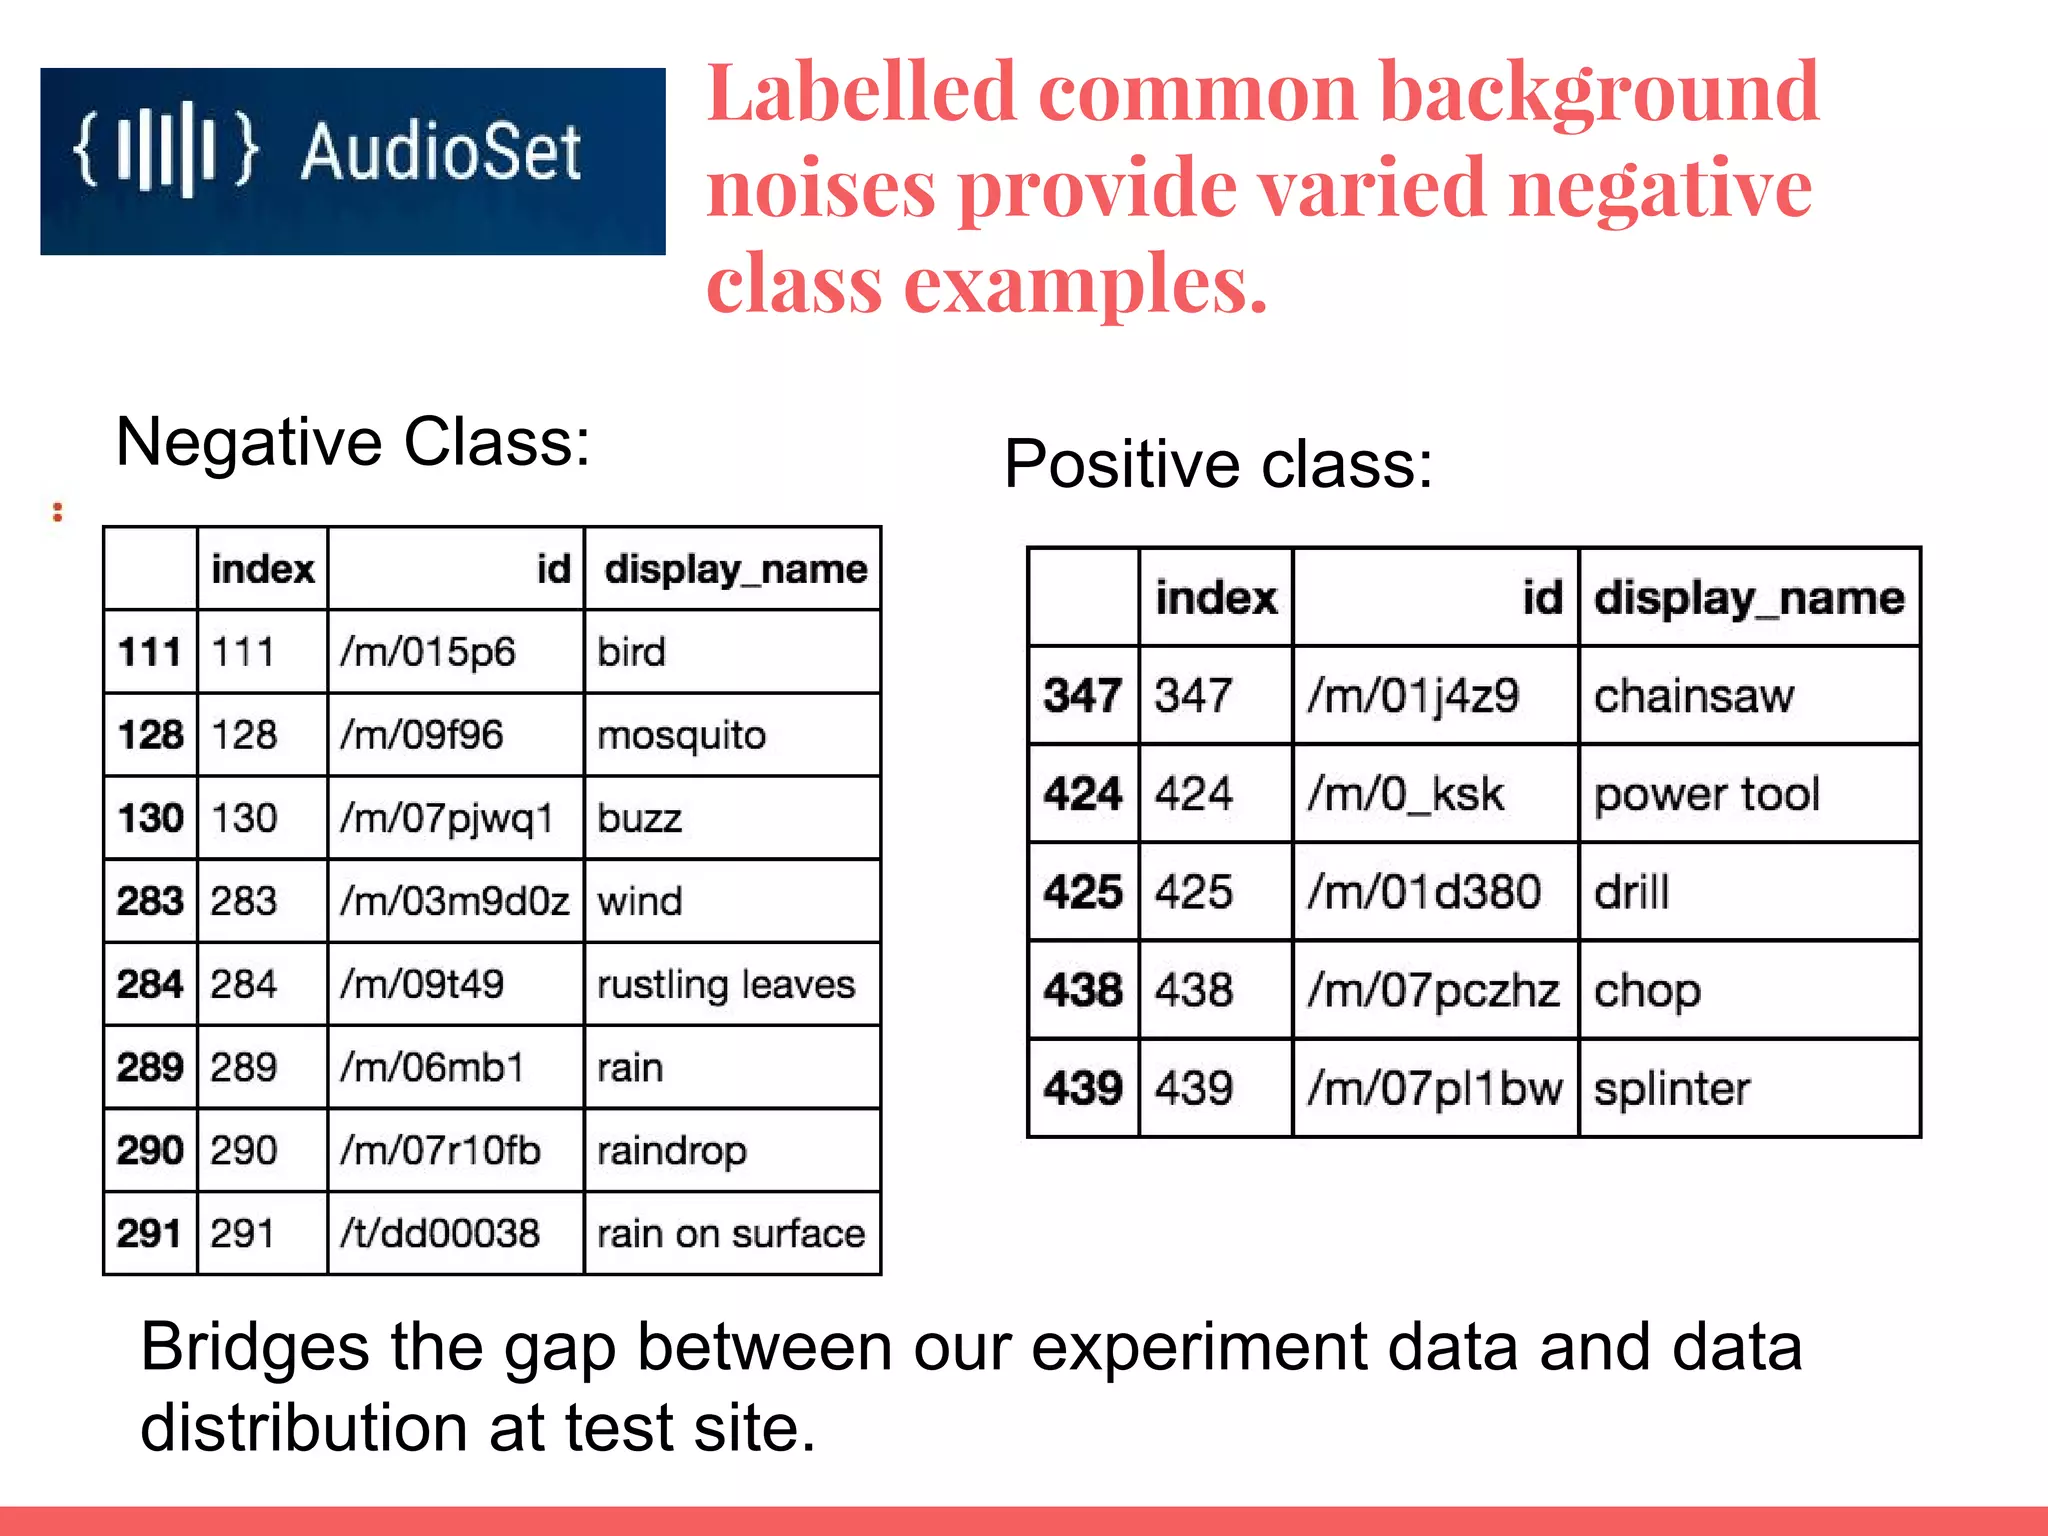
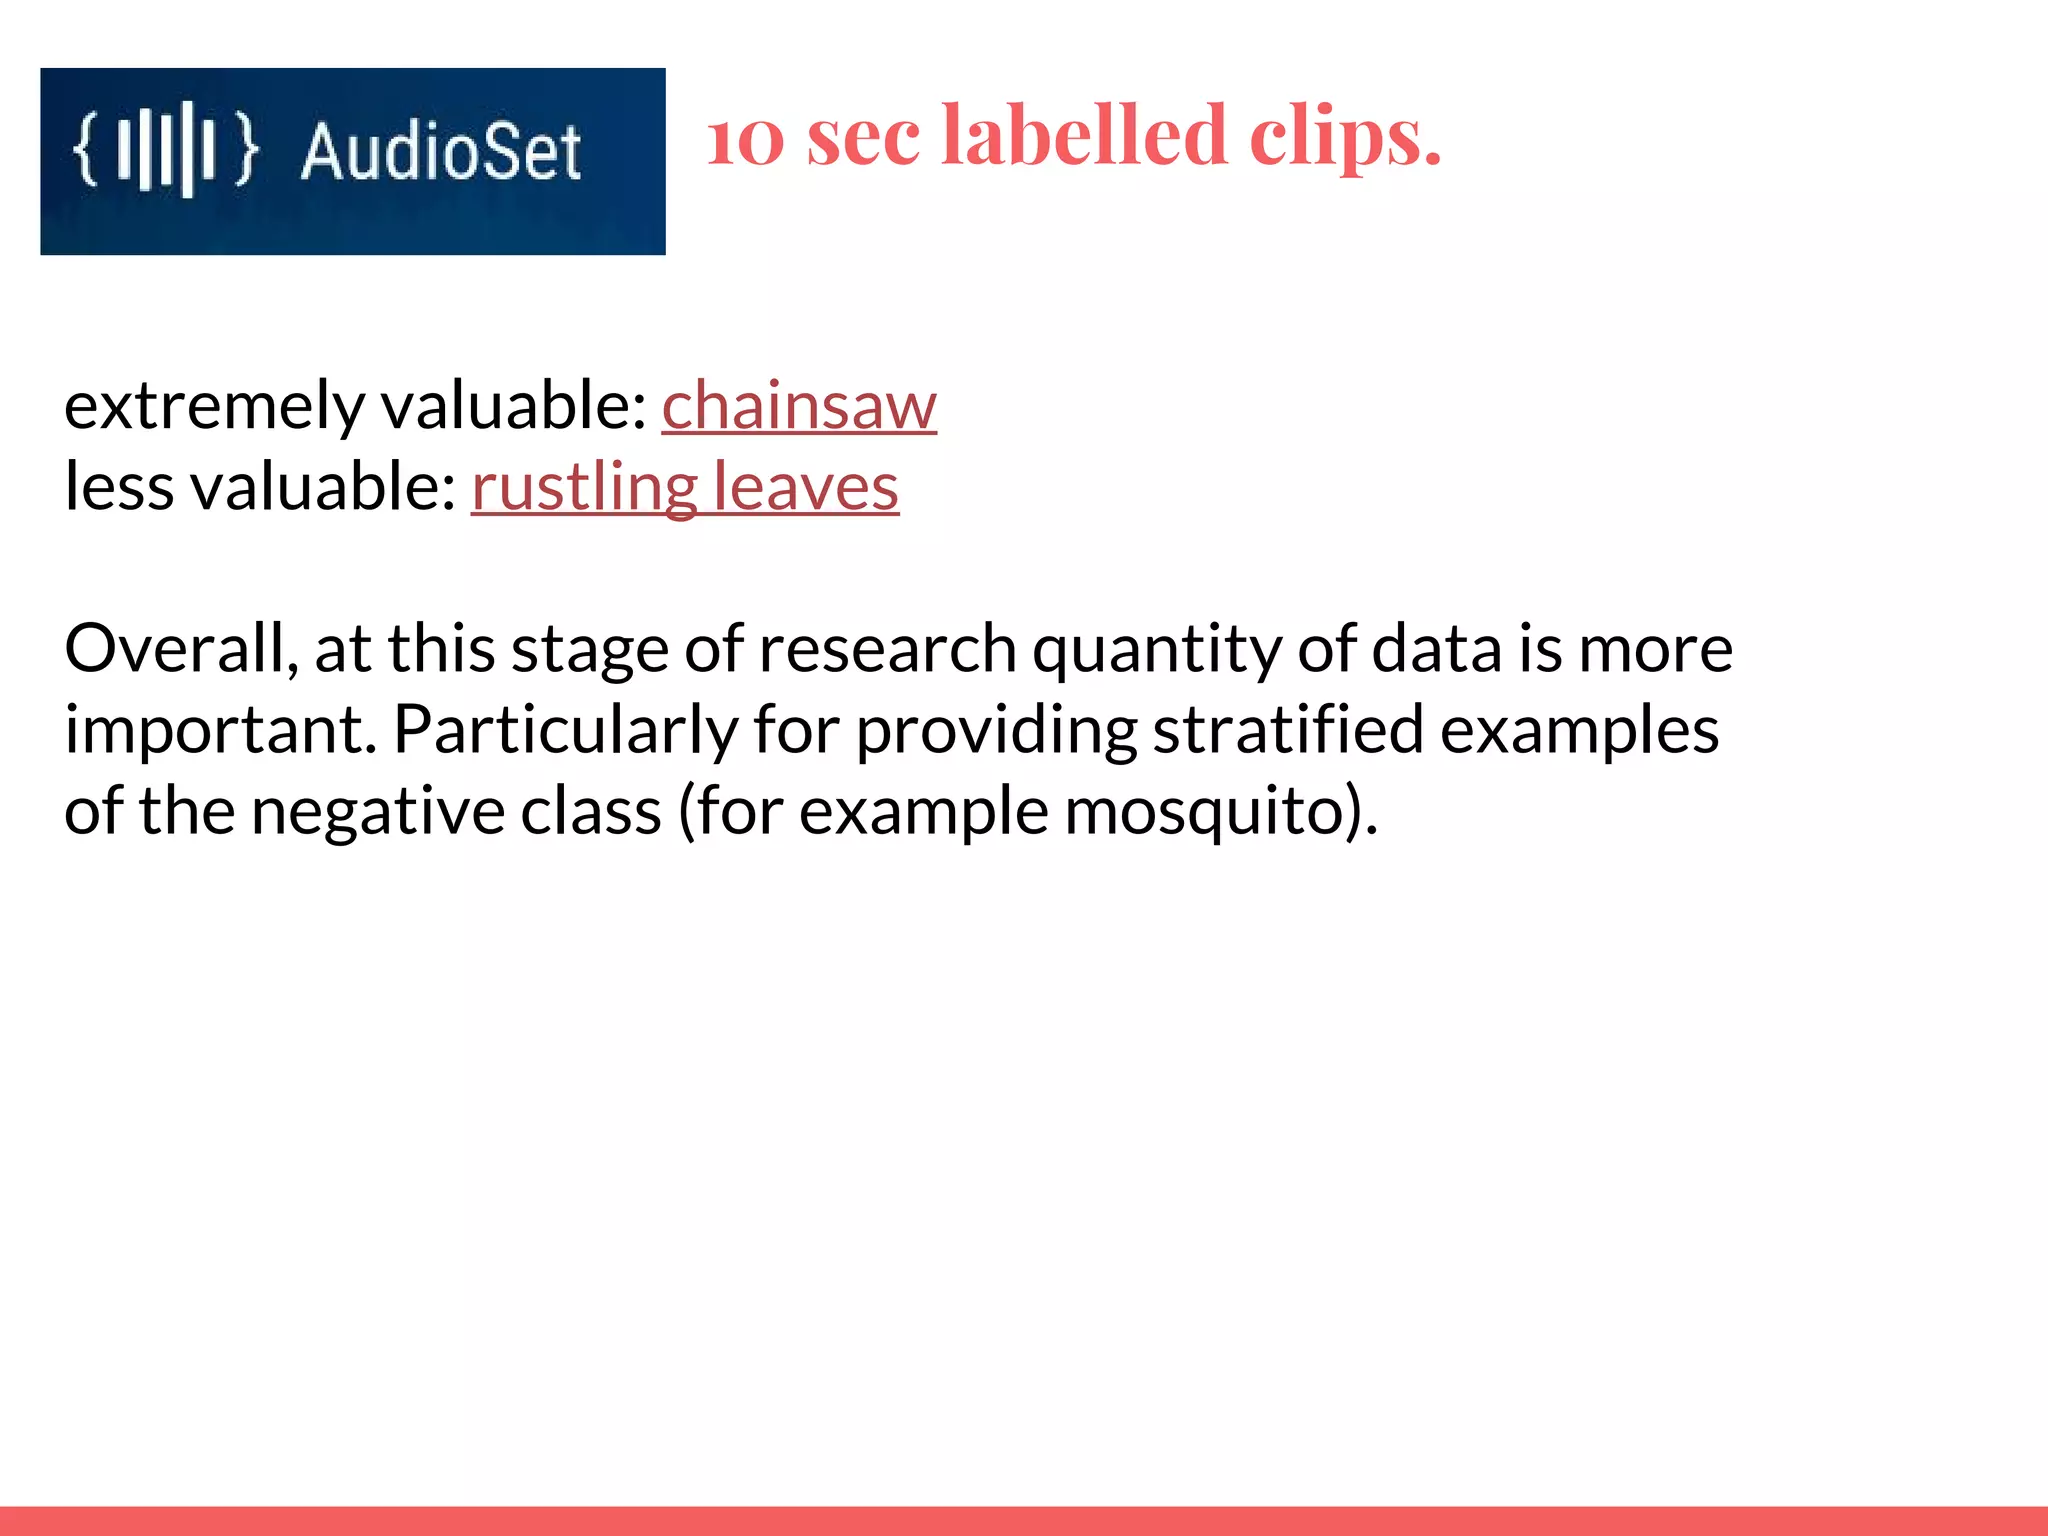
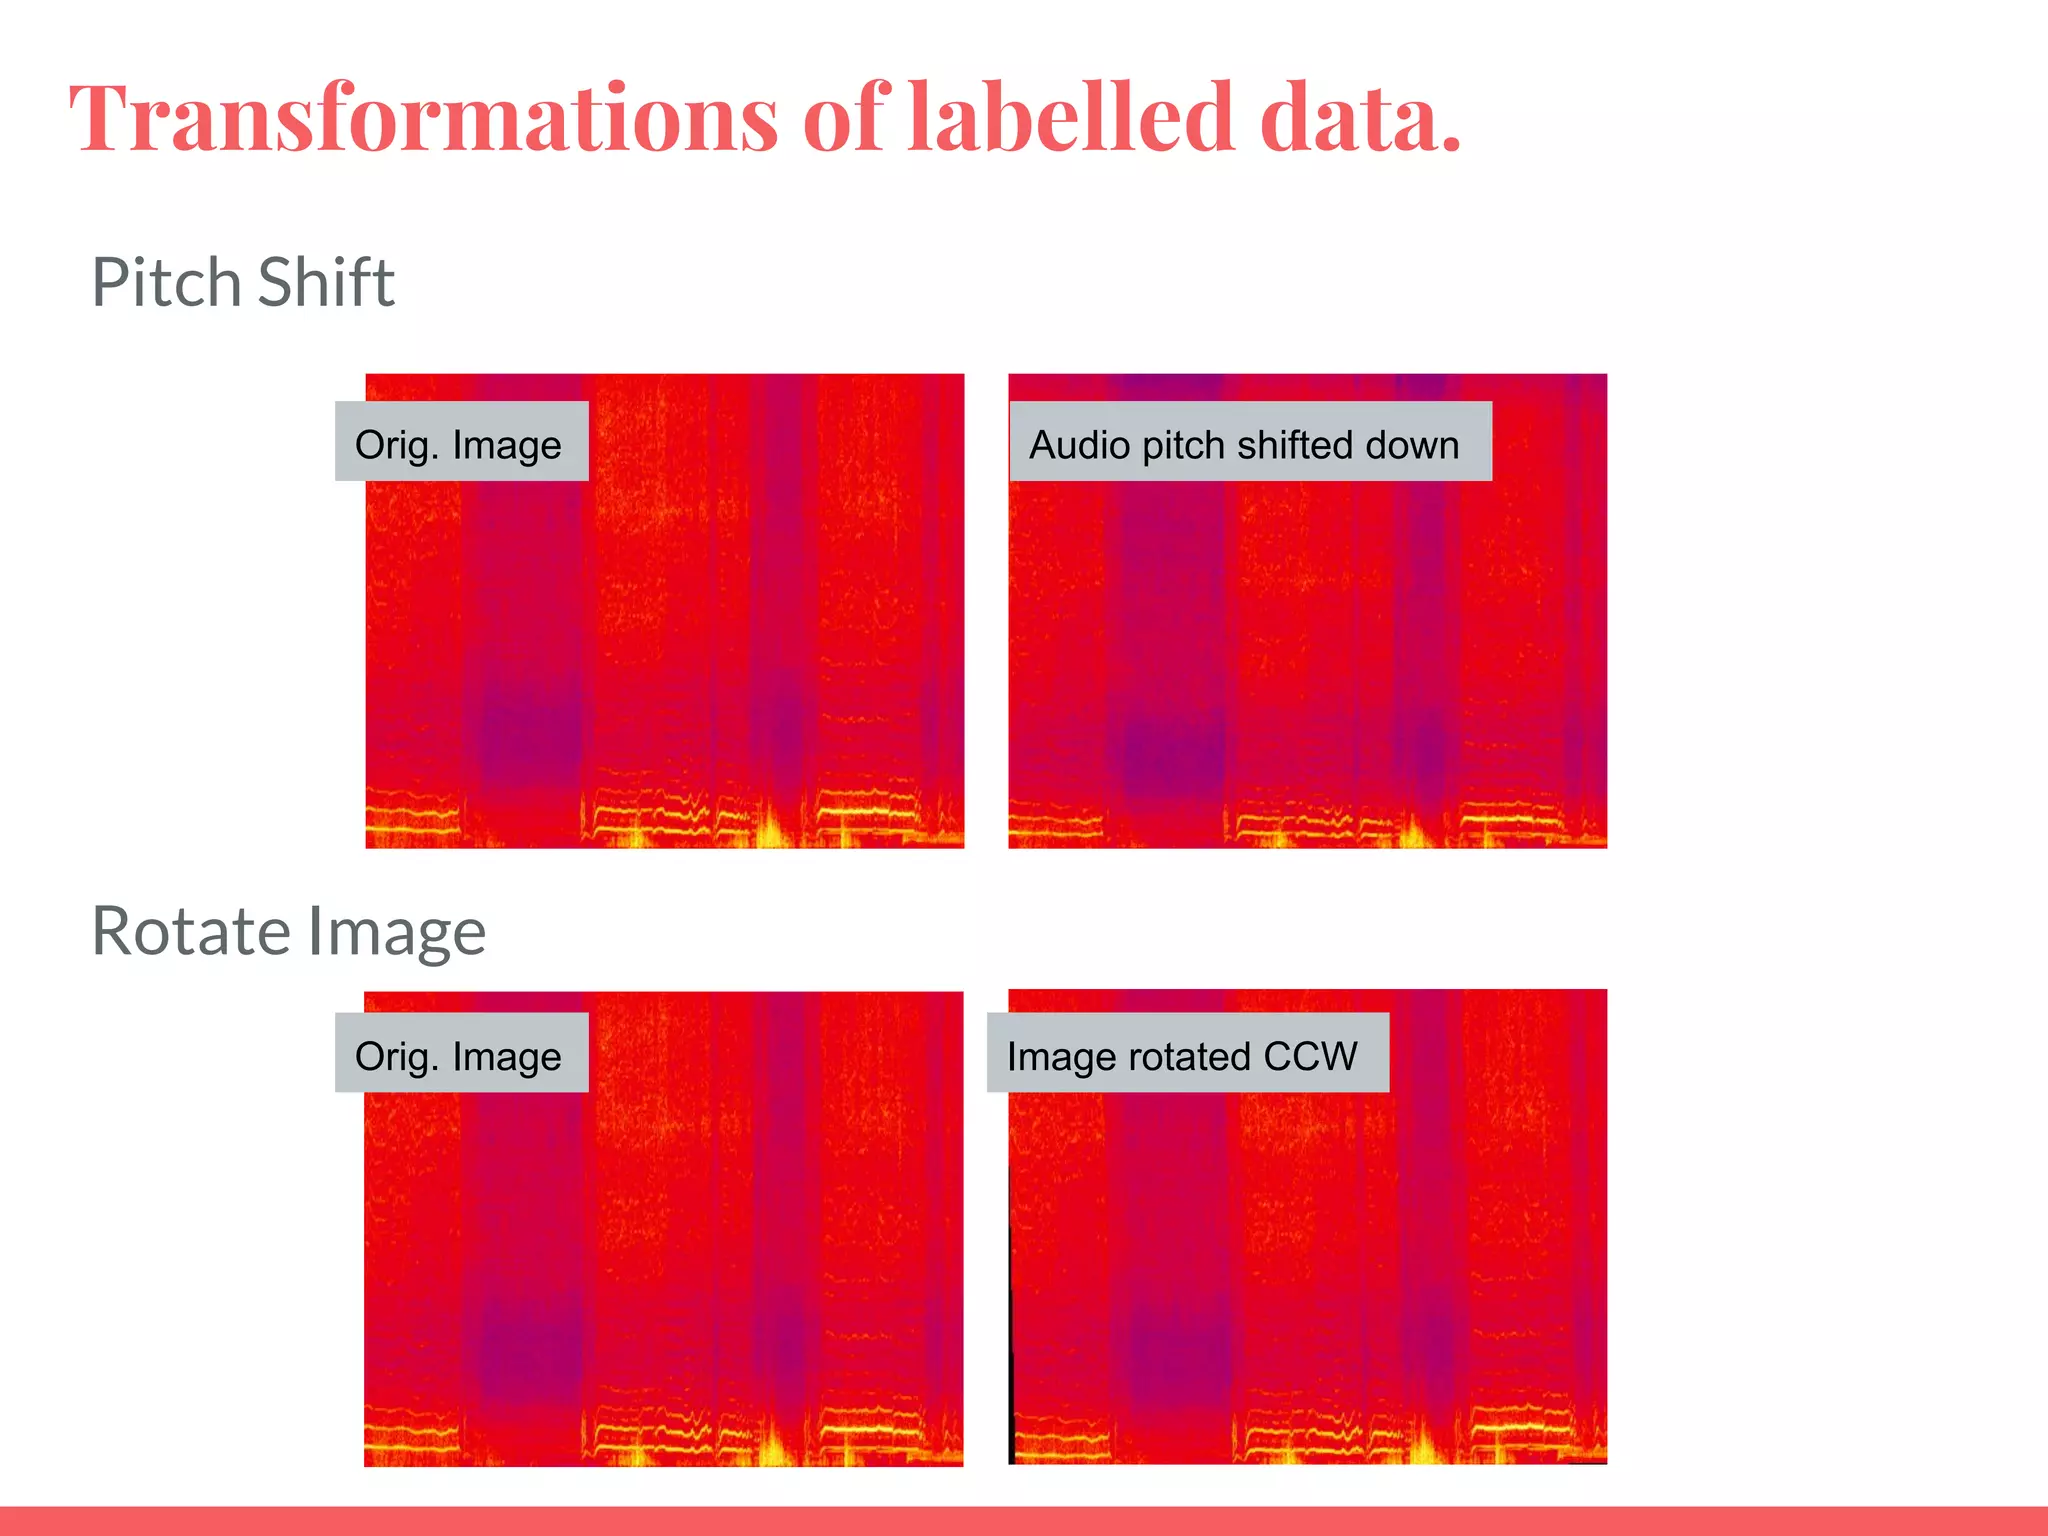

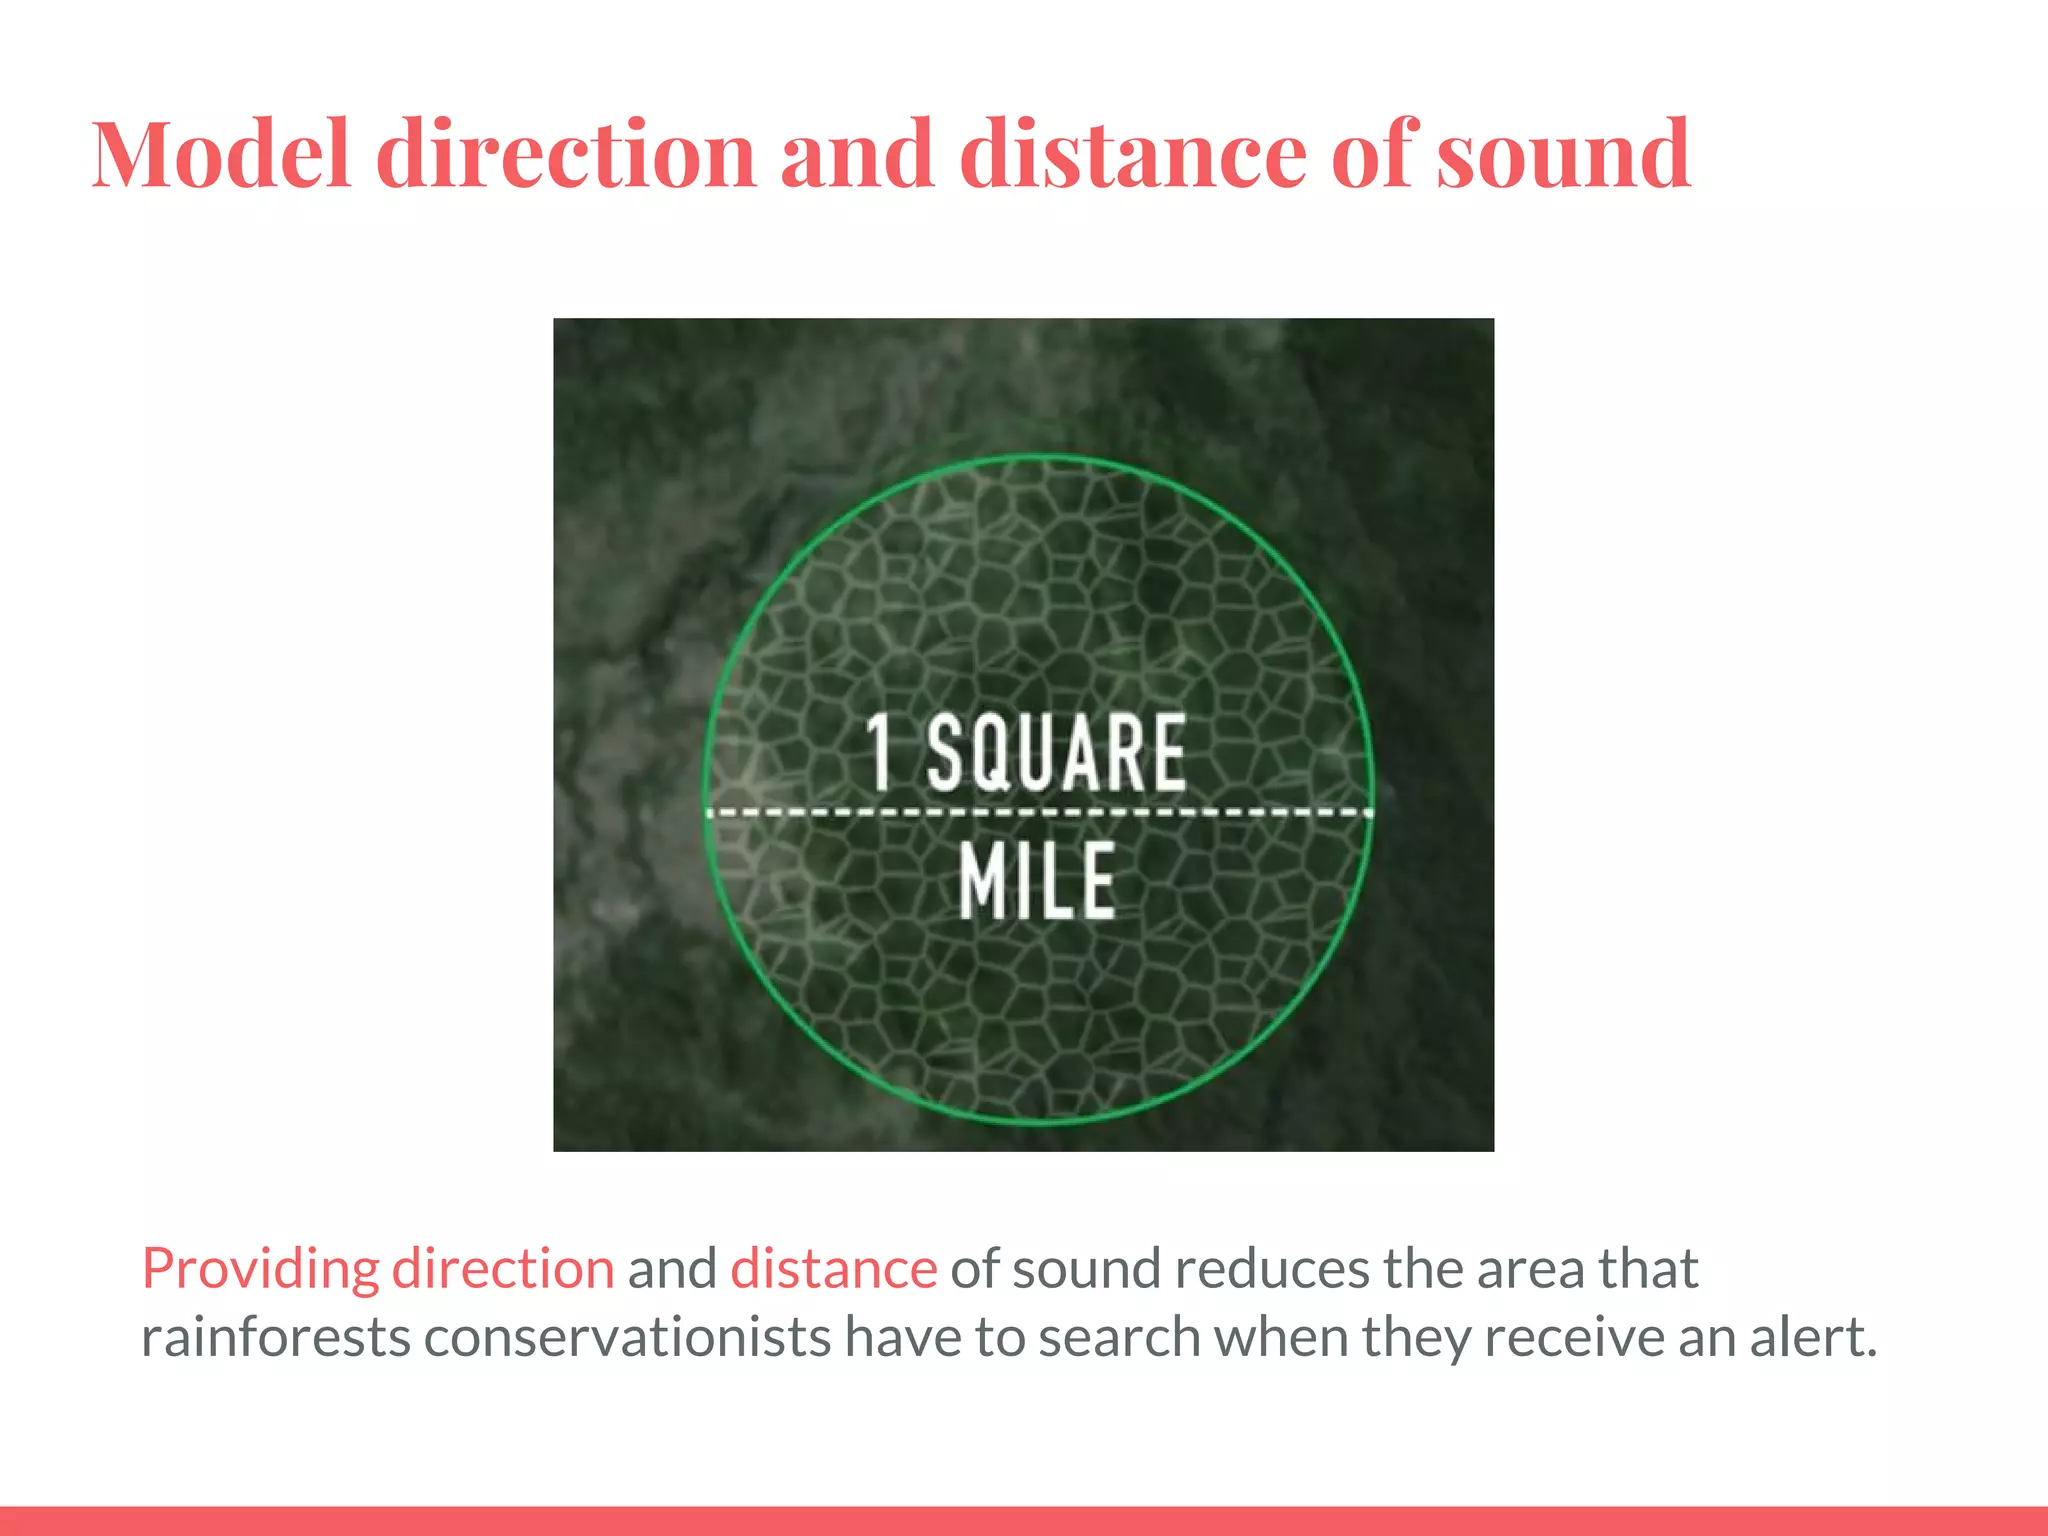
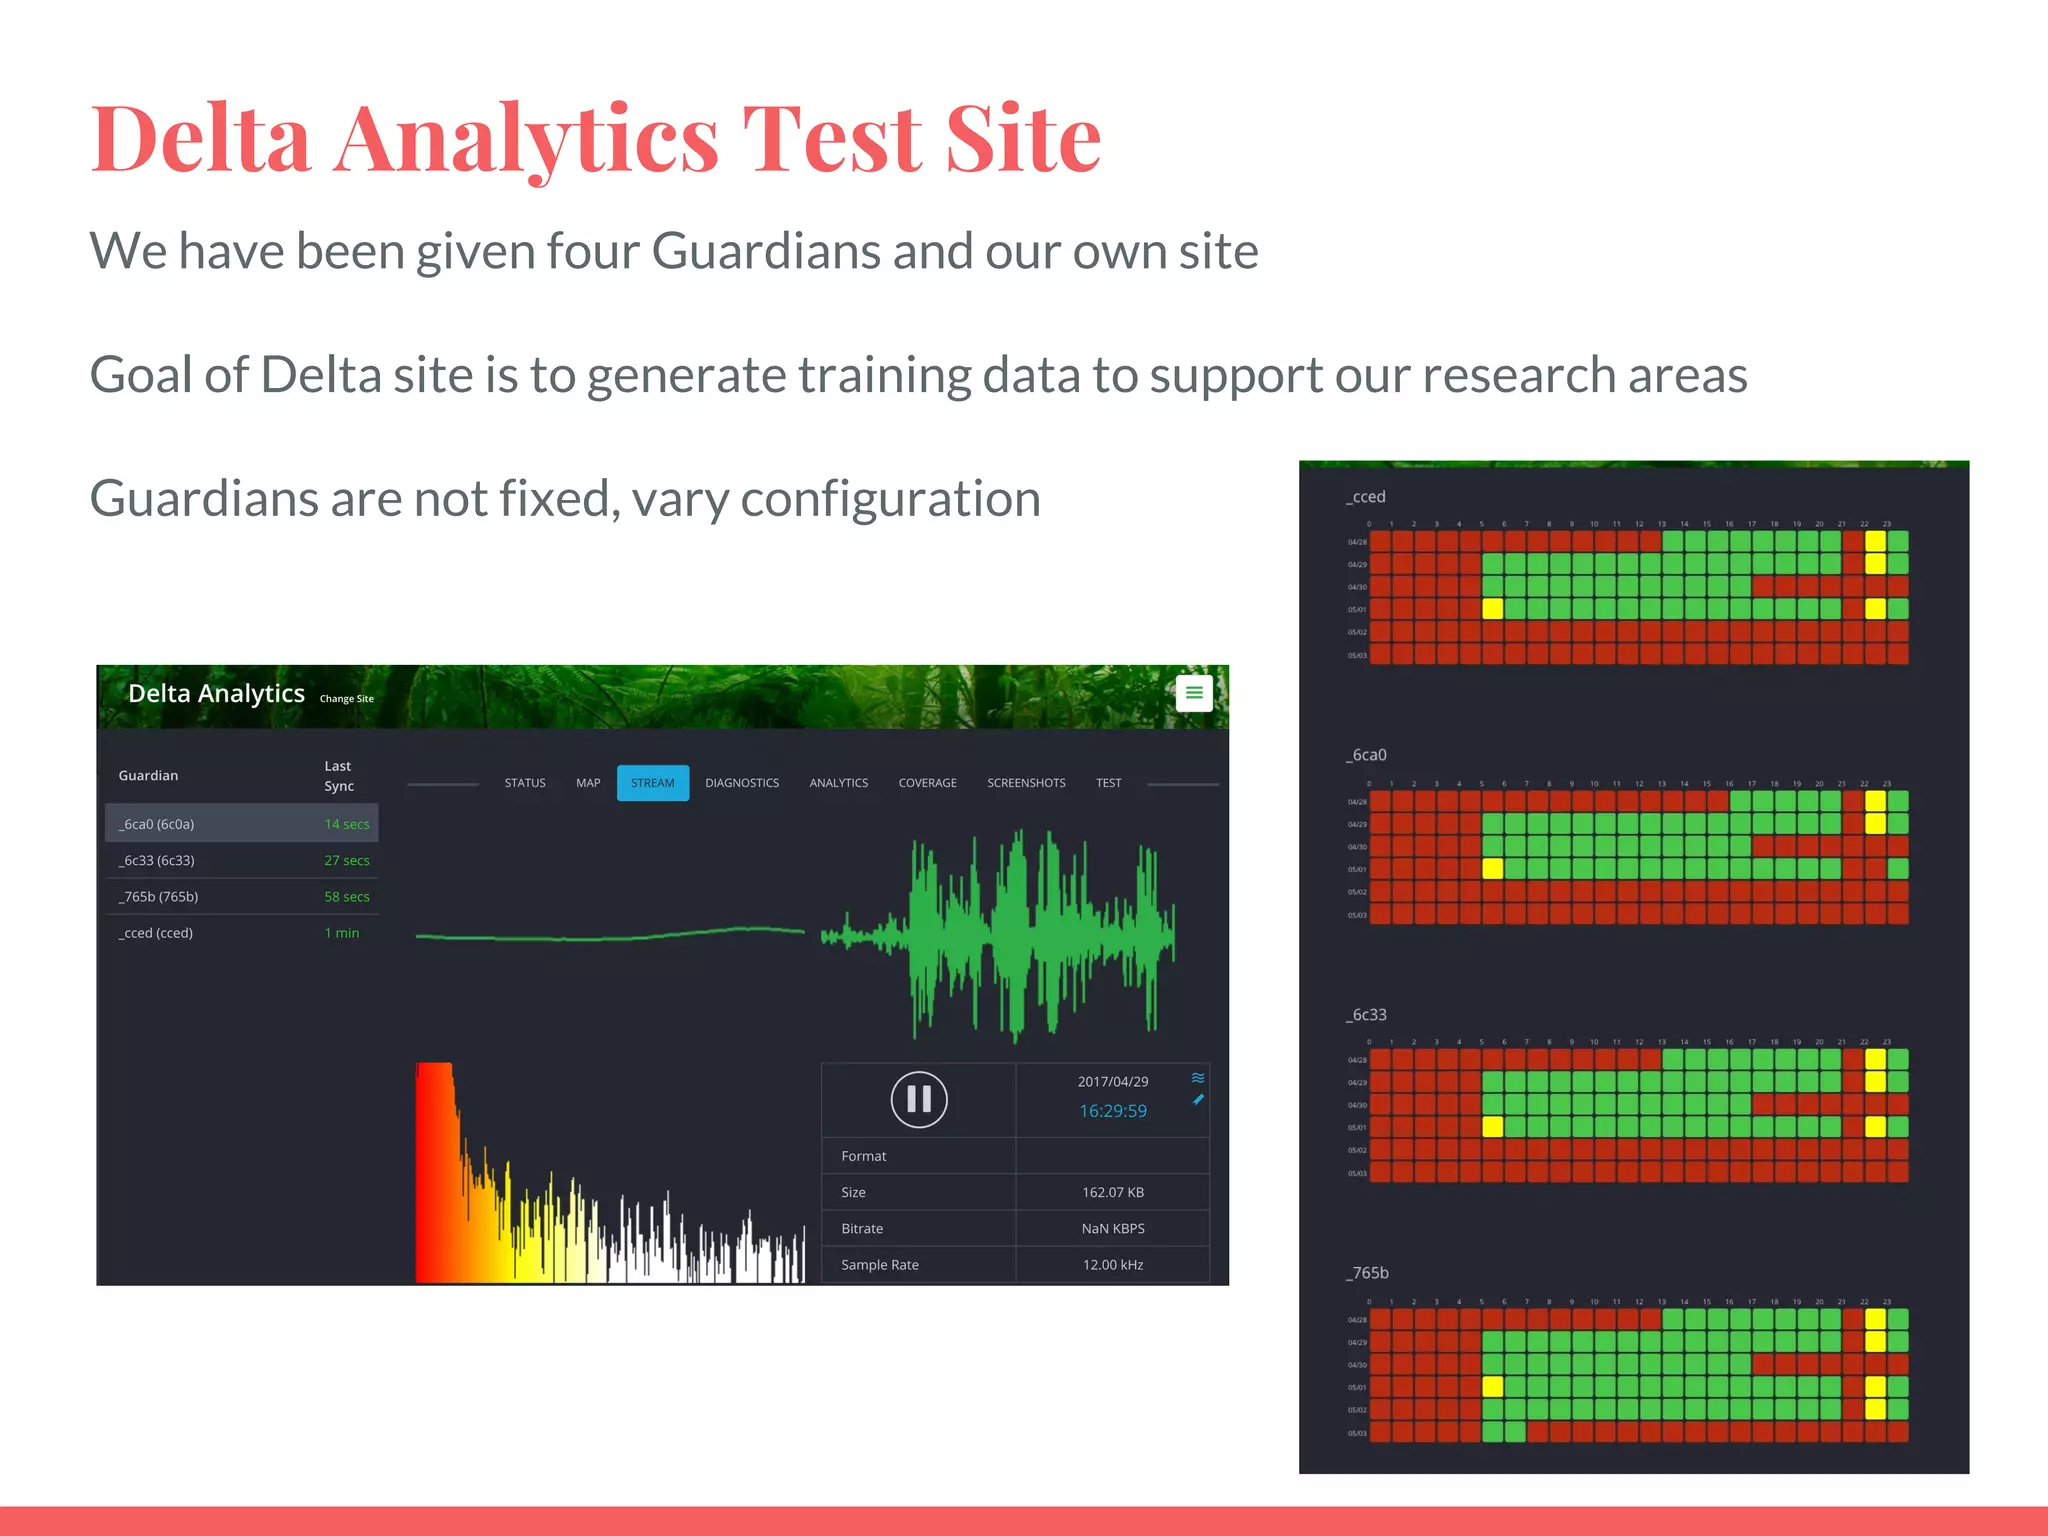
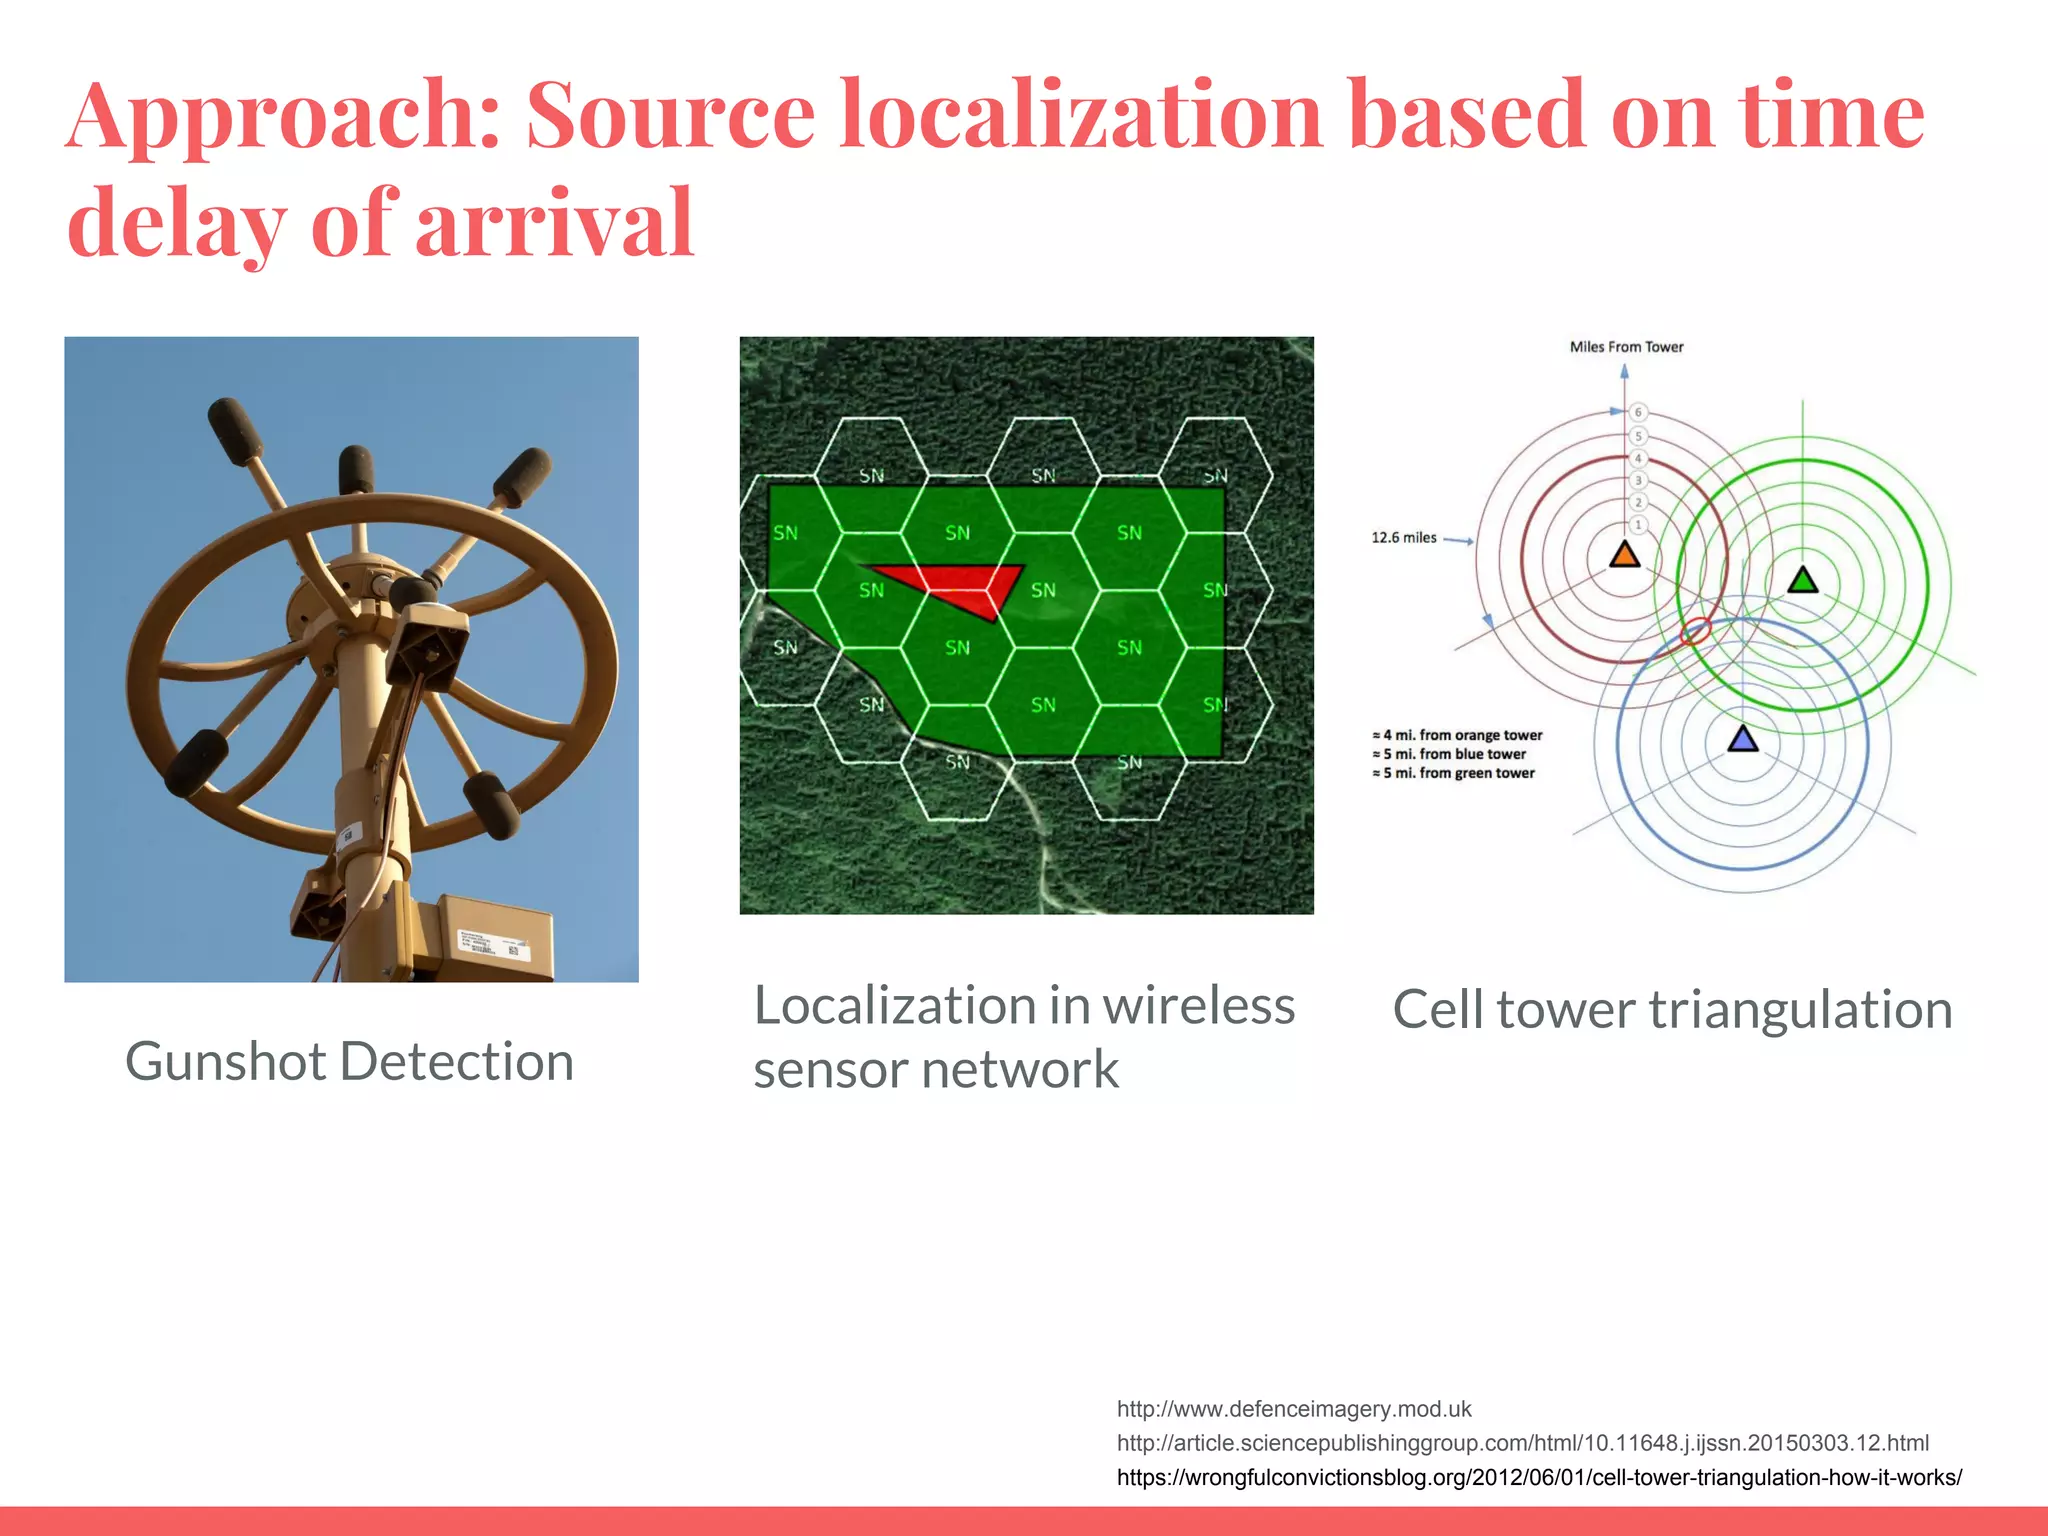
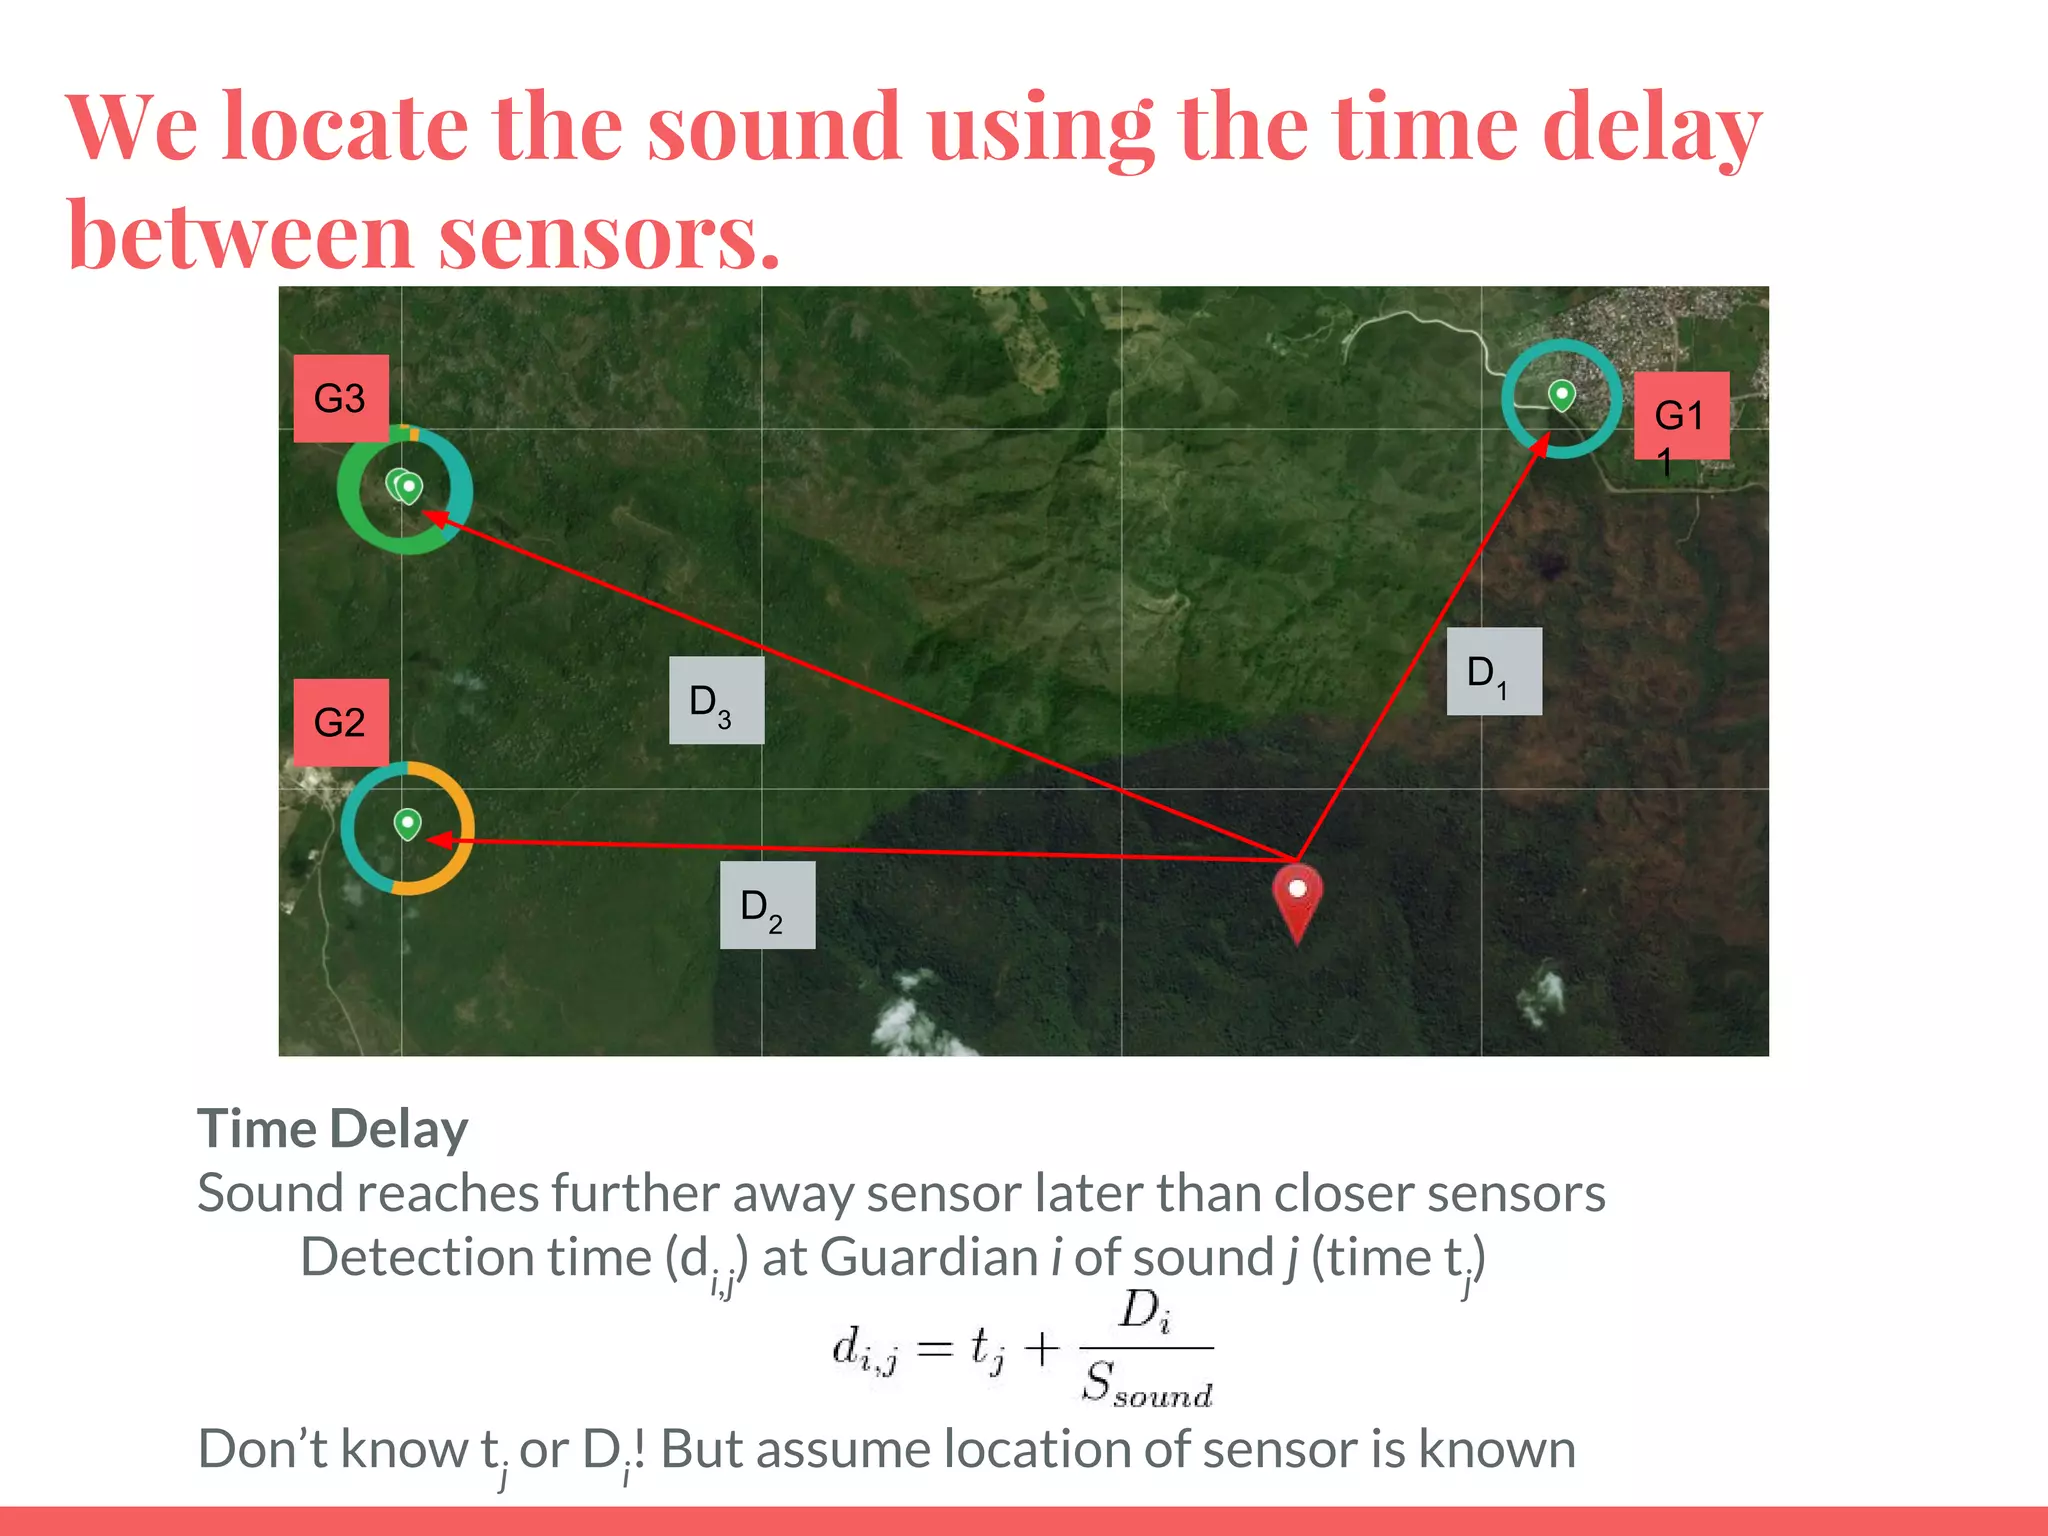
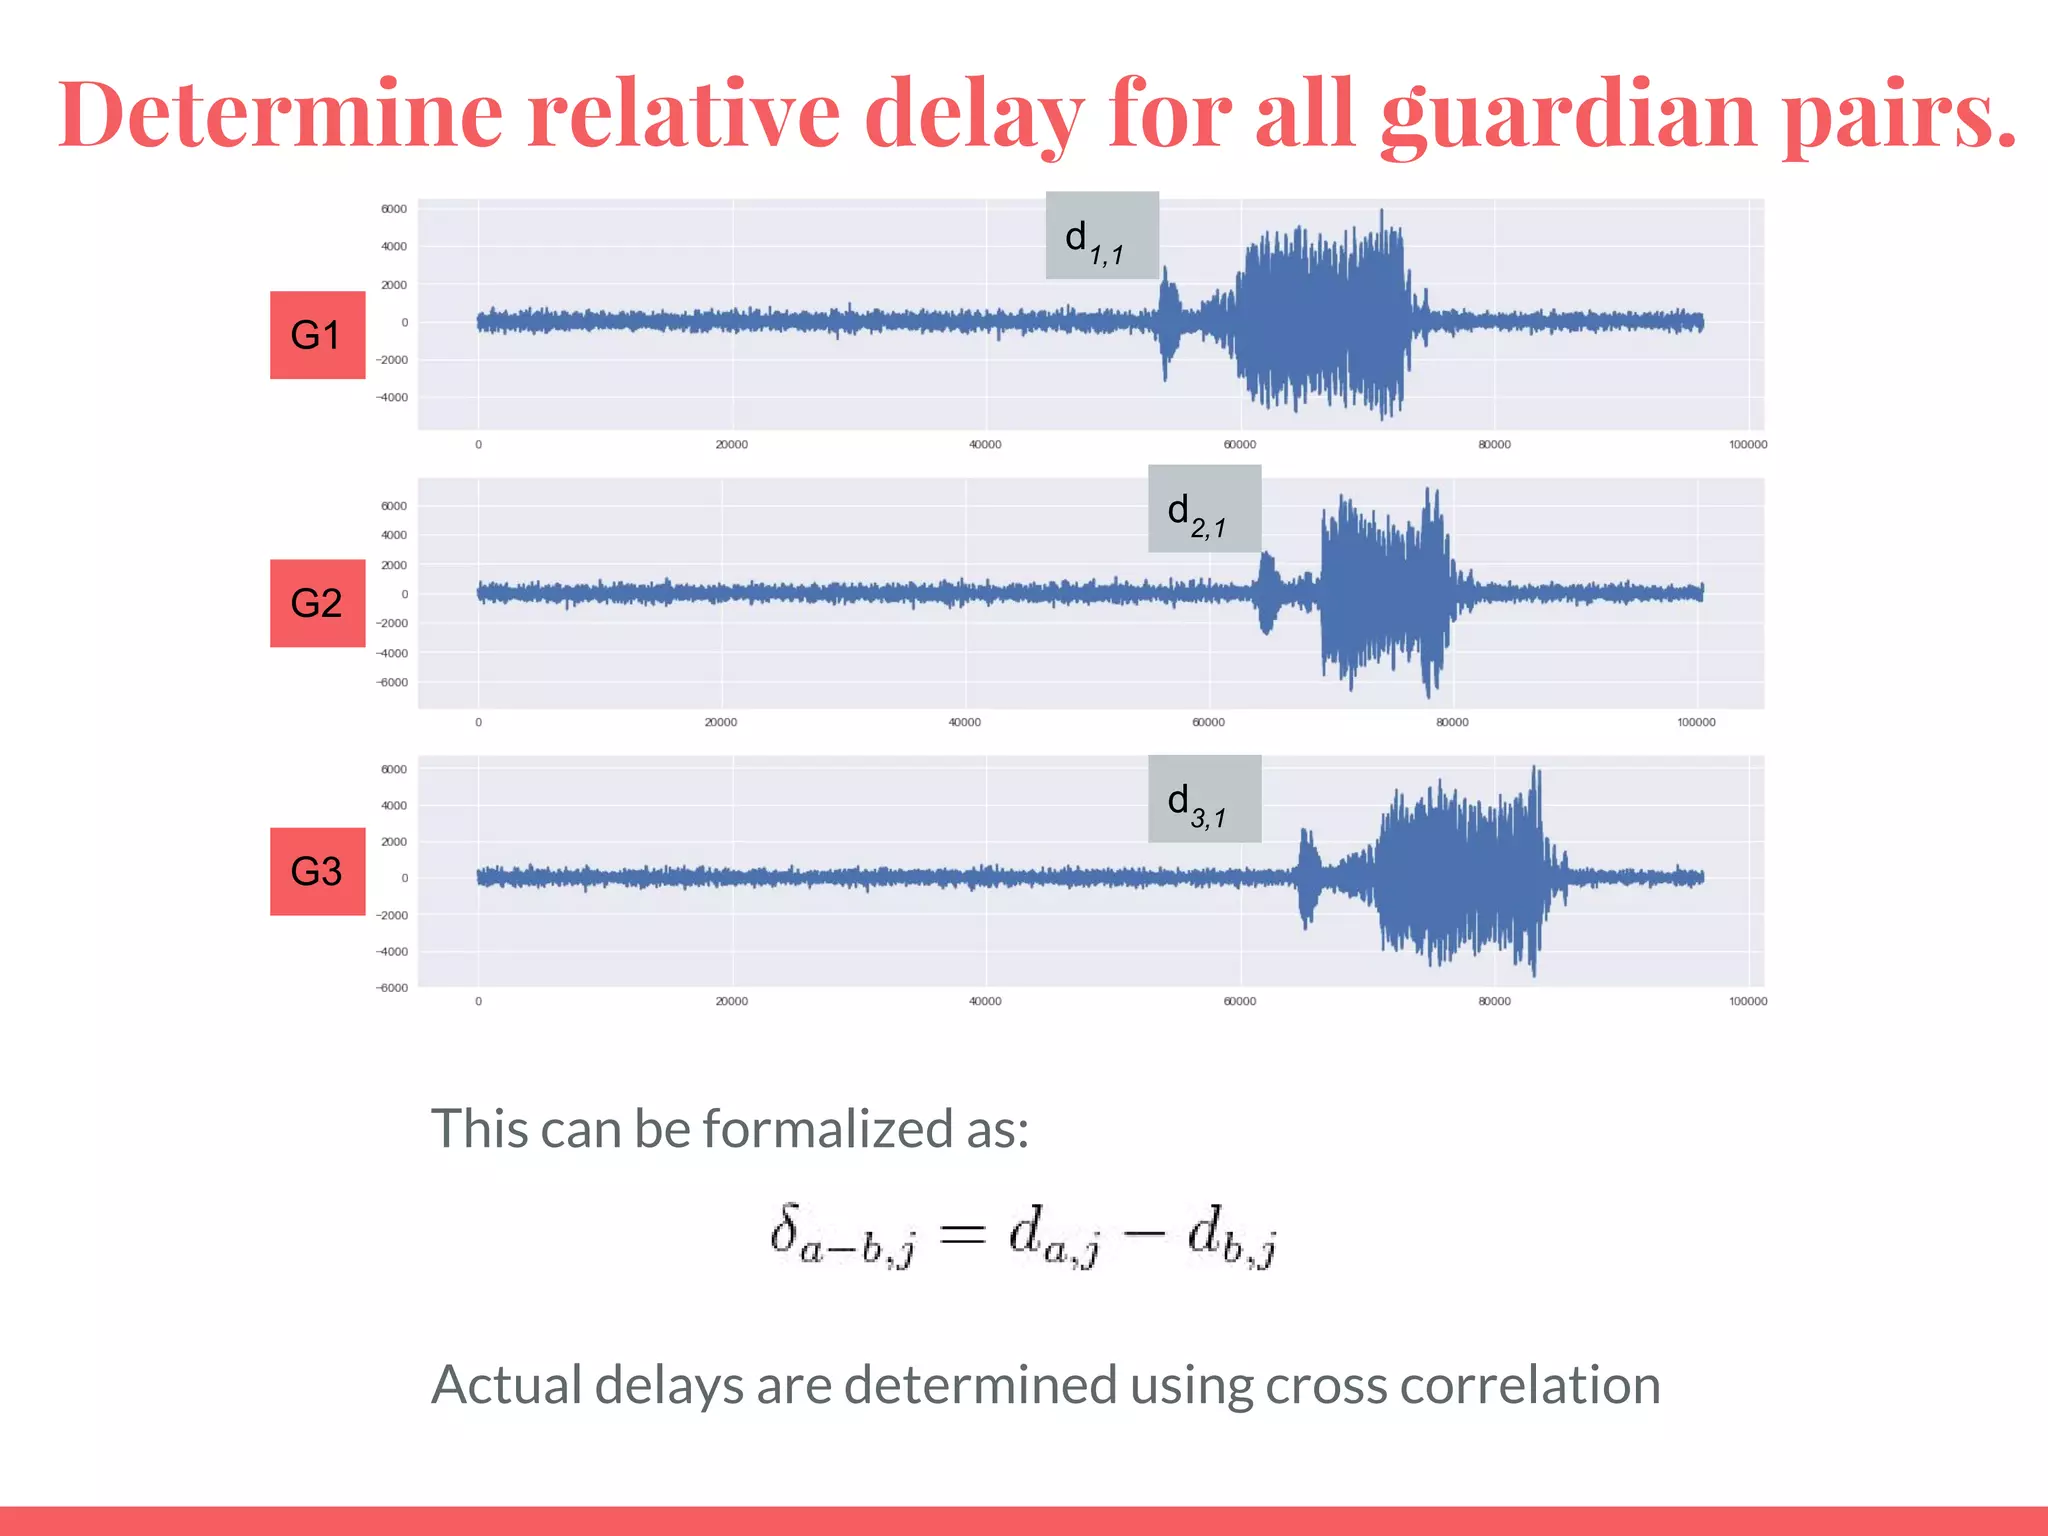
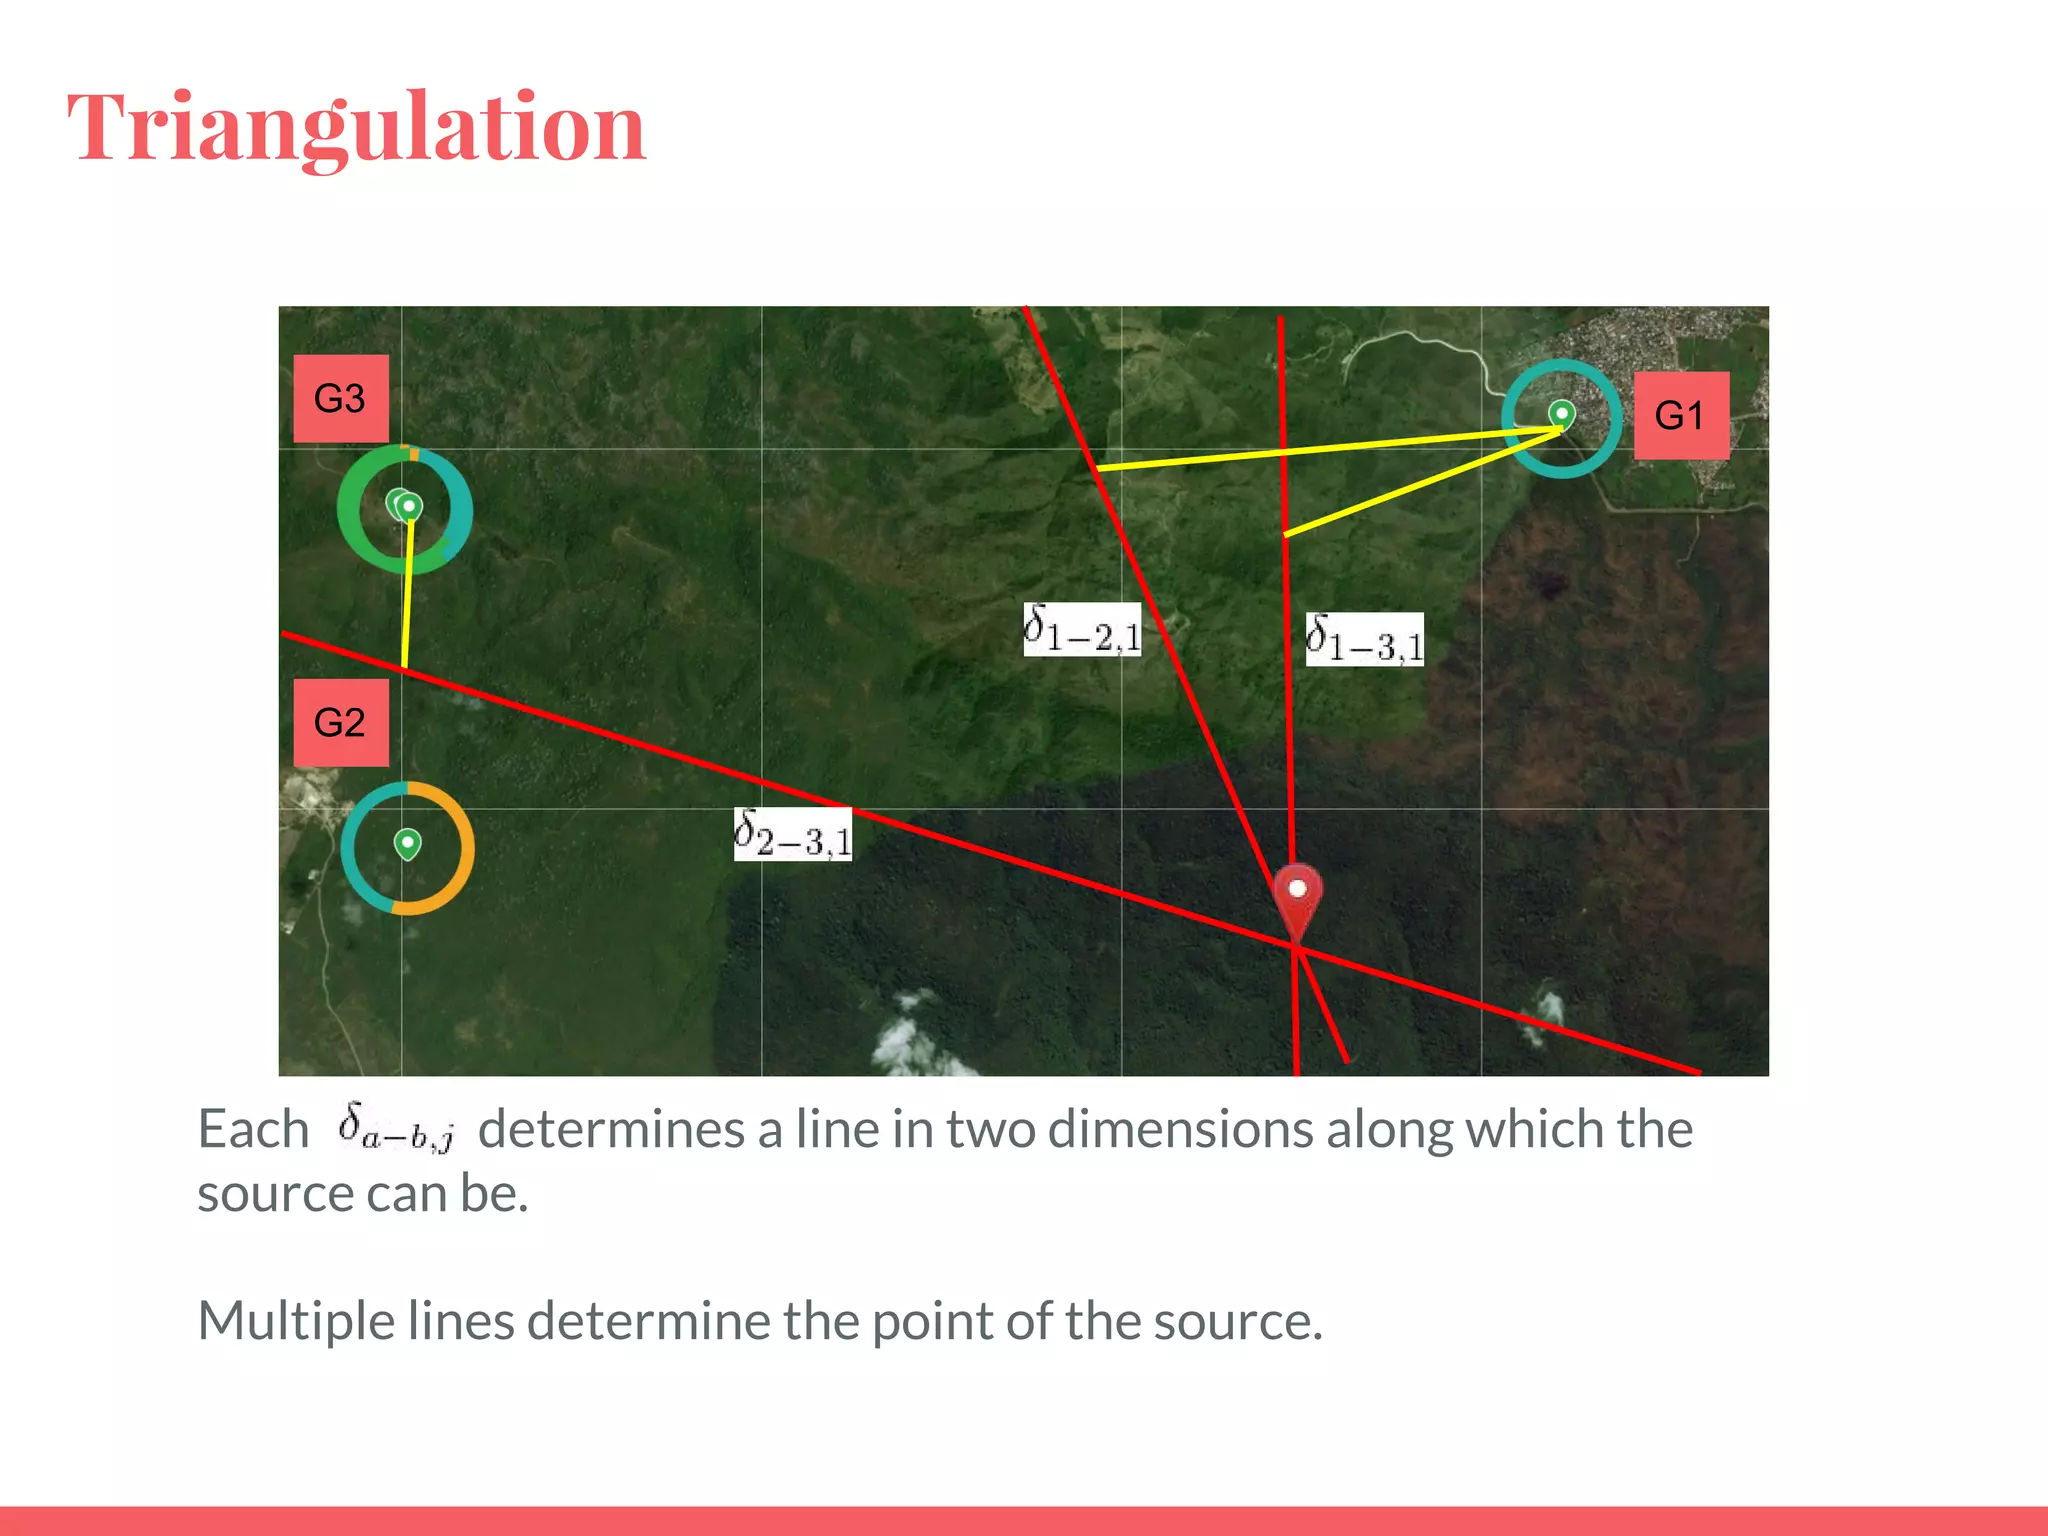

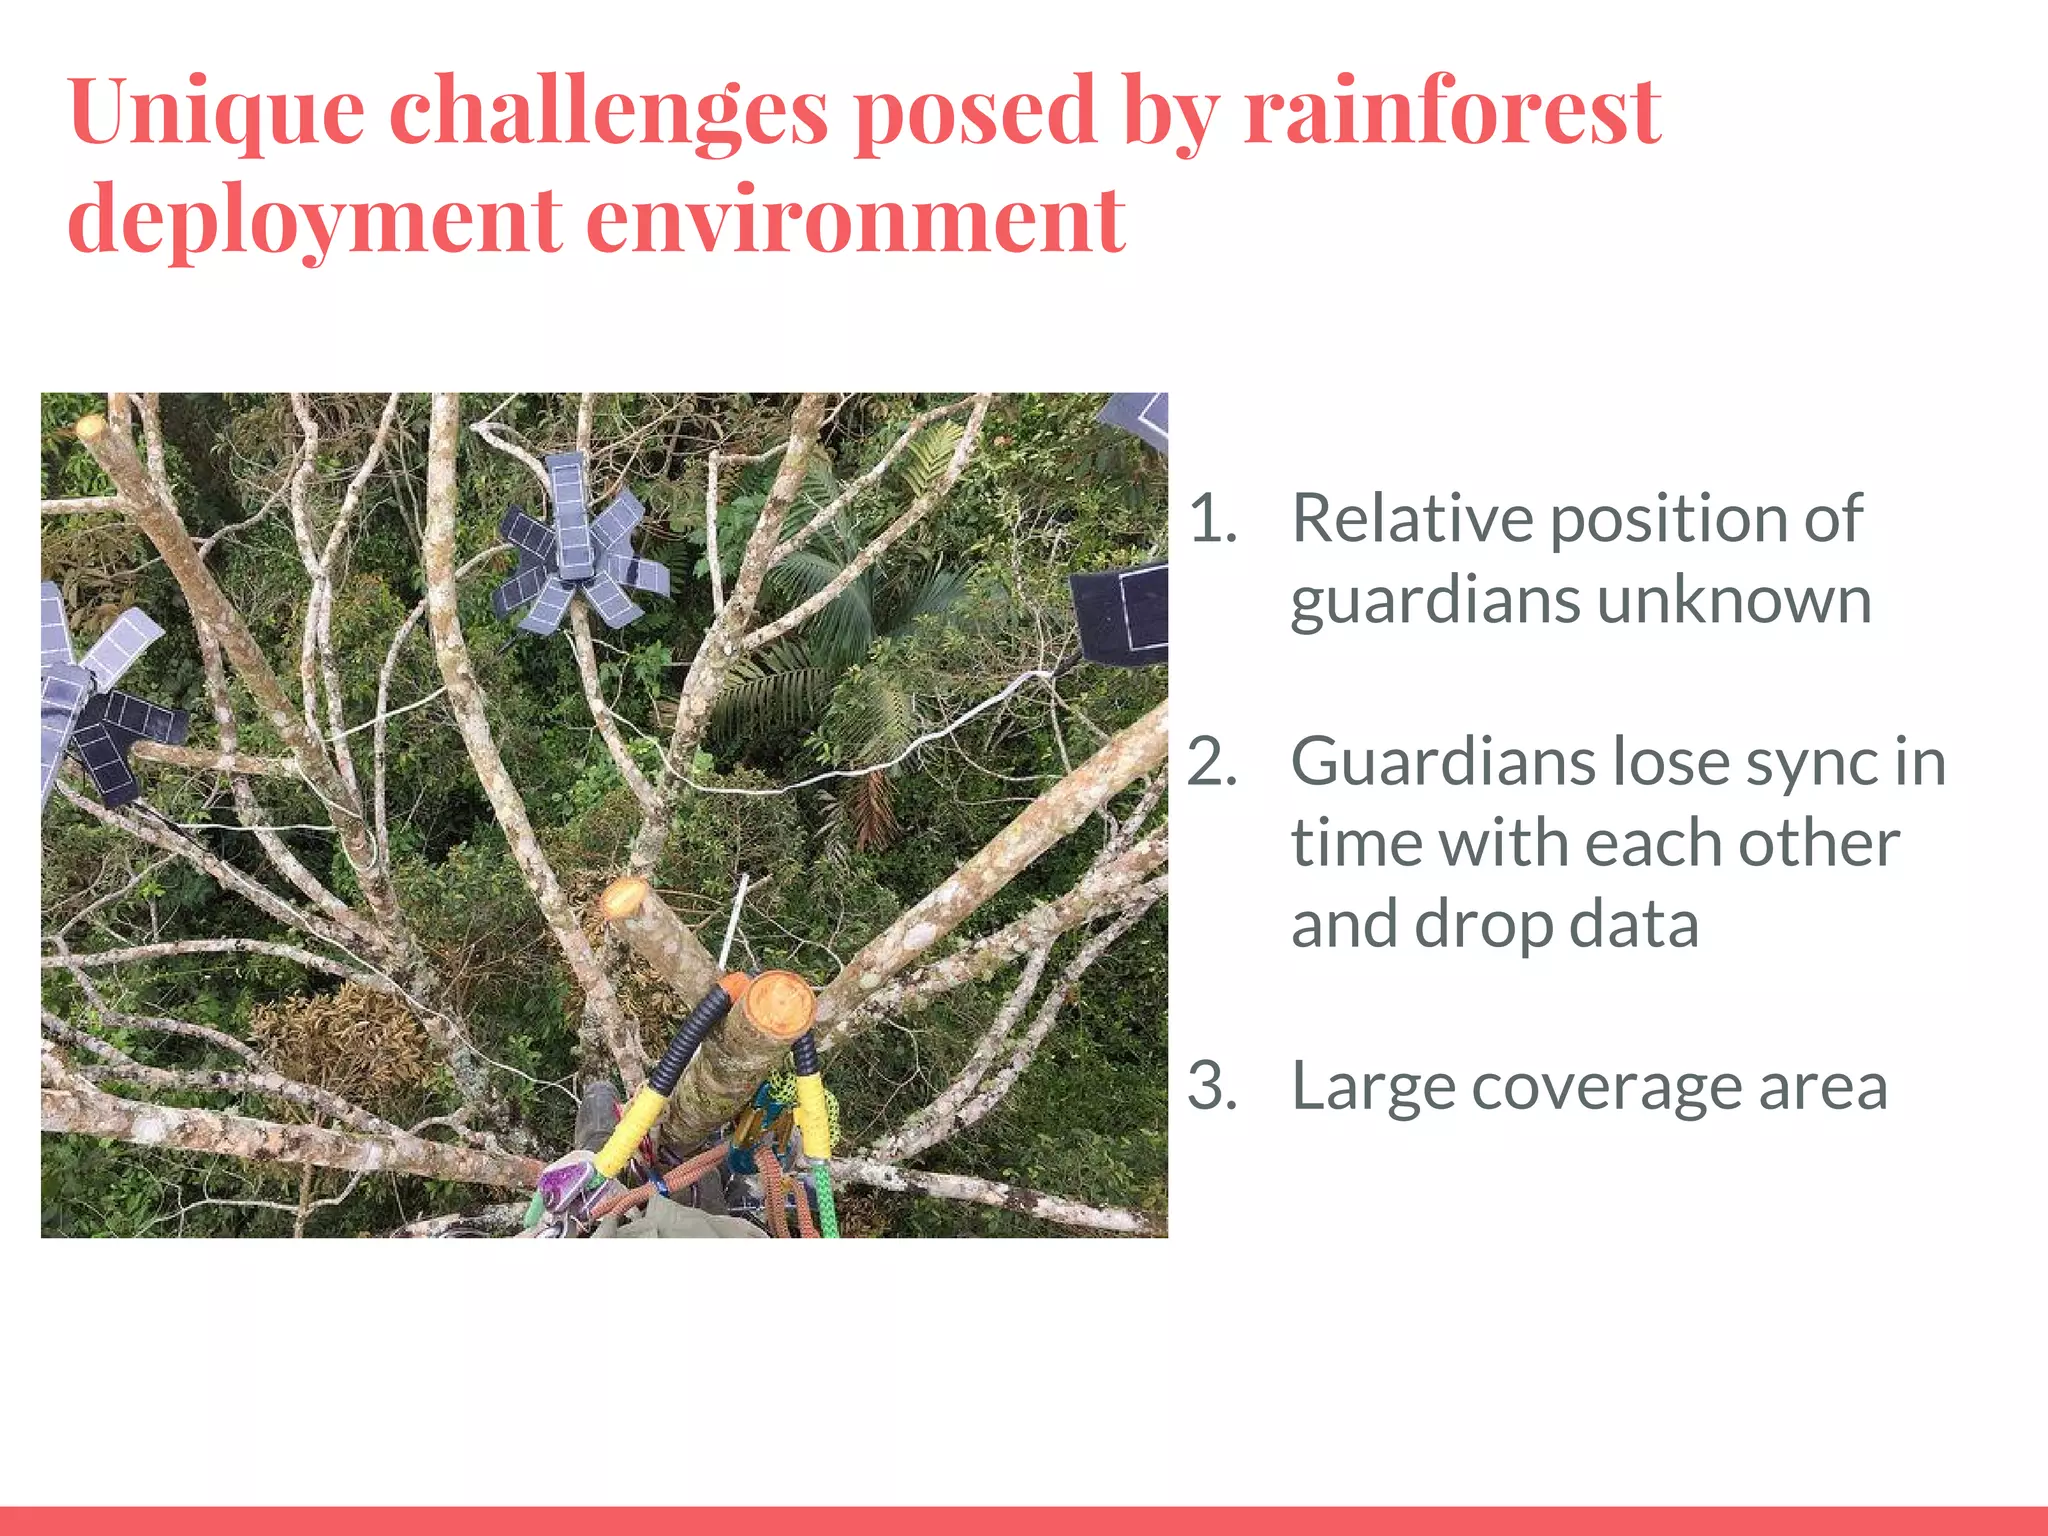
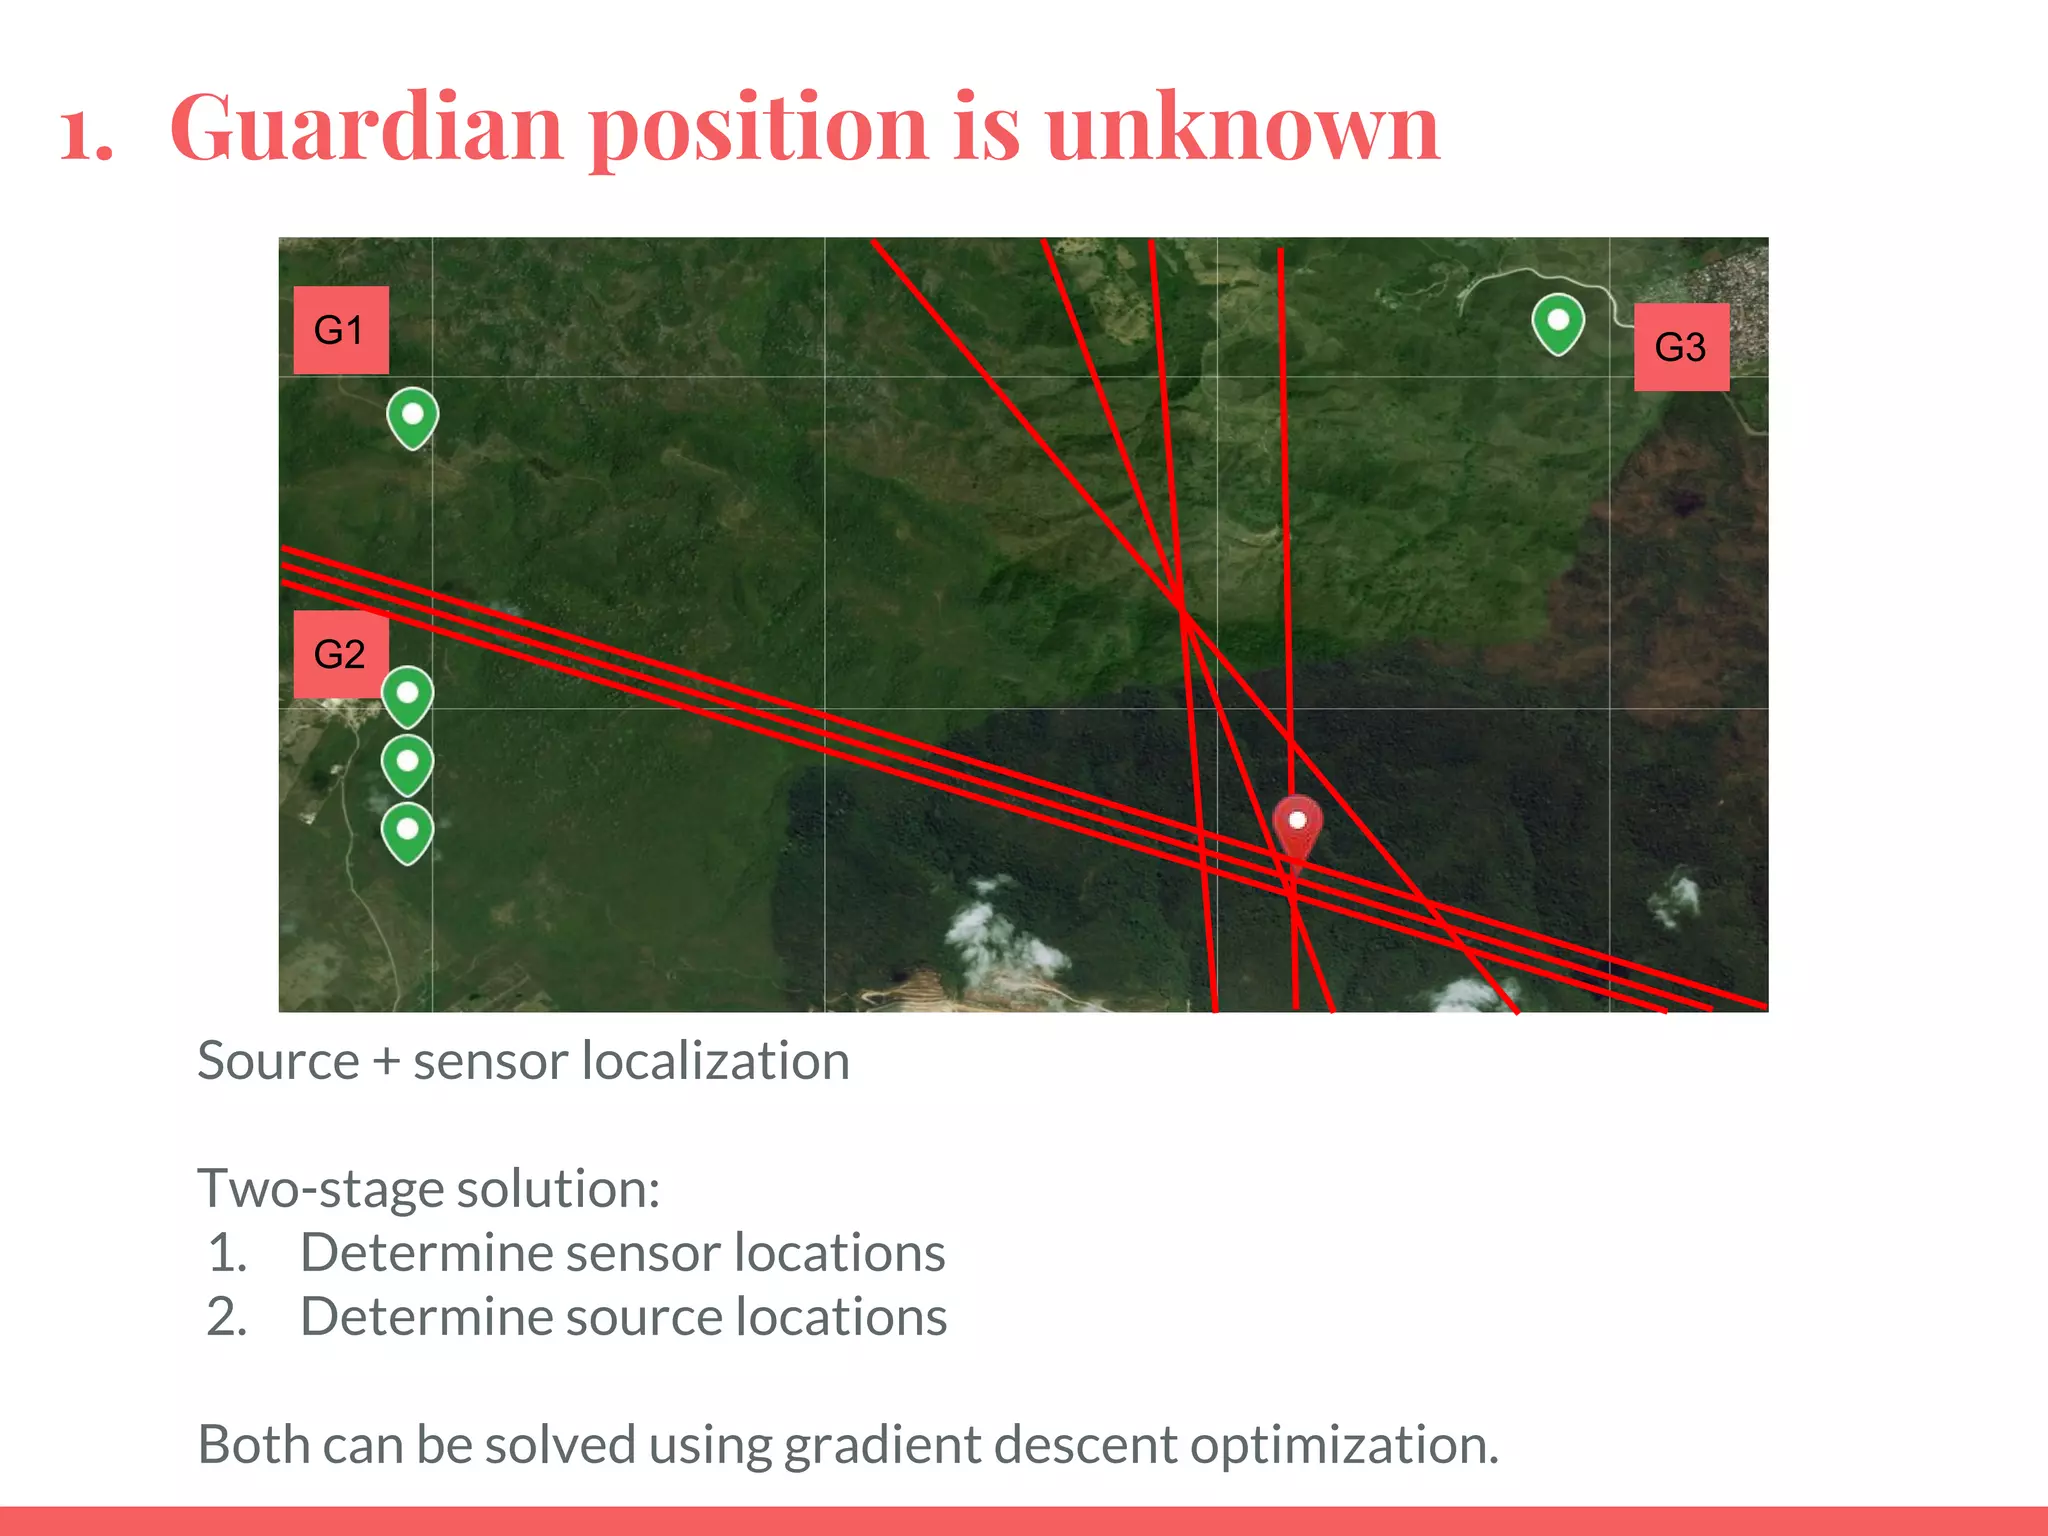
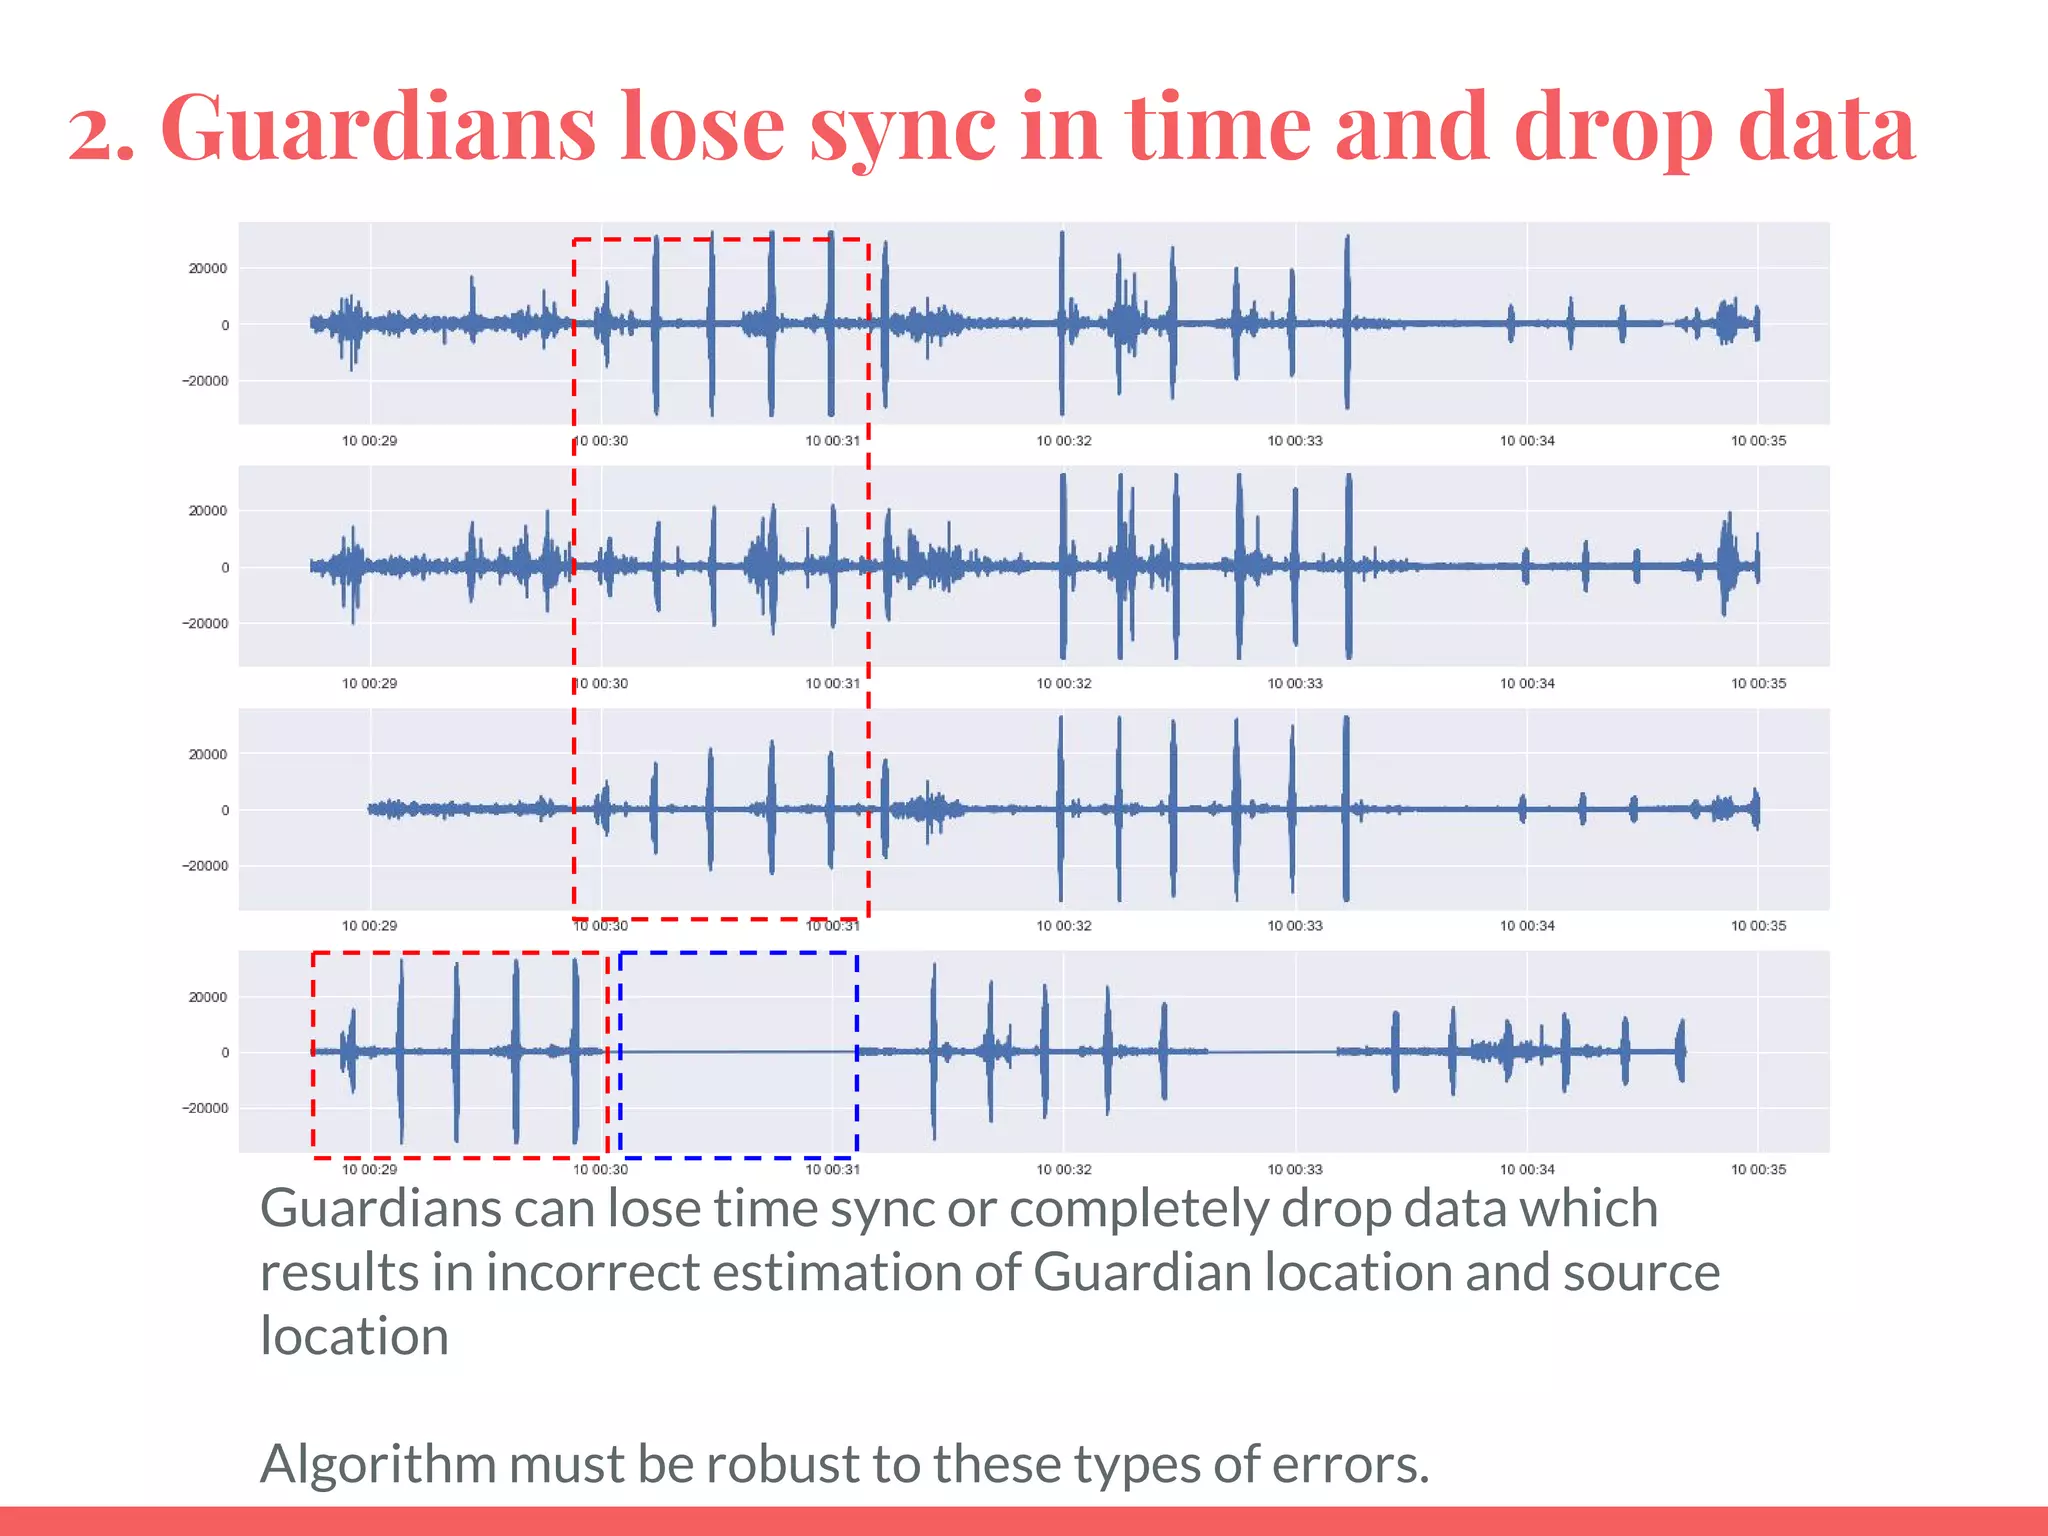
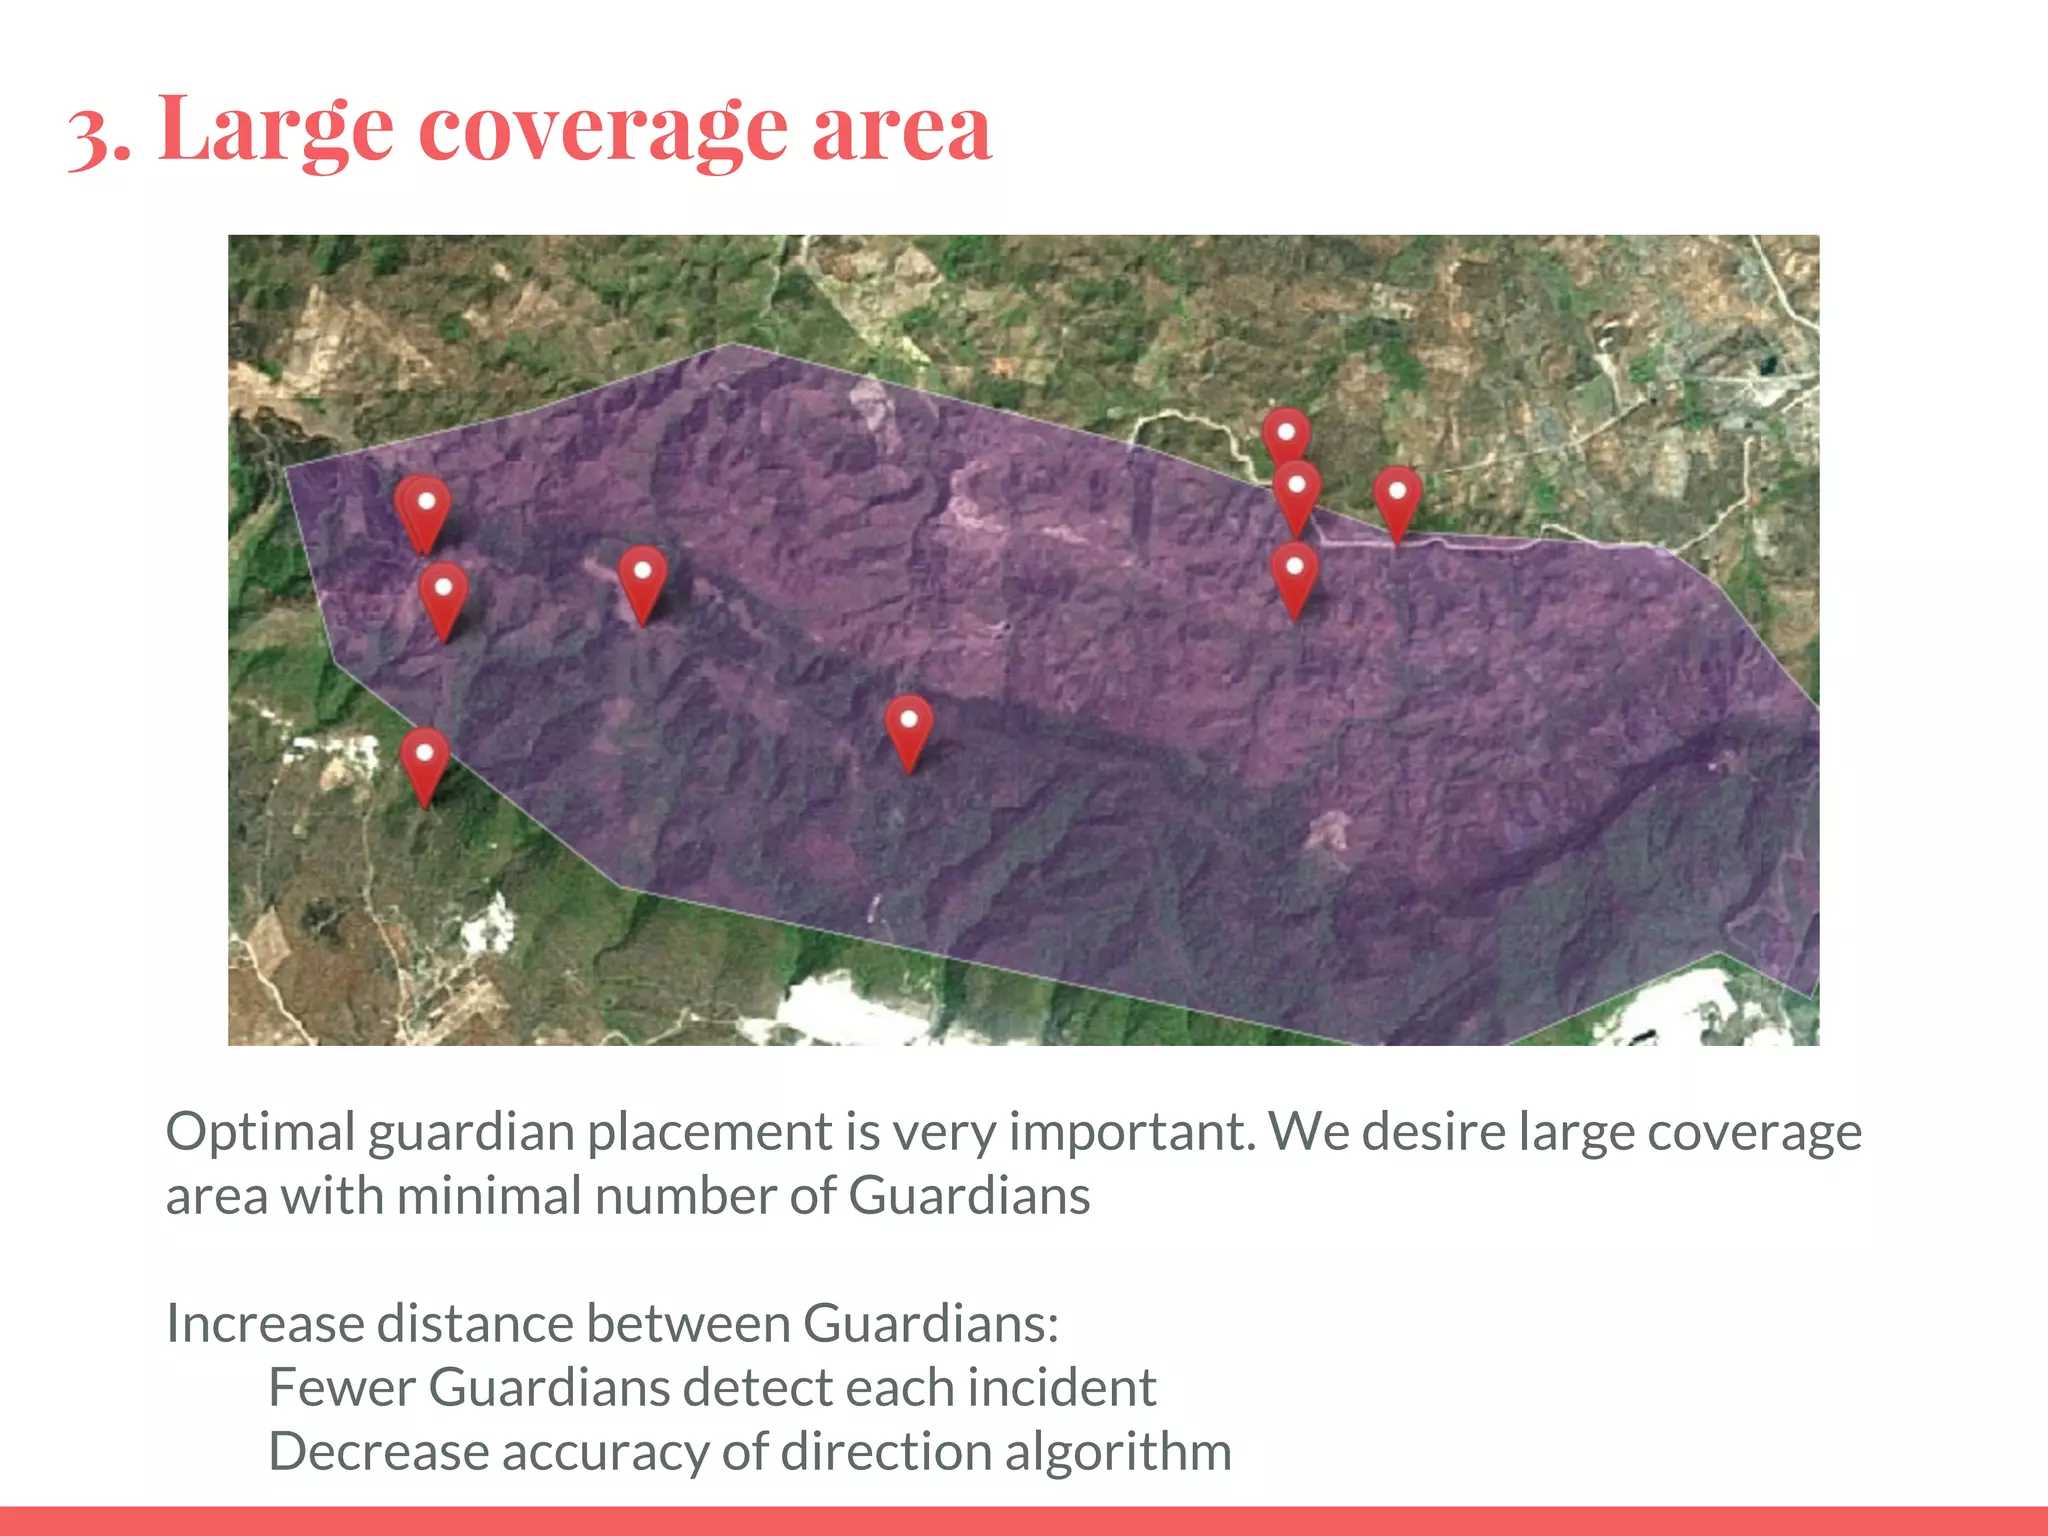
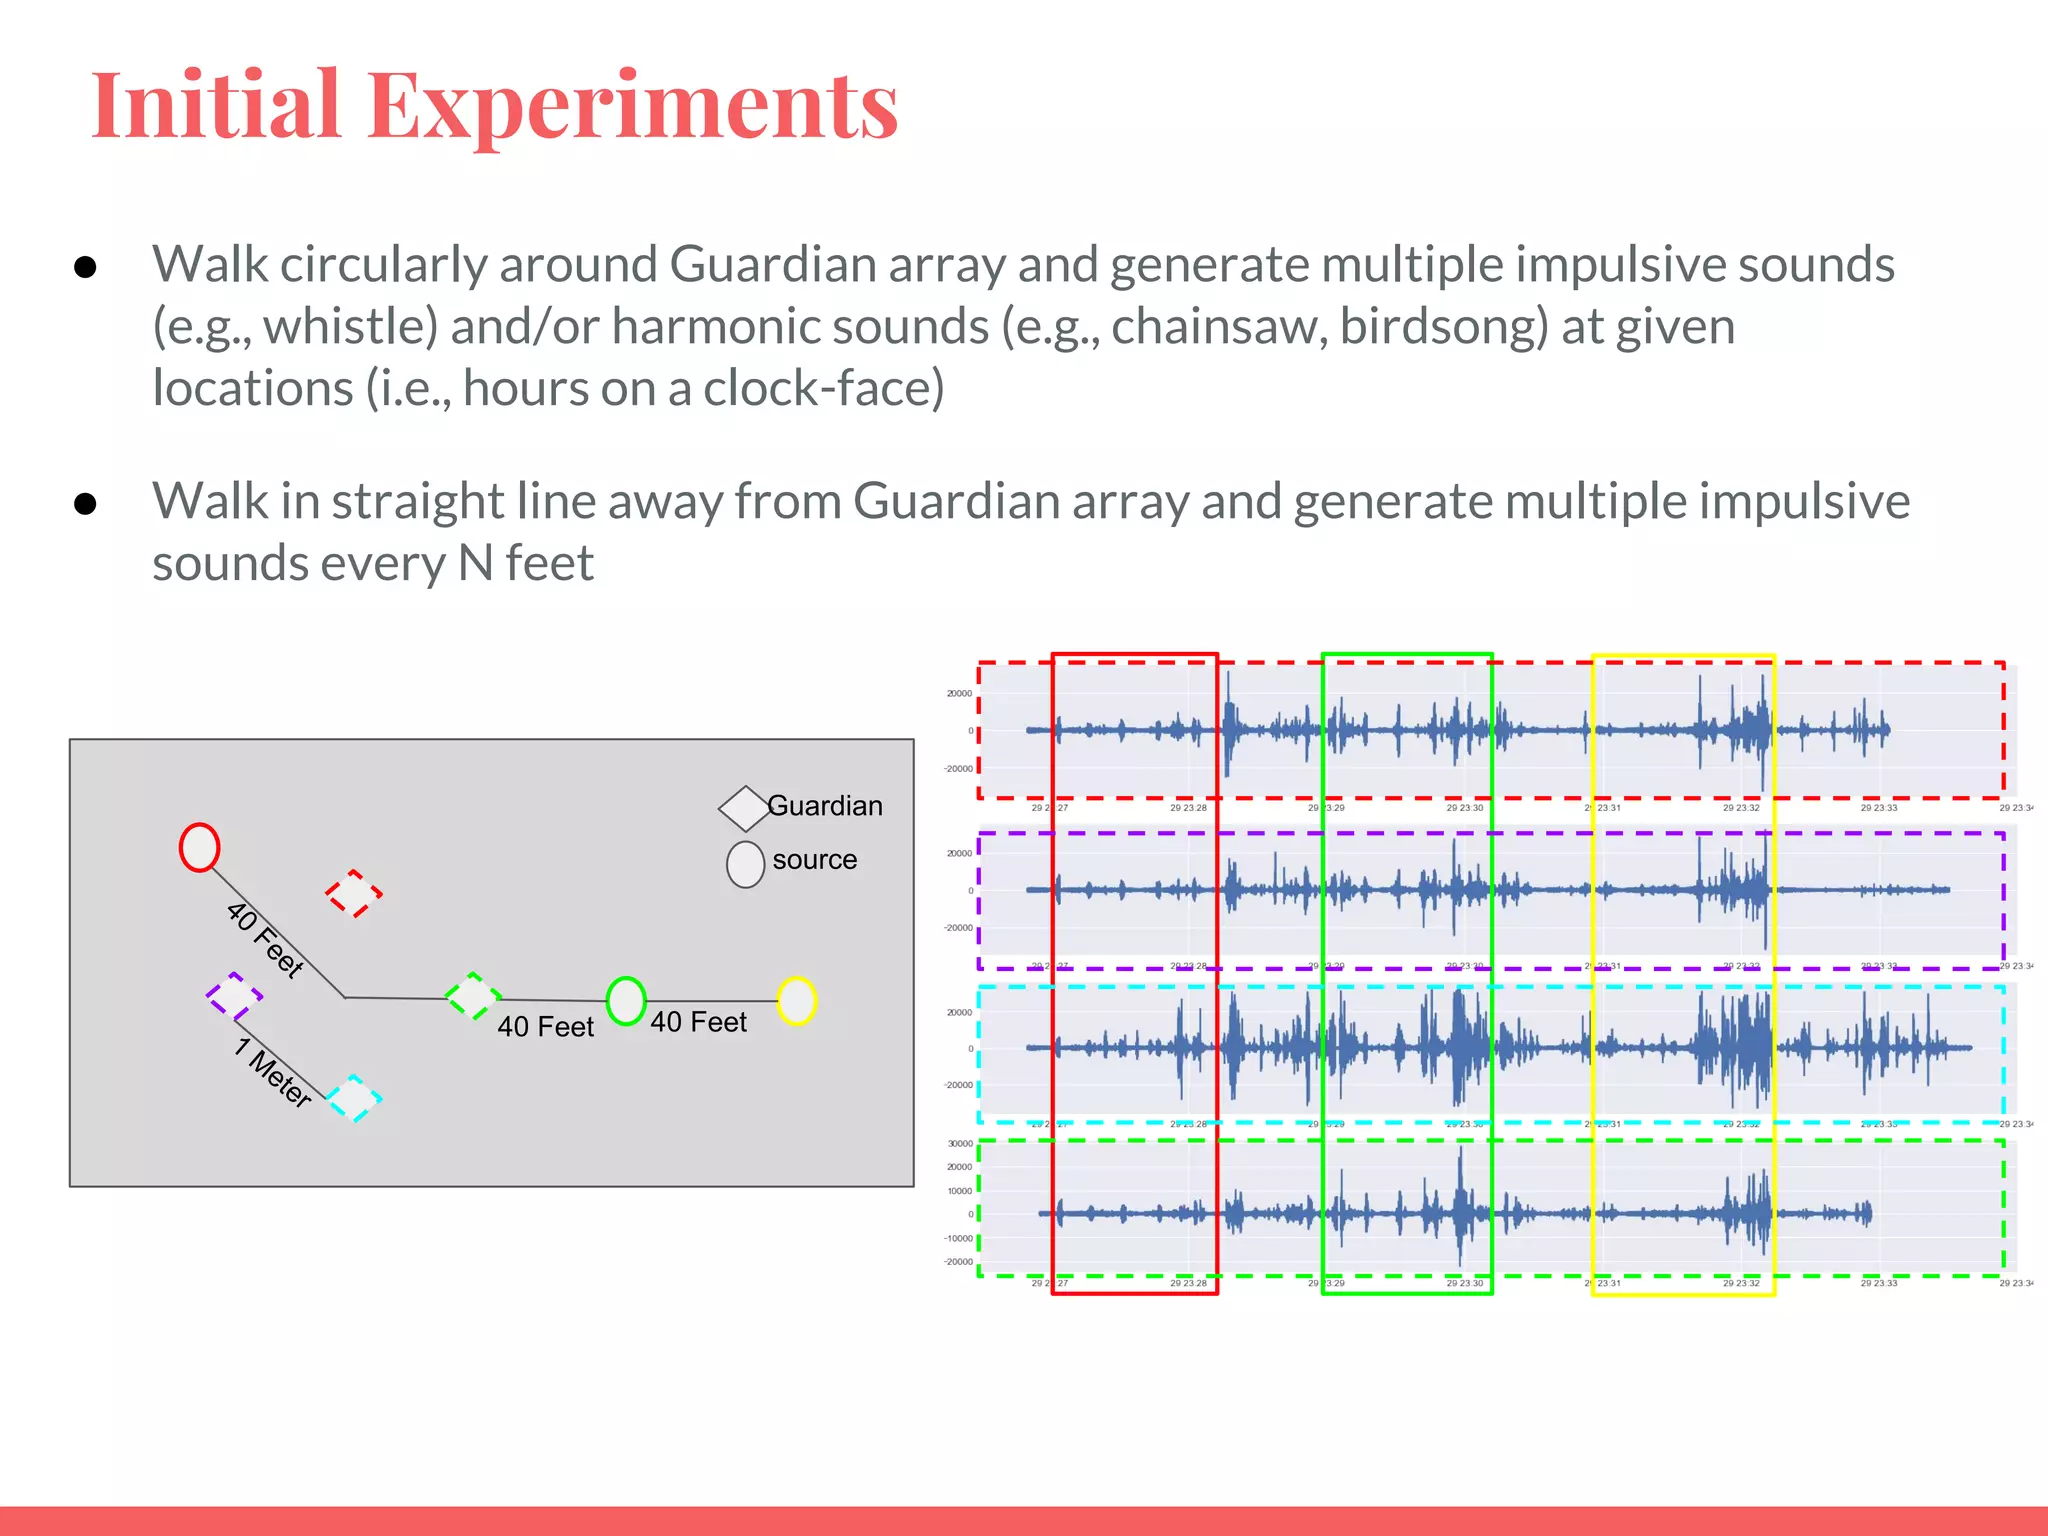
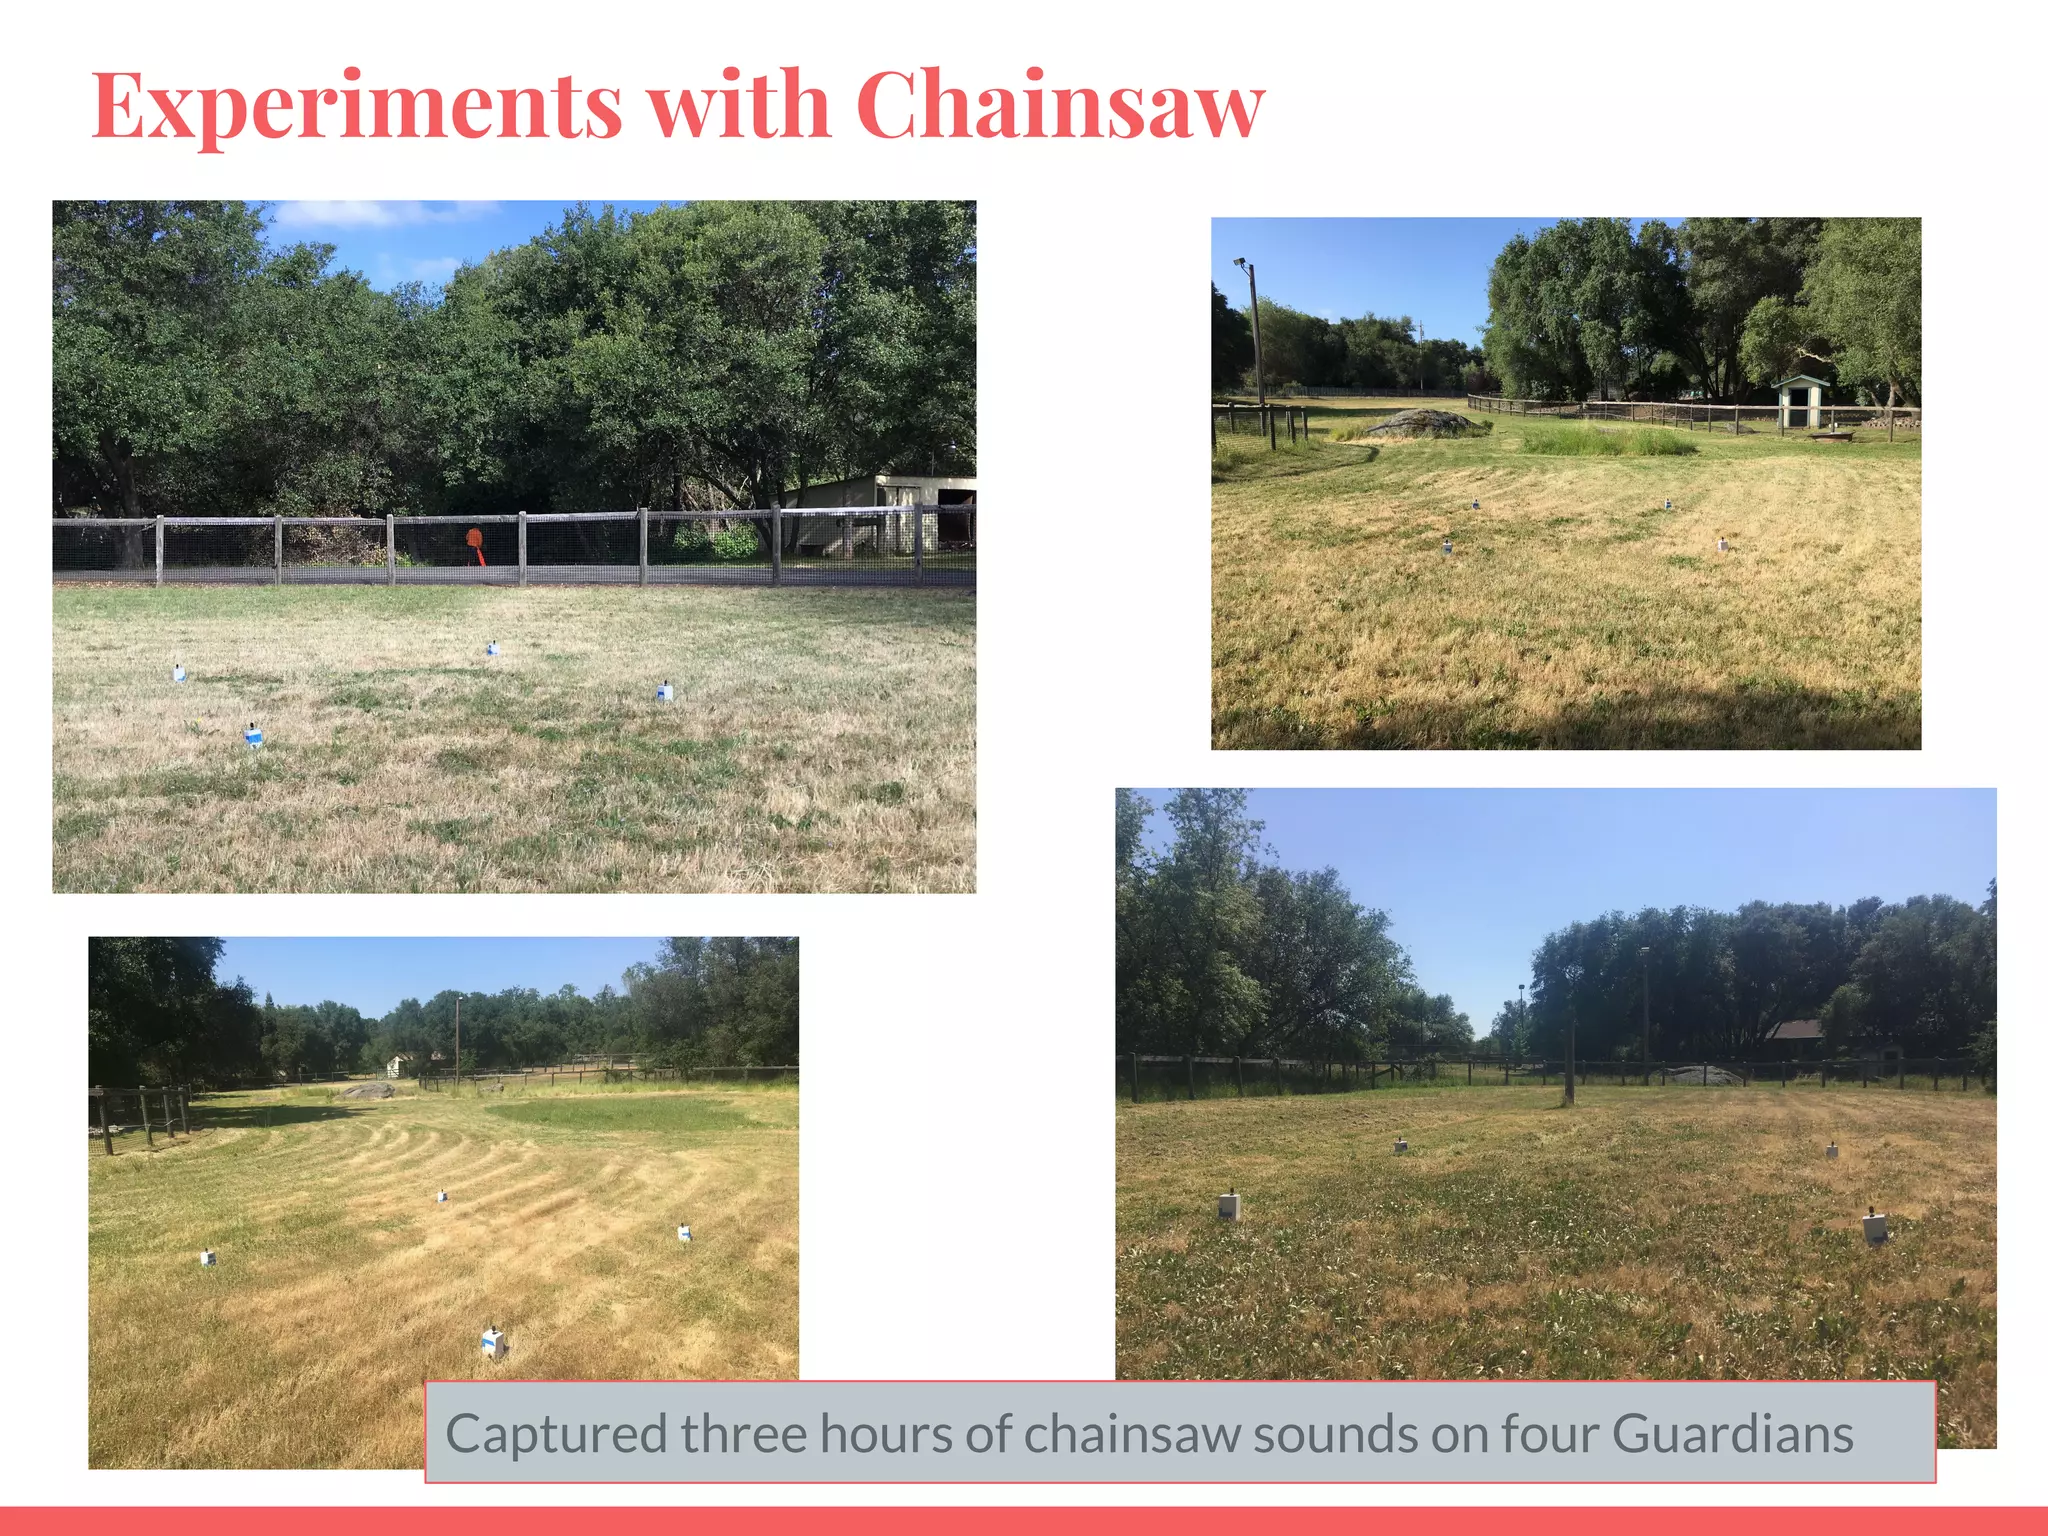
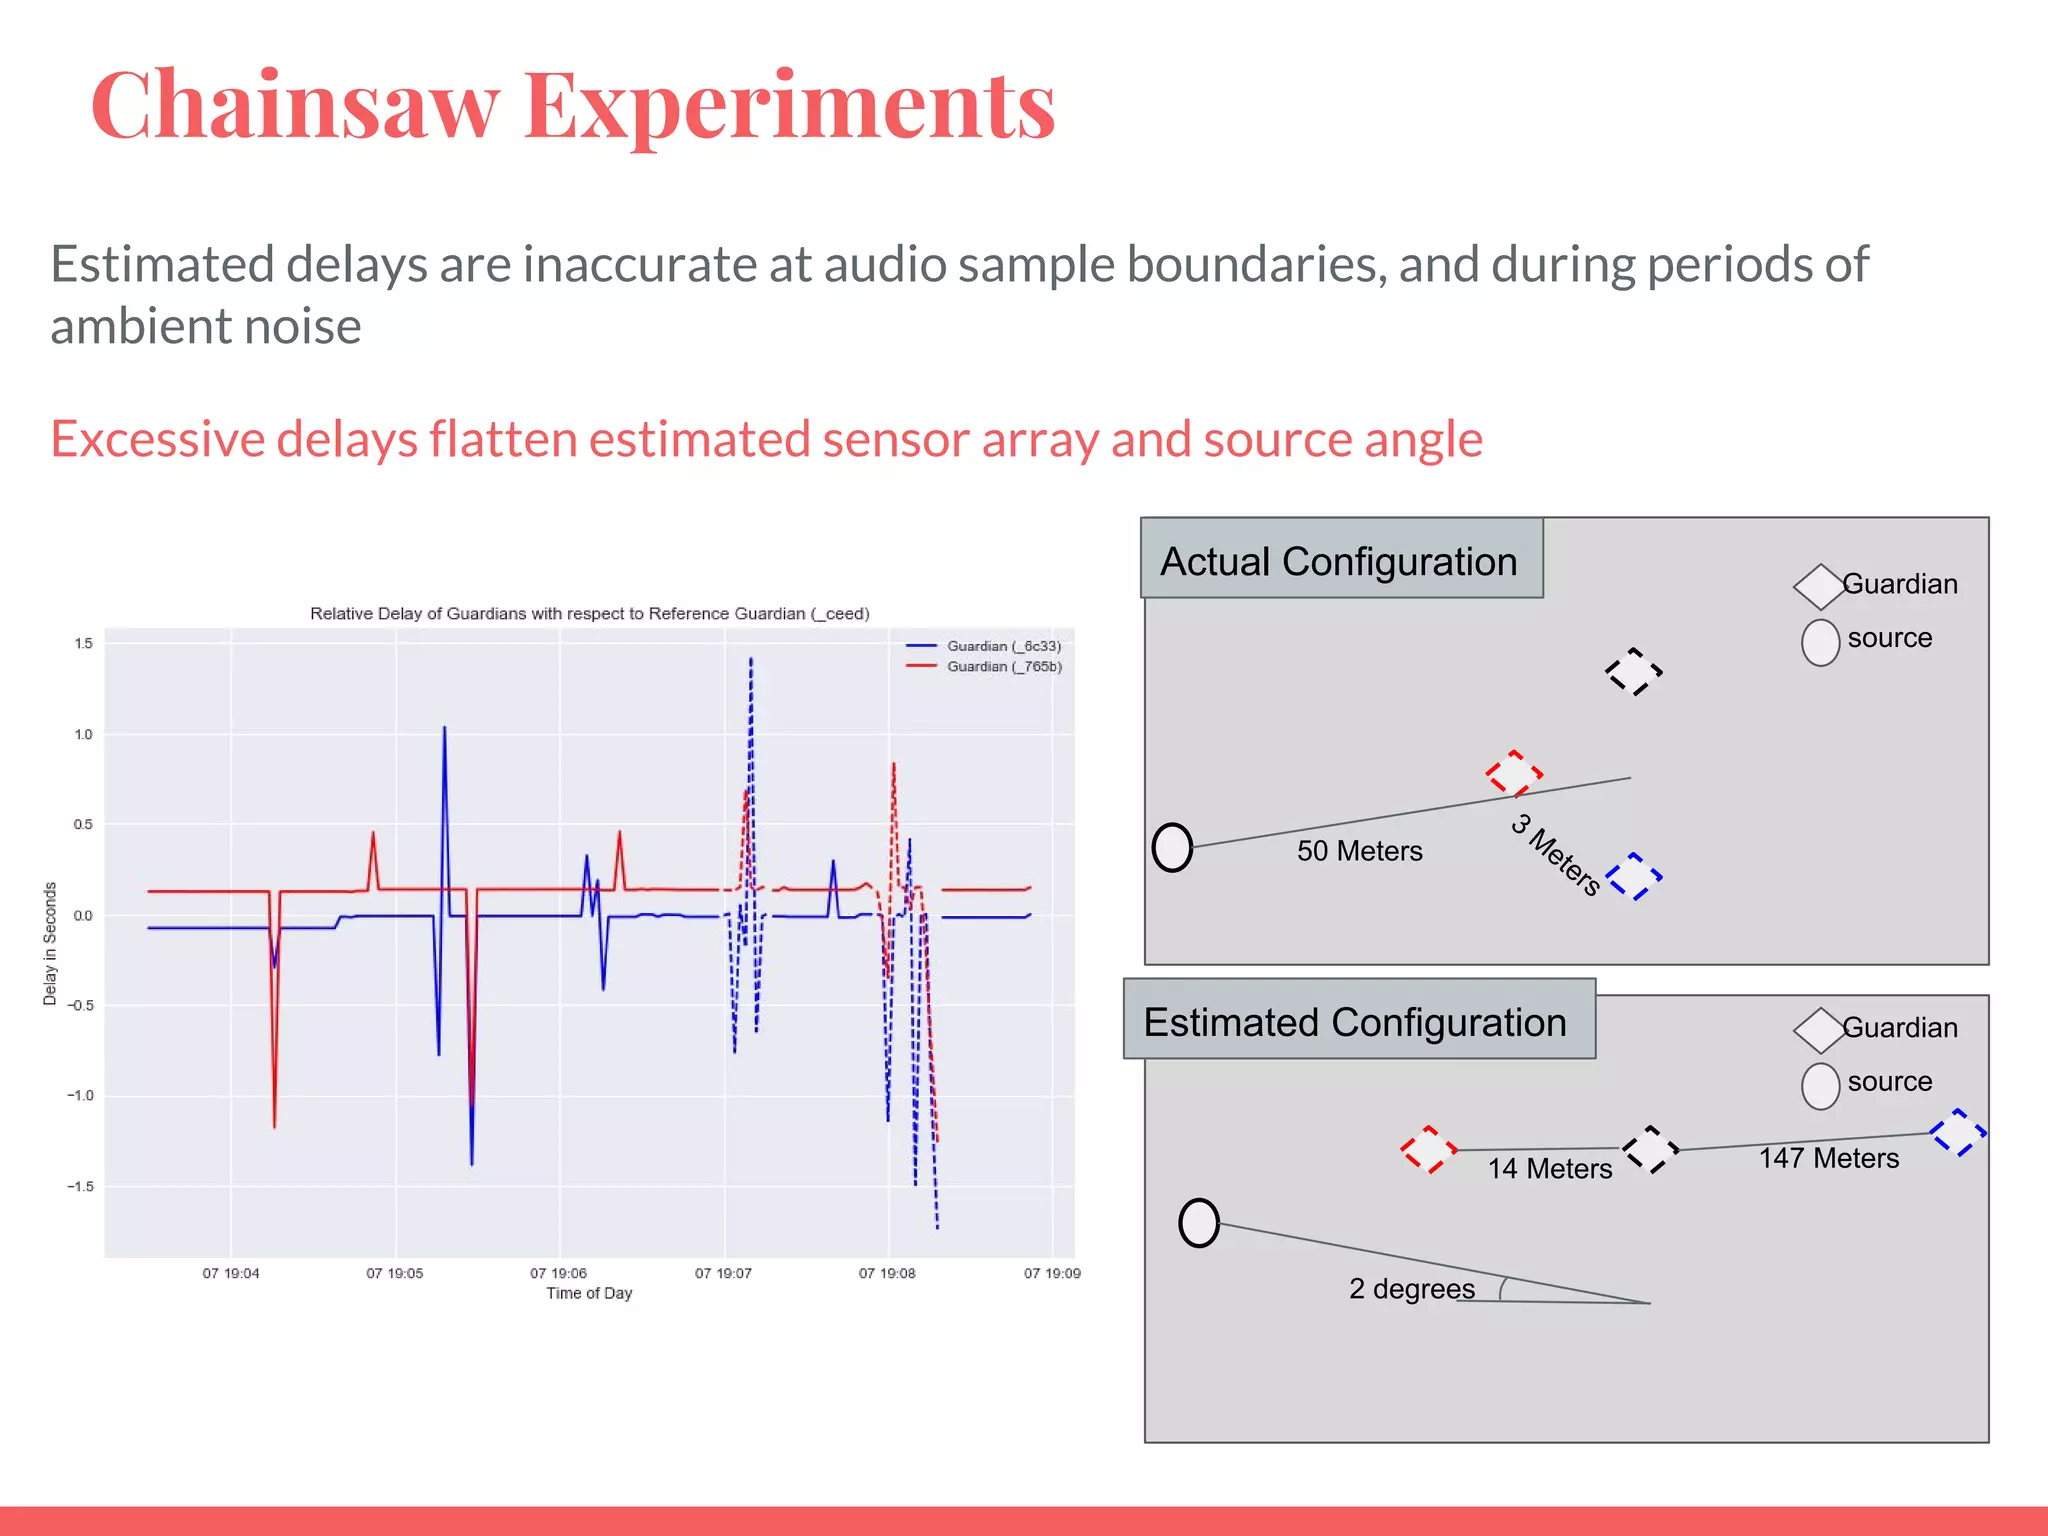

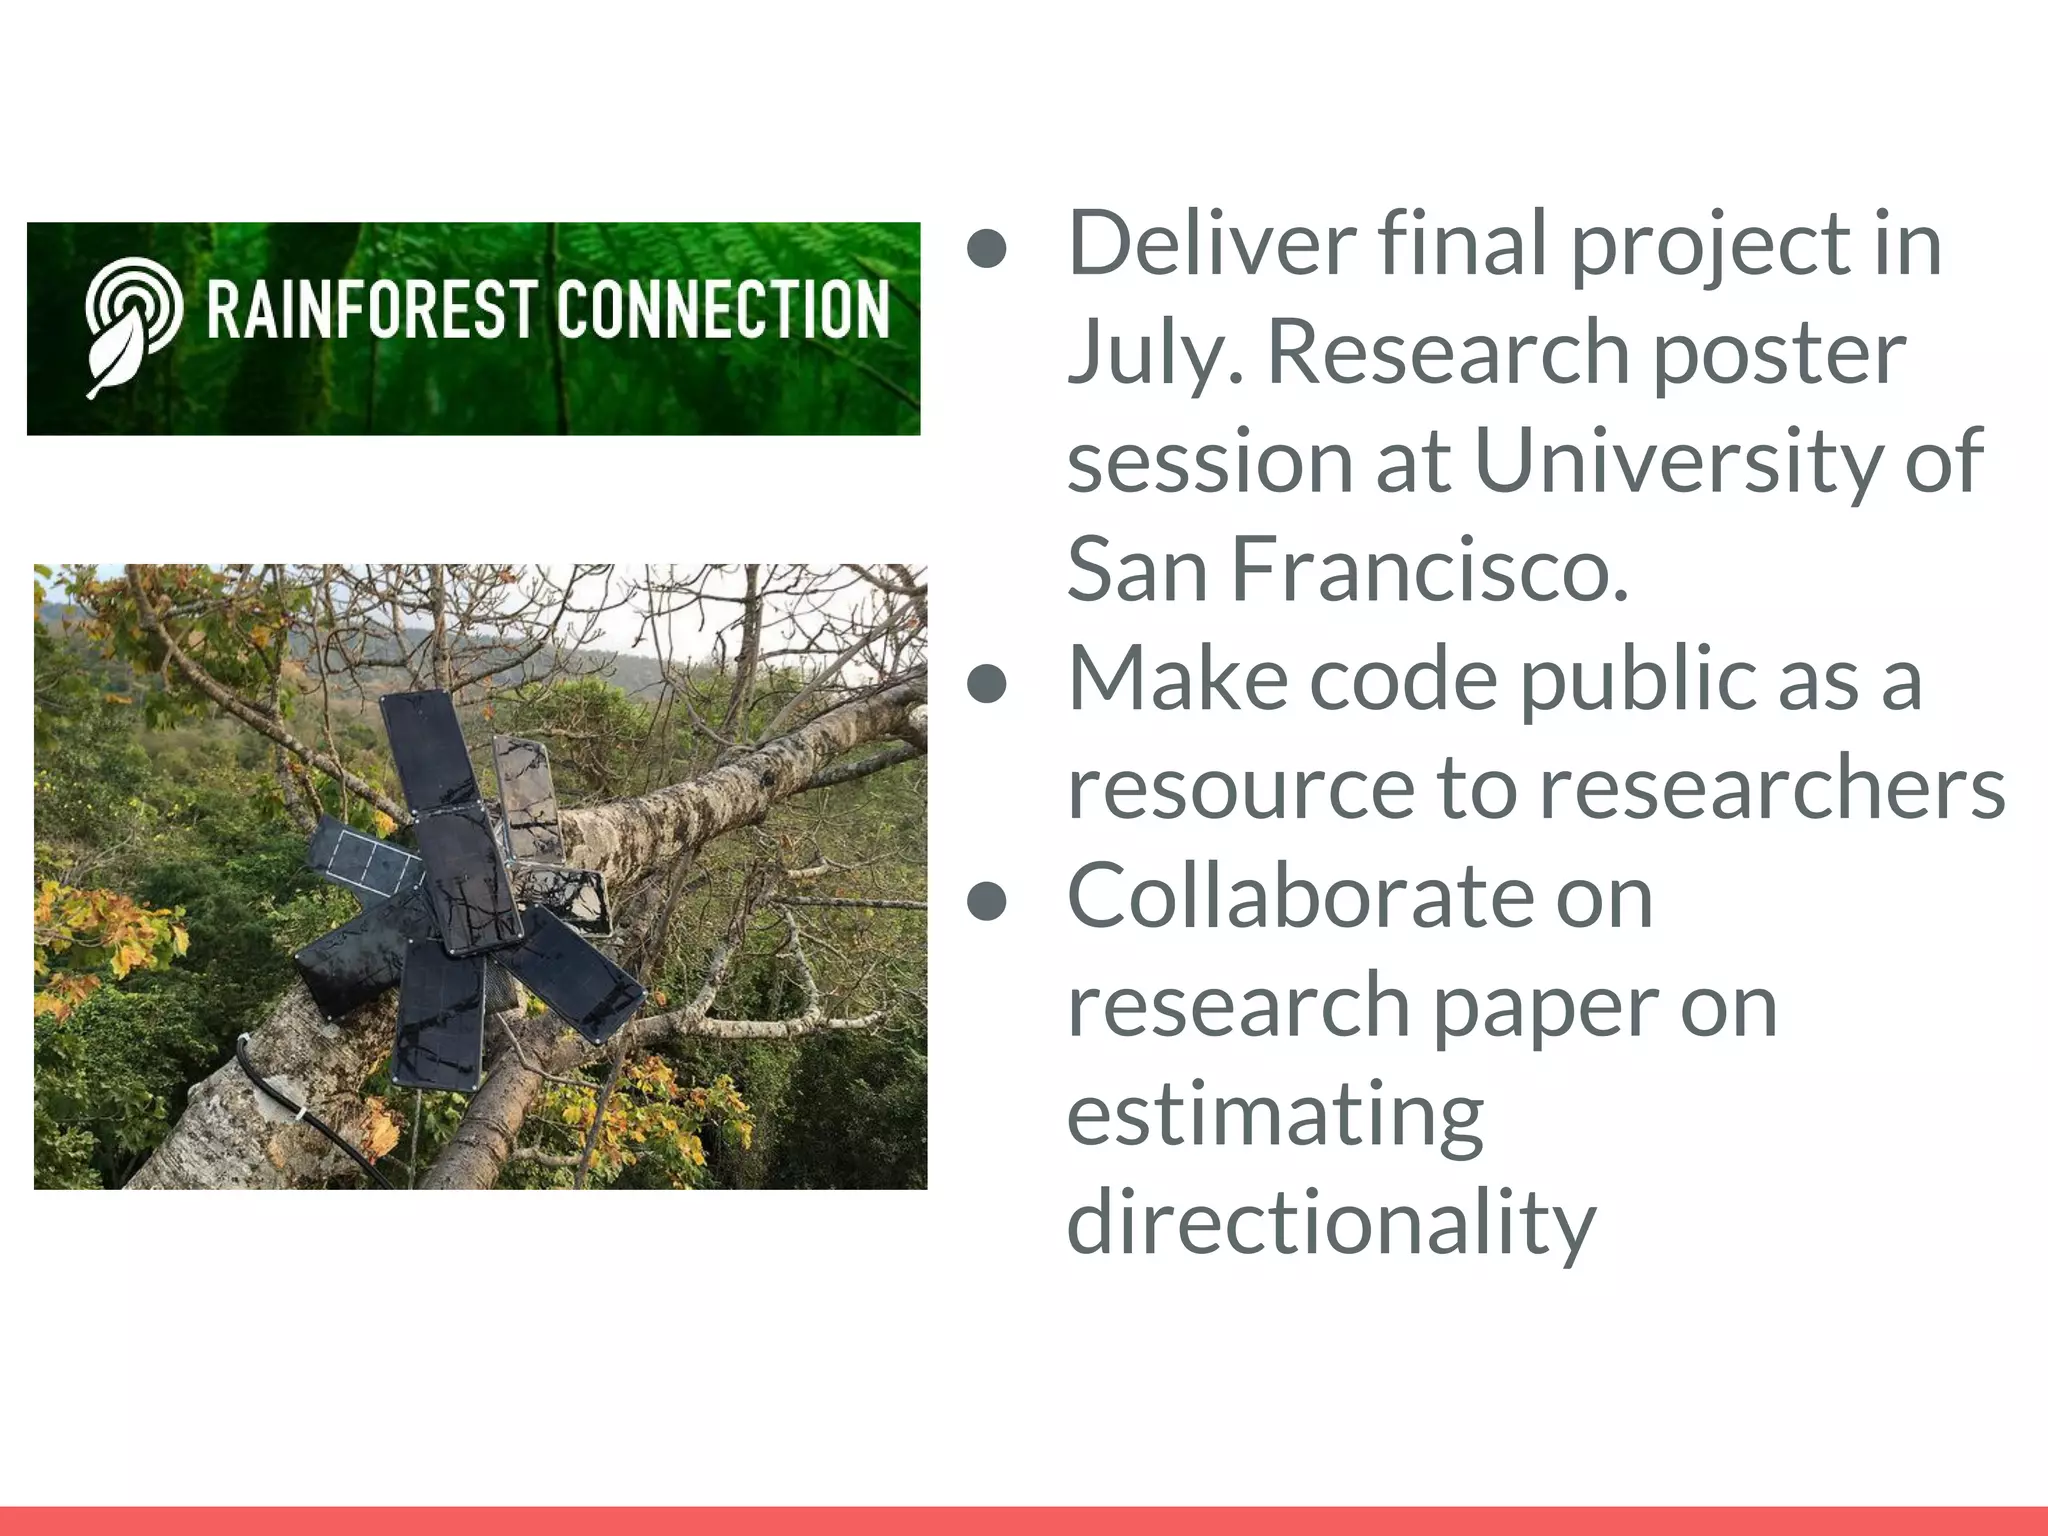


This document provides information about Delta Analytics, a non-profit organization that provides pro bono data consulting services to social sector organizations. It discusses Delta Analytics' work with Rainforest Connection, including developing machine learning models to detect chainsaw sounds from audio data collected by recycled cell phones deployed in rainforests. Key points discussed include developing convolutional neural networks to classify audio spectrograms, addressing challenges like limited labelled training data and unknown guardian positions, and experiments to estimate the direction of detected sounds.