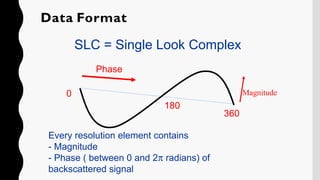
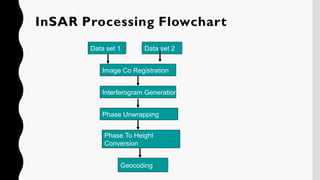
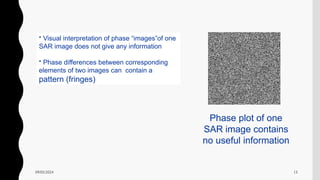
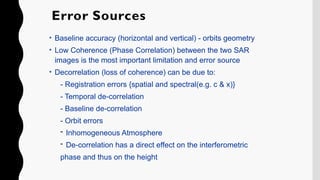
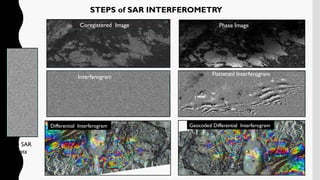
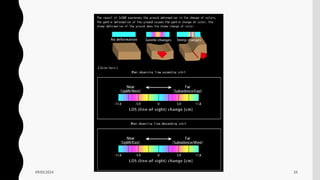
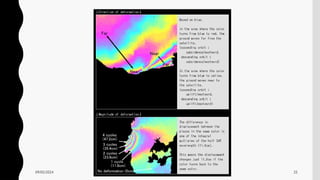
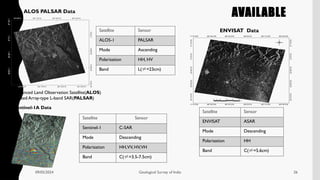
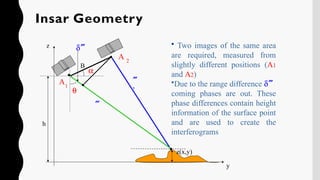
The document discusses Synthetic Aperture Radar (SAR) interferometry, detailing the processes involved in creating interferograms, phase unwrapping, and height conversion using phase differences from two SAR images. It outlines error sources like baseline accuracy and coherence levels that impact measurement accuracy. Additionally, it highlights applications of SAR data in geological surveys and monitoring deformation and other changes in the landscape.
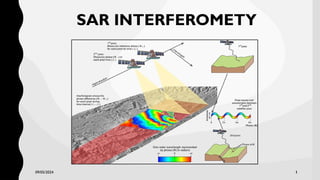
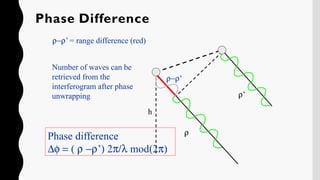
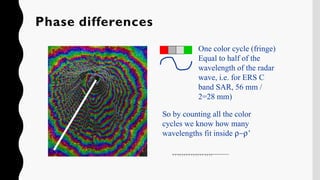
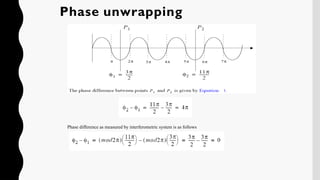
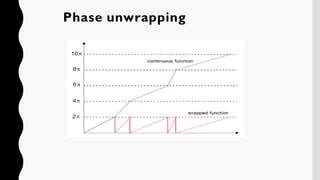
![[Number of waves]
r-r’ [Meters]
l
Phase Difference](https://image.slidesharecdn.com/mwrs-sarinterferometry-240905052116-15514c64/85/SAR-Interferometry-Fundamental-and-applications-8-320.jpg)