Download as PDF, PPTX


![[t] +31 (0)15 820 0225
[e] info@skygeo.com
[w] www.skygeo.com
Contact us](https://image.slidesharecdn.com/dsd-int2015-workshopprocessingwithsentineltoolbox-josmaccabianiskygeo-151110074050-lva1-app6891/85/DSD-INT-2015-Workshop-processing-with-sentinel-toolbox-Jos-Maccabiani-Sky-Geo-50-320.jpg)

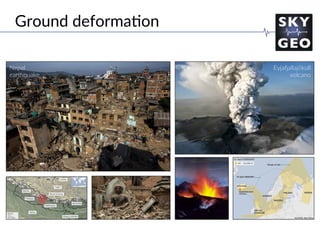
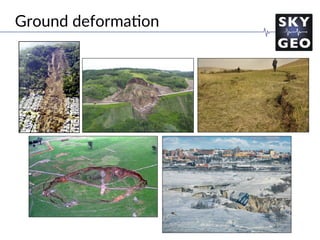
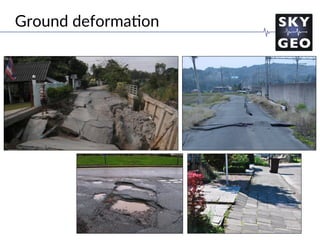
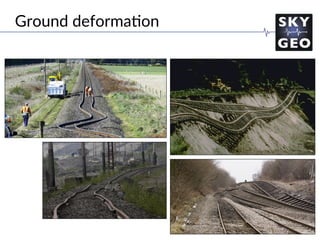
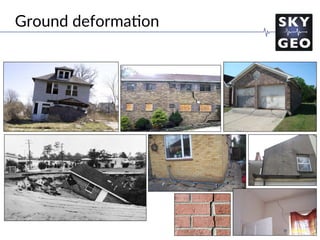
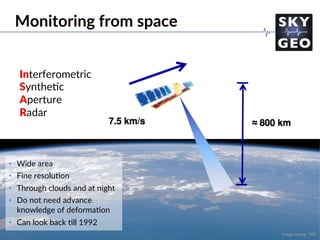
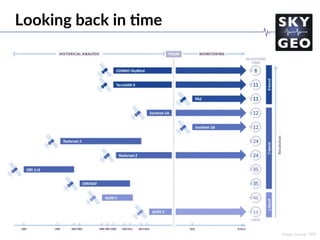
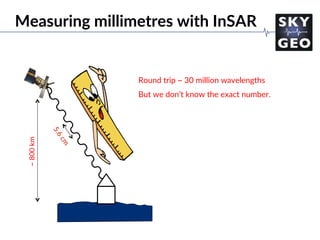
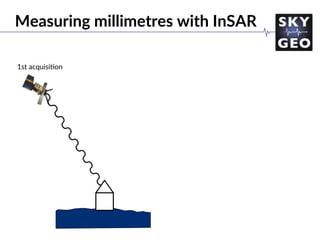
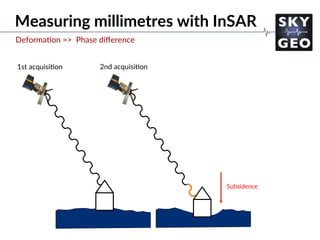
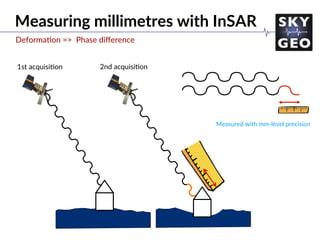
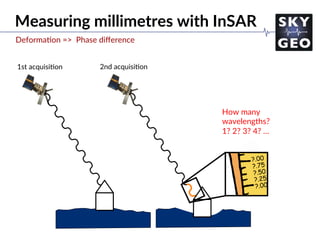
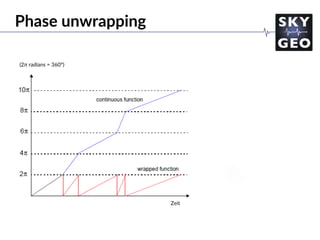
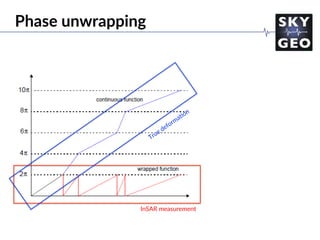
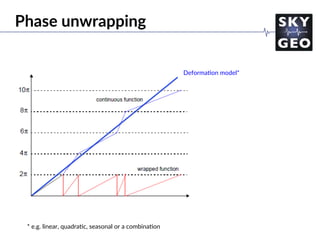
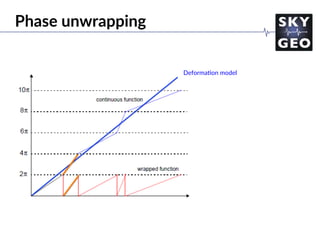
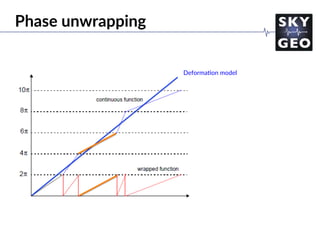
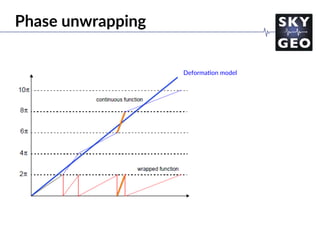
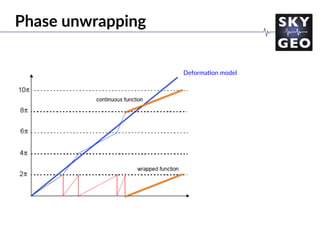
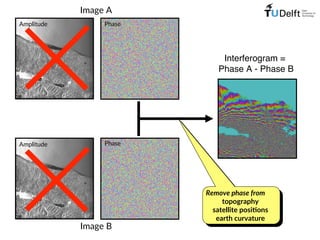
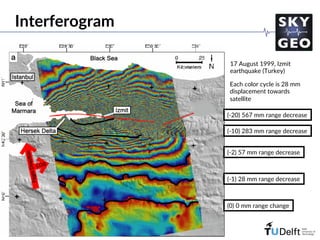
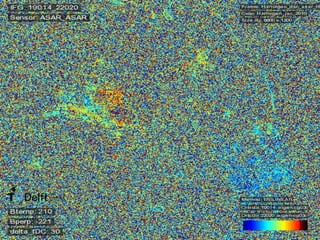
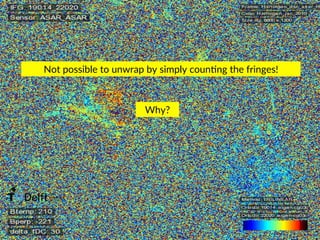
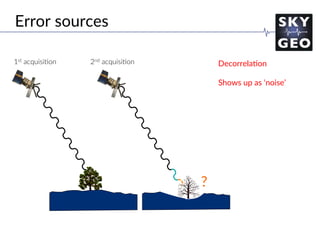
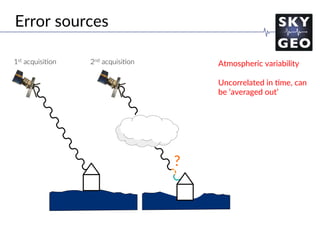
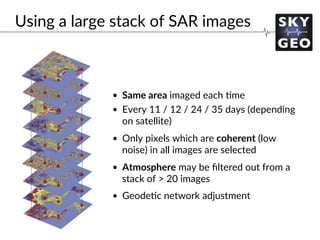
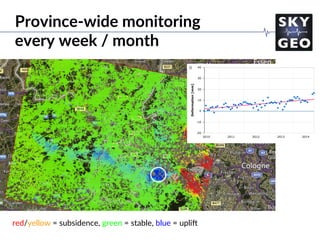
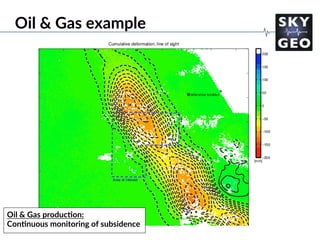
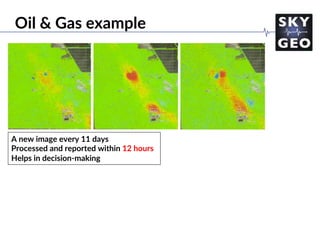
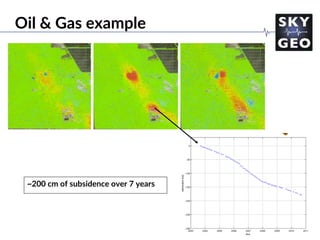
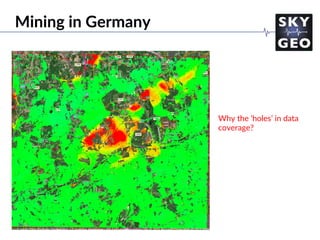
This document summarizes a presentation on using interferometric synthetic aperture radar (InSAR) to monitor ground deformation from space. It explains that InSAR allows wide-area and fine-resolution monitoring of ground deformation through clouds and at night. Examples are given of using InSAR to monitor deformation related to earthquakes and volcanoes. The presentation discusses how InSAR works by measuring phase differences between acquisitions to detect millimeter-level changes in ground position. It also addresses challenges like phase unwrapping and decorrelation, and shows examples of InSAR monitoring subsidence from oil/gas extraction and underground mining.


![20260201 [FOSDEM] gomodjail - library sandboxing for Go modules.pdf](https://cdn.slidesharecdn.com/ss_thumbnails/20260201fosdemgomodjail-librarysandboxingforgomodules-260201225659-76609ec4-thumbnail.jpg?width=640&height=640&fit=bounds)


