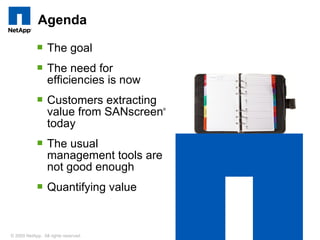
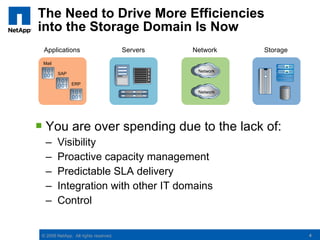
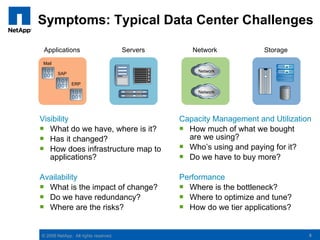
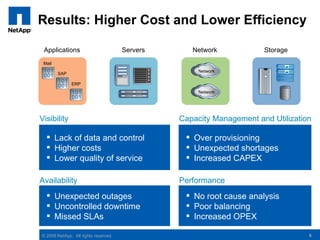
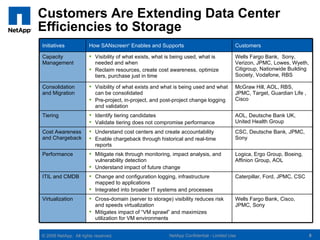
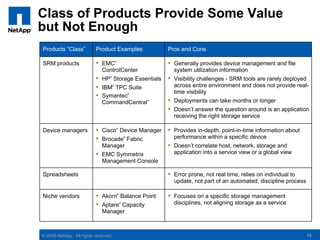
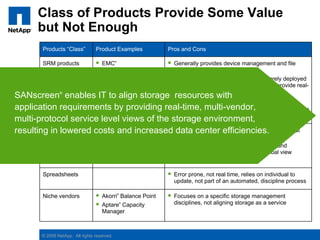
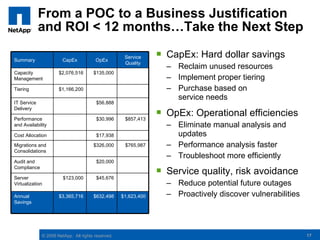
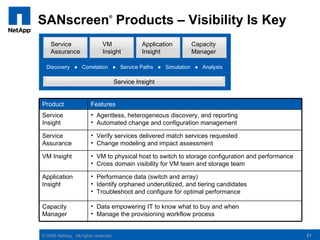
Tag line, tag line


SANscreen      ®


Driving out Costs by
Extending Data Center
Efficiencies to Storage
June 2009
Agenda

              The goal
              The need for
               efficiencies is now
              Customers extracting
               value from SANscreen                    ®


               today
              The usual
               management tools are
               not good enough
              Quantifying value


© 2009 NetApp.©All rights reserved. rights reserved.
                2008 NetApp. All                           2
The Goal: Let Us Show the Value
You Can Extract from SANscreen          ®


       Via a demonstration and a 2-3 week POC


 Prove hard dollar savings based on real data

 Prove operational and service quality savings

 Prove technology does what we say it does


© 2008 NetApp. All rights reserved.               3
The Need to Drive More Efficiencies
into the Storage Domain Is Now
  Applications                         Servers   Network    Storage
 Mail
                                                  Network
        SAP

               ERP
                                                  Network


 You are over spending due to the lack of:
  –     Visibility
  –     Proactive capacity management
  –     Predictable SLA delivery
  –     Integration with other IT domains
  –     Control


 © 2008 NetApp. All rights reserved.                                  4
Symptoms: Typical Data Center Challenges

 Applications                         Servers      Network            Storage
Mail
                                                     Network
       SAP

              ERP
                                                     Network


Visibility                                      Capacity Management and Utilization
 What do we have, where is it?                  How much of what we bought
 Has it changed?                                 are we using?
 How does infrastructure map to                 Who’s using and paying for it?
   applications?                                 Do we have to buy more?

Availability                                    Performance
 What is the impact of change?                  Where is the bottleneck?
 Do we have redundancy?                         Where to optimize and tune?
 Where are the risks?                           How do we tier applications?


© 2008 NetApp. All rights reserved.                                               5
Results: Higher Cost and Lower Efficiency

 Applications                         Servers      Network            Storage
 Mail
                                                     Network
        SAP

              ERP
                                                     Network


Visibility                                      Capacity Management and Utilization
 What do we have, where is it?                  How much of what we bought
 Has it changed? control
    Lack of data and                              are we provisioning
                                                    Over using?
 How does infrastructure map to
    Higher costs                                 Who’s using and paying for it?
                                                    Unexpected shortages
  applications? of service
    Lower quality                                Do we have CAPEX
                                                    Increased to buy more?

Availability                                    Performance
 What is the impact of change?                  Where is the bottleneck?
  Unexpected outages                             No root cause analysis
 Do we have redundancy?                         Where to optimize and tune?
  Uncontrolled downtime                          Poor balancing
 Where are the risks?                           How do we tier applications?
       Missed SLAs                               Increased OPEX

© 2008 NetApp. All rights reserved.                                               6
Customers Are
Extracting Value
Today


© 2009 NetApp. All rights reserved.
  2008                                7
Customers Are Extending Data Center
Efficiencies to Storage
Initiatives            How SANscreen Enables and Supports
                                       ®
                                                                                         Customers

Capacity                Visibility of what exists, what is being used, what is          Wells Fargo Bank, Sony,
Management               needed and when                                                 Verizon, JPMC, Lowes, Wyeth,
                        Reclaim resources, create cost awareness, optimize              Citigroup, Nationwide Building
                         tiers, purchase just in time                                    Society, Vodafone, RBS

Consolidation           Visibility of what exists and what is being used and what       McGraw Hill, AOL, RBS,
and Migration            can be consolidated                                             JPMC, Target, Guardian Life ,
                        Pre-project, in-project, and post-project change logging        Cisco
                         and validation
Tiering                 Identify tiering candidates                                     AOL, Deutsche Bank UK,
                        Validate tiering does not compromise performance                United Health Group
Cost Awareness          Understand cost centers and create accountability               CSC, Deutsche Bank, JPMC,
and Chargeback          Enable chargeback through historical and real-time              Sony
                         reports
Performance             Mitigate risk through monitoring, impact analysis, and          Logica, Ergo Group, Boeing,
                         vulnerability detection                                         Affinion Group, AOL
                        Understand impact of future change
ITIL and CMDB           Change and configuration logging, infrastructure                Caterpillar, Ford, JPMC, CSC
                         mapped to applications
                        Integrated into broader IT systems and processes
Virtualization          Cross-domain (server to storage) visibility reduces risk        Wells Fargo Bank, Cisco,
                         and speeds virtualization                                       JPMC, Sony
                        Mitigates impact of “VM sprawl” and maximizes
                         utilization for VM environments


© 2008 NetApp. All rights reserved.                      NetApp Confidential - Limited Use                                8
Combination of Existing
Tools Does Not Provide
Expected Efficiencies
and Cost Relief


© 2009 NetApp. All rights reserved.
  2008                                9
Class of Products Provide Some Value
but Not Enough
Products “Class”          Product Examples                   Pros and Cons

SRM products               EMC          ®
                                                              Generally provides device management and file
                            ControlCenter                      system utilization information
                           HP Storage Essentials
                                 ®
                                                              Visibility challenges - SRM tools are rarely deployed
                           IBM TPC Suite
                                     ®                         across entire environment and does not provide real-
                                                               time visibility
                           Symantec                     ®


                            CommandCentral™                   Deployments can take months or longer
                                                              Doesn’t answer the question around is an application
                                                               receiving the right storage service

Device managers            Cisco Device Manager
                                         ®
                                                              Provides in-depth, point-in-time information about
                           Brocade Fabric           ®         performance within a specific device
                            Manager                           Doesn’t correlate host, network, storage and
                           EMC Symmetrix                      application into a service view or a global view
                            Management Console

Spreadsheets                                                  Error prone, not real time, relies on individual to
                                                               update, not part of an automated, discipline process

Niche vendors              Akorri Balance Point
                                             ®
                                                              Focuses on a specific storage management
                           Aptare Capacity      ®             disciplines, not aligning storage as a service
                            Manager


© 2008 NetApp. All rights reserved.                                                                                   10
Class of Products Provide Some Value
      but Not Enough
        Products “Class”          Product Examples                   Pros and Cons

        SRM products               EMC        Generally provides device management and file
                                                 ®


                                    ControlCenter
                                                system utilization information
                                   HP Storage Essentials
                                         ®
                                               Visibility challenges - SRM tools are rarely deployed
                           IBM TPC Suite    ®  across entire environment and does not provide real-
SANscreen®         enablesIT to align storage time visibility with
                            Symantec            resources        ®


                                               Deployments can take months or longer
                            CommandCentral™
application requirements by providing real-time, multi-vendor, is an application
                                                Doesn’t answer the question around
                                                 receiving the right storage service
multi-protocol service level views of the storage environment,
resulting in lowered costs and increased Providescenter point-in-time information about
        Device managers  Cisco Device Manager  data in-depth, efficiencies.
                                                 ®


                                   Brocade Fabric           ®         performance within a specific device
                                    Manager                           Doesn’t correlate host, network, storage and
                                   EMC Symmetrix                      application into a service view or a global view
                                    Management Console

        Spreadsheets                                                  Error prone, not real time, relies on individual to
                                                                       update, not part of an automated, discipline process

        Niche vendors              Akorri Balance Point
                                                     ®
                                                                      Focuses on a specific storage management
                                   Aptare Capacity      ®             disciplines, not aligning storage as a service
                                    Manager


        © 2008 NetApp. All rights reserved.
Did You Know?
 90% of SANscreen customers have some form of SRM product
                                      ®


  deployed
 Over 50% of SANscreen customers use ECC
 Some of the largest ECC customers in the world are SANscreen
  customers
 SANscreen provides business relevant
  decision support that device management
  tools cannot provide
 SANscreen provides the critical information                SANscreen

  and helps IT automate the processes
  required for key data center initiatives                                            Servers


 SANscreen extends all device
  management solutions
                                                                              Switches


   – Aggregates data from across the entire
     end-to-end storage environment (VMs,
     servers, switches, and storage)            EMC®      HDS®     HP®     EMC         NetApp®
                                              CLARiiON®                  Symmetrix®    FAS6000


© 2008 NetApp. All rights reserved.                                                              12
Quantifying Value


© 2009 NetApp. All rights reserved.
  2008                                13
Let Us Show the Value You
Can Extract from SANscreen            ®


       Via a demonstration and a 2-3 week POC


 Prove hard dollar savings based on real data

 Prove operational and service quality savings

 Prove technology does what we say it does


© 2008 NetApp. All rights reserved.               14
Highlights from POCs
                                                        SANscreen®


 Identify
                                                                                  Servers

   – TBs of potential orphan or
     underutilized storage                                                Switches


   – Tier misalignments
   – Hosts with potential multi-path       EMC®      HDS®      HP®     EMC         NetApp®

     issues                              CLARiiON®                   Symmetrix®    FAS6000


   – Hosts that are underutilized on the fabric
   – SAN violations
   – And more…

 Installed in production environments in a
  matter of a few days—no host agents required

© 2008 NetApp. All rights reserved.
POCs and SANscreen Value
 Large media conglomerate                                                        SANscreen®


    –     Needed to better analyze capacity
          consumption and to provide cost accounting                                                        Servers


          for their chargeback model
    –     POC findings:
                                                                                                    Switches


           $800K CapEx savings – including 70TB of
            orphaned storage
 Diversified financial services company                             EMC®      HDS®      HP®     EMC         NetApp®
                                                                   CLARiiON®                   Symmetrix®    FAS6000

    –     Needed to accurately forecast consumption
          rates of multi-vendor environment
    –     SANscreen solution ®


           Provided end-to-end monitoring of VMs to storage and capacity management
            reports across multi-vendor storage estate
 Leading global Web company
    –     SANscreen solutions
           Reduced a data center consolidation project time from a 5 month estimate,
            to 2 months actual
           Inversed tiering strategy resulting in 25% tier 1 capacity and 75% tier 2 capacity


 © 2008 NetApp. All rights reserved.                                                                                  16
From a POC to a Business Justification
             and ROI < 12 months…Take the Next Step

Summary                CapEx           OpEx
                                                    Service      CapEx: Hard dollar savings
                                                    Quality
                                                                  – Reclaim unused resources
Capacity             $2,076,516       $135,000
Management                                                        – Implement proper tiering
Tiering              $1,166,200                                   – Purchase based on
                                                                    service needs
IT Service                             $56,888
Delivery
                                                                 OpEx: Operational efficiencies
Performance                            $30,996      $857,413
and Availability                                                  – Eliminate manual analysis and
Cost Allocation                        $17,938                      updates
Migrations and                        $326,000      $765,987      – Performance analysis faster
Consolidations
                                                                  – Troubleshoot more efficiently
Audit and                              $20,000
Compliance
                                                                 Service quality, risk avoidance
Server                 $123,000        $45,676
Virtualization                                                    – Reduce potential future outages
Annual               $3,365,716       $632,498     $1,623,400     – Proactively discover vulnerabilities
Savings


             © 2008 NetApp. All rights reserved.                                                           17
Tag line, tag line


Thank You


                                 18
Backup Slides


© 2009 NetApp. All rights reserved.
  2008                                19
SANscreen Basics
 SANscreen is agentless software that deploys within hours
                        ®


    –     Delivers value quickly, our competition are agent-based and can take
          months (if not years) to deploy
 Supports heterogeneous (multi-vendor, multi-protocol) SAN and NAS
  environments
    –     Provides value across entire storage estate
 Automatically correlates 1,000s of unrelated devices into application-
  relevant “service paths”
    –     VPs and directors care about applications and service levels, not low-
          level devices – SANscreen makes storage relevant to the business
 Logs all changes and assesses impact of change against storage
  policies
    –     Reduces risk and lowers cost across entire storage environment
 Unified (all storage) view and reports for capacity, performance,
  utilization, change, troubleshooting, policy monitoring, and more…
    –     Helps customers manage virtually all aspects of their storage business


 © 2008 NetApp. All rights reserved.                                               20
SANscreen Products – Visibility Is Key
                                 ®


    Service                   VM                Application   Capacity
    Assurance                 Insight           Insight       Manager

  Discovery ● Correlation ● Service Paths ● Simulation ● Analysis

                                      Service Insight


Product                 Features
Service                 • Agentless, heterogeneous discovery, and reporting
Insight                 • Automated change and configuration management

Service                 • Verify services delivered match services requested
Assurance               • Change modeling and impact assessment

VM Insight              • VM to physical host to switch to storage configuration and performance
                        • Cross domain visibility for VM team and storage team

Application             • Performance data (switch and array)
Insight                 • Identify orphaned underutilized, and tiering candidates
                        • Troubleshoot and configure for optimal performance

Capacity                • Data empowering IT to know what to buy and when
Manager                 • Manage the provisioning workflow process


© 2008 NetApp. All rights reserved.                                                                21

SANscreen Customer Preso 18 Jun09

  • 1.
    Tag line, tagline SANscreen ® Driving out Costs by Extending Data Center Efficiencies to Storage June 2009
  • 2.
    Agenda  The goal  The need for efficiencies is now  Customers extracting value from SANscreen ® today  The usual management tools are not good enough  Quantifying value © 2009 NetApp.©All rights reserved. rights reserved. 2008 NetApp. All 2
  • 3.
    The Goal: LetUs Show the Value You Can Extract from SANscreen ® Via a demonstration and a 2-3 week POC  Prove hard dollar savings based on real data  Prove operational and service quality savings  Prove technology does what we say it does © 2008 NetApp. All rights reserved. 3
  • 4.
    The Need toDrive More Efficiencies into the Storage Domain Is Now Applications Servers Network Storage Mail Network SAP ERP Network  You are over spending due to the lack of: – Visibility – Proactive capacity management – Predictable SLA delivery – Integration with other IT domains – Control © 2008 NetApp. All rights reserved. 4
  • 5.
    Symptoms: Typical DataCenter Challenges Applications Servers Network Storage Mail Network SAP ERP Network Visibility Capacity Management and Utilization  What do we have, where is it?  How much of what we bought  Has it changed? are we using?  How does infrastructure map to  Who’s using and paying for it? applications?  Do we have to buy more? Availability Performance  What is the impact of change?  Where is the bottleneck?  Do we have redundancy?  Where to optimize and tune?  Where are the risks?  How do we tier applications? © 2008 NetApp. All rights reserved. 5
  • 6.
    Results: Higher Costand Lower Efficiency Applications Servers Network Storage Mail Network SAP ERP Network Visibility Capacity Management and Utilization  What do we have, where is it?  How much of what we bought  Has it changed? control Lack of data and are we provisioning Over using?  How does infrastructure map to Higher costs  Who’s using and paying for it? Unexpected shortages applications? of service Lower quality  Do we have CAPEX Increased to buy more? Availability Performance  What is the impact of change?  Where is the bottleneck?  Unexpected outages  No root cause analysis  Do we have redundancy?  Where to optimize and tune?  Uncontrolled downtime  Poor balancing  Where are the risks?  How do we tier applications?  Missed SLAs  Increased OPEX © 2008 NetApp. All rights reserved. 6
  • 7.
    Customers Are Extracting Value Today ©2009 NetApp. All rights reserved. 2008 7
  • 8.
    Customers Are ExtendingData Center Efficiencies to Storage Initiatives How SANscreen Enables and Supports ® Customers Capacity  Visibility of what exists, what is being used, what is Wells Fargo Bank, Sony, Management needed and when Verizon, JPMC, Lowes, Wyeth,  Reclaim resources, create cost awareness, optimize Citigroup, Nationwide Building tiers, purchase just in time Society, Vodafone, RBS Consolidation  Visibility of what exists and what is being used and what McGraw Hill, AOL, RBS, and Migration can be consolidated JPMC, Target, Guardian Life ,  Pre-project, in-project, and post-project change logging Cisco and validation Tiering  Identify tiering candidates AOL, Deutsche Bank UK,  Validate tiering does not compromise performance United Health Group Cost Awareness  Understand cost centers and create accountability CSC, Deutsche Bank, JPMC, and Chargeback  Enable chargeback through historical and real-time Sony reports Performance  Mitigate risk through monitoring, impact analysis, and Logica, Ergo Group, Boeing, vulnerability detection Affinion Group, AOL  Understand impact of future change ITIL and CMDB  Change and configuration logging, infrastructure Caterpillar, Ford, JPMC, CSC mapped to applications  Integrated into broader IT systems and processes Virtualization  Cross-domain (server to storage) visibility reduces risk Wells Fargo Bank, Cisco, and speeds virtualization JPMC, Sony  Mitigates impact of “VM sprawl” and maximizes utilization for VM environments © 2008 NetApp. All rights reserved. NetApp Confidential - Limited Use 8
  • 9.
    Combination of Existing ToolsDoes Not Provide Expected Efficiencies and Cost Relief © 2009 NetApp. All rights reserved. 2008 9
  • 10.
    Class of ProductsProvide Some Value but Not Enough Products “Class” Product Examples Pros and Cons SRM products  EMC ®  Generally provides device management and file ControlCenter system utilization information  HP Storage Essentials ®  Visibility challenges - SRM tools are rarely deployed  IBM TPC Suite ® across entire environment and does not provide real- time visibility  Symantec ® CommandCentral™  Deployments can take months or longer  Doesn’t answer the question around is an application receiving the right storage service Device managers  Cisco Device Manager ®  Provides in-depth, point-in-time information about  Brocade Fabric ® performance within a specific device Manager  Doesn’t correlate host, network, storage and  EMC Symmetrix application into a service view or a global view Management Console Spreadsheets  Error prone, not real time, relies on individual to update, not part of an automated, discipline process Niche vendors  Akorri Balance Point ®  Focuses on a specific storage management  Aptare Capacity ® disciplines, not aligning storage as a service Manager © 2008 NetApp. All rights reserved. 10
  • 11.
    Class of ProductsProvide Some Value but Not Enough Products “Class” Product Examples Pros and Cons SRM products  EMC  Generally provides device management and file ® ControlCenter system utilization information  HP Storage Essentials ®  Visibility challenges - SRM tools are rarely deployed  IBM TPC Suite ® across entire environment and does not provide real- SANscreen® enablesIT to align storage time visibility with Symantec resources ®  Deployments can take months or longer CommandCentral™ application requirements by providing real-time, multi-vendor, is an application  Doesn’t answer the question around receiving the right storage service multi-protocol service level views of the storage environment, resulting in lowered costs and increased Providescenter point-in-time information about Device managers  Cisco Device Manager  data in-depth, efficiencies. ®  Brocade Fabric ® performance within a specific device Manager  Doesn’t correlate host, network, storage and  EMC Symmetrix application into a service view or a global view Management Console Spreadsheets  Error prone, not real time, relies on individual to update, not part of an automated, discipline process Niche vendors  Akorri Balance Point ®  Focuses on a specific storage management  Aptare Capacity ® disciplines, not aligning storage as a service Manager © 2008 NetApp. All rights reserved.
  • 12.
    Did You Know? 90% of SANscreen customers have some form of SRM product ® deployed  Over 50% of SANscreen customers use ECC  Some of the largest ECC customers in the world are SANscreen customers  SANscreen provides business relevant decision support that device management tools cannot provide  SANscreen provides the critical information SANscreen and helps IT automate the processes required for key data center initiatives Servers  SANscreen extends all device management solutions Switches – Aggregates data from across the entire end-to-end storage environment (VMs, servers, switches, and storage) EMC® HDS® HP® EMC NetApp® CLARiiON® Symmetrix® FAS6000 © 2008 NetApp. All rights reserved. 12
  • 13.
    Quantifying Value © 2009NetApp. All rights reserved. 2008 13
  • 14.
    Let Us Showthe Value You Can Extract from SANscreen ® Via a demonstration and a 2-3 week POC  Prove hard dollar savings based on real data  Prove operational and service quality savings  Prove technology does what we say it does © 2008 NetApp. All rights reserved. 14
  • 15.
    Highlights from POCs SANscreen®  Identify Servers – TBs of potential orphan or underutilized storage Switches – Tier misalignments – Hosts with potential multi-path EMC® HDS® HP® EMC NetApp® issues CLARiiON® Symmetrix® FAS6000 – Hosts that are underutilized on the fabric – SAN violations – And more…  Installed in production environments in a matter of a few days—no host agents required © 2008 NetApp. All rights reserved.
  • 16.
    POCs and SANscreenValue  Large media conglomerate SANscreen® – Needed to better analyze capacity consumption and to provide cost accounting Servers for their chargeback model – POC findings: Switches  $800K CapEx savings – including 70TB of orphaned storage  Diversified financial services company EMC® HDS® HP® EMC NetApp® CLARiiON® Symmetrix® FAS6000 – Needed to accurately forecast consumption rates of multi-vendor environment – SANscreen solution ®  Provided end-to-end monitoring of VMs to storage and capacity management reports across multi-vendor storage estate  Leading global Web company – SANscreen solutions  Reduced a data center consolidation project time from a 5 month estimate, to 2 months actual  Inversed tiering strategy resulting in 25% tier 1 capacity and 75% tier 2 capacity © 2008 NetApp. All rights reserved. 16
  • 17.
    From a POCto a Business Justification and ROI < 12 months…Take the Next Step Summary CapEx OpEx Service  CapEx: Hard dollar savings Quality – Reclaim unused resources Capacity $2,076,516 $135,000 Management – Implement proper tiering Tiering $1,166,200 – Purchase based on service needs IT Service $56,888 Delivery  OpEx: Operational efficiencies Performance $30,996 $857,413 and Availability – Eliminate manual analysis and Cost Allocation $17,938 updates Migrations and $326,000 $765,987 – Performance analysis faster Consolidations – Troubleshoot more efficiently Audit and $20,000 Compliance  Service quality, risk avoidance Server $123,000 $45,676 Virtualization – Reduce potential future outages Annual $3,365,716 $632,498 $1,623,400 – Proactively discover vulnerabilities Savings © 2008 NetApp. All rights reserved. 17
  • 18.
    Tag line, tagline Thank You 18
  • 19.
    Backup Slides © 2009NetApp. All rights reserved. 2008 19
  • 20.
    SANscreen Basics  SANscreenis agentless software that deploys within hours ® – Delivers value quickly, our competition are agent-based and can take months (if not years) to deploy  Supports heterogeneous (multi-vendor, multi-protocol) SAN and NAS environments – Provides value across entire storage estate  Automatically correlates 1,000s of unrelated devices into application- relevant “service paths” – VPs and directors care about applications and service levels, not low- level devices – SANscreen makes storage relevant to the business  Logs all changes and assesses impact of change against storage policies – Reduces risk and lowers cost across entire storage environment  Unified (all storage) view and reports for capacity, performance, utilization, change, troubleshooting, policy monitoring, and more… – Helps customers manage virtually all aspects of their storage business © 2008 NetApp. All rights reserved. 20
  • 21.
    SANscreen Products –Visibility Is Key ® Service VM Application Capacity Assurance Insight Insight Manager Discovery ● Correlation ● Service Paths ● Simulation ● Analysis Service Insight Product Features Service • Agentless, heterogeneous discovery, and reporting Insight • Automated change and configuration management Service • Verify services delivered match services requested Assurance • Change modeling and impact assessment VM Insight • VM to physical host to switch to storage configuration and performance • Cross domain visibility for VM team and storage team Application • Performance data (switch and array) Insight • Identify orphaned underutilized, and tiering candidates • Troubleshoot and configure for optimal performance Capacity • Data empowering IT to know what to buy and when Manager • Manage the provisioning workflow process © 2008 NetApp. All rights reserved. 21