Behavior
Sampling
Behavior sampling isone method of documenting behavior in a
study.
This type of study is accomplished by choosing what behavior to
observe and setting a schedule for examining the behavior.
• For instance, a researcher may choose to observe a classroom for 15
minutes each day to observe student interactions.
3.
According to Kerlinger(1987) there are two aspects of behavior
sampling:
EVENT SAMPLING
TIME SAMPLING
4.
Event Sampling
Refers tothe selection of observed integral occurrences or
events of a situation.
Focus on perceived problems and find solutions to manage
the behavior more effectively.
Example: Used to identify the child's response to certain behaviors,
triggers, and interactions.
5.
Time Sampling
Refers tothe selection of behavioral units for observation at
different points in time.
Time sampling is often used where there is a concern about an
aspect of behavior. It involves observing a child for an extended
period such as a whole morning/afternoon session, or even a
whole day.
Example: Observing a child’s total behavior and finding out what a child
does typically during the course of a day.
6.
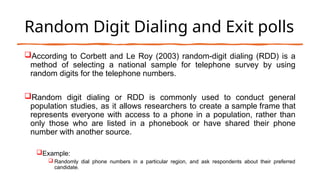
Random Digit Dialingand Exit polls
According to Corbett and Le Roy (2003) random-digit dialing (RDD) is a
method of selecting a national sample for telephone survey by using
random digits for the telephone numbers.
Random digit dialing or RDD is commonly used to conduct general
population studies, as it allows researchers to create a sample frame that
represents everyone with access to a phone in a population, rather than
only those who are listed in a phonebook or have shared their phone
number with another source.
Example:
Randomly dial phone numbers in a particular region, and ask respondents about their preferred
candidate.
7.
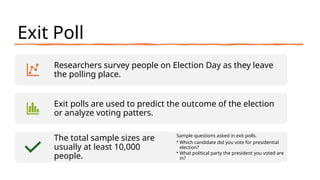
Exit Poll
Researchers surveypeople on Election Day as they leave
the polling place.
Exit polls are used to predict the outcome of the election
or analyze voting patters.
The total sample sizes are
usually at least 10,000
people.
Sample questions asked in exit polls.
• Which candidate did you vote for presidential
election?
• What political party the president you voted are
in?
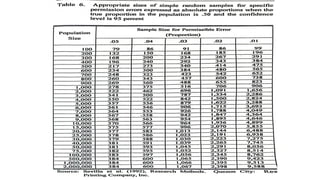
McMillan (1992) says“It depends.” Sample size depends
upon the:
researcher’s finance,
the problem,
the categories to be employed in the analysis of data,
the nature of population (whether it is homogeneous or
heterogeneous), and
Ultimate purpose for which the study is undertaken
(whether for theoretical or for practical ends).
10.
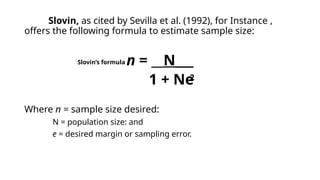
Slovin, as citedby Sevilla et al. (1992), for Instance ,
offers the following formula to estimate sample size:
n = __N___
1 + Ne
Where n = sample size desired:
N = population size: and
e = desired margin or sampling error.
2
Slovin’s formula
11.
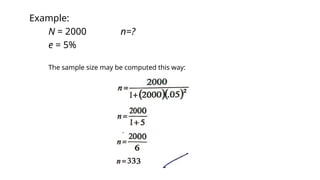
Example:
N = 2000n=?
e = 5%
The sample size may be computed this way:
12.
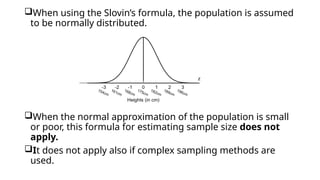
When using theSlovin’s formula, the population is assumed
to be normally distributed.
When the normal approximation of the population is small
or poor, this formula for estimating sample size does not
apply.
It does not apply also if complex sampling methods are
used.
14.
Margin of
Error vs
Confidenc
eLevel
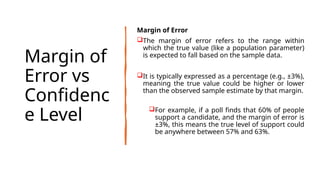
Margin of Error
The margin of error refers to the range within
which the true value (like a population parameter)
is expected to fall based on the sample data.
It is typically expressed as a percentage (e.g., ±3%),
meaning the true value could be higher or lower
than the observed sample estimate by that margin.
For example, if a poll finds that 60% of people
support a candidate, and the margin of error is
±3%, this means the true level of support could
be anywhere between 57% and 63%.
15.
Confidenc
e Level
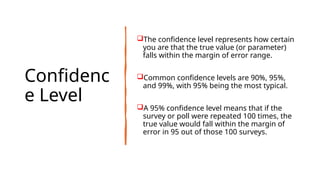
The confidencelevel represents how certain
you are that the true value (or parameter)
falls within the margin of error range.
Common confidence levels are 90%, 95%,
and 99%, with 95% being the most typical.
A 95% confidence level means that if the
survey or poll were repeated 100 times, the
true value would fall within the margin of
error in 95 out of those 100 surveys.
16.
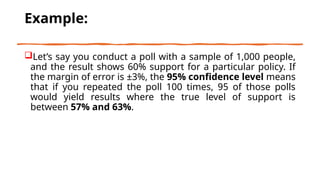
Example:
Let’s say youconduct a poll with a sample of 1,000 people,
and the result shows 60% support for a particular policy. If
the margin of error is ±3%, the 95% confidence level means
that if you repeated the poll 100 times, 95 of those polls
would yield results where the true level of support is
between 57% and 63%.
17.
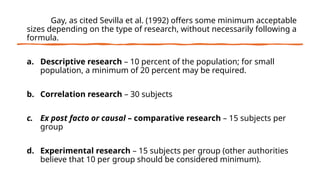
Gay, as citedSevilla et al. (1992) offers some minimum acceptable
sizes depending on the type of research, without necessarily following a
formula.
a. Descriptive research – 10 percent of the population; for small
population, a minimum of 20 percent may be required.
b. Correlation research – 30 subjects
c. Ex post facto or causal – comparative research – 15 subjects per
group
d. Experimental research – 15 subjects per group (other authorities
believe that 10 per group should be considered minimum).
20.
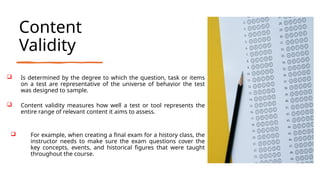
Content
Validity
Is determinedby the degree to which the question, task or items
on a test are representative of the universe of behavior the test
was designed to sample.
Content validity measures how well a test or tool represents the
entire range of relevant content it aims to assess.
For example, when creating a final exam for a history class, the
instructor needs to make sure the exam questions cover the
key concepts, events, and historical figures that were taught
throughout the course.
21.
Questions
Have youever had difficulty
answering a test question
because you did not understand
the vocabulary or the structure of
the questions?
Have you been asked questions
about material that was never
covered any of your classes?
22.
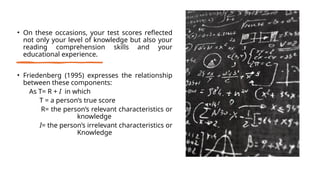
• On theseoccasions, your test scores reflected
not only your level of knowledge but also your
reading comprehension skills and your
educational experience.
• Friedenberg (1995) expresses the relationship
between these components:
As T= R + I in which
T = a person’s true score
R= the person’s relevant characteristics or
knowledge
I= the person’s irrelevant characteristics or
Knowledge
23.
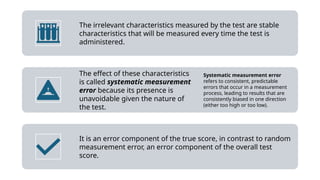
The irrelevant characteristicsmeasured by the test are stable
characteristics that will be measured every time the test is
administered.
The effect of these characteristics
is called systematic measurement
error because its presence is
unavoidable given the nature of
the test.
Systematic measurement error
refers to consistent, predictable
errors that occur in a measurement
process, leading to results that are
consistently biased in one direction
(either too high or too low).
It is an error component of the true score, in contrast to random
measurement error, an error component of the overall test
score.
24.
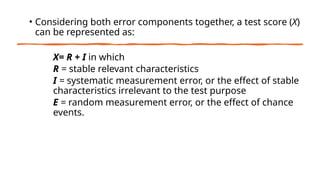
• Considering botherror components together, a test score (X)
can be represented as:
X= R + I in which
R = stable relevant characteristics
I = systematic measurement error, or the effect of stable
characteristics irrelevant to the test purpose
E = random measurement error, or the effect of chance
events.
25.
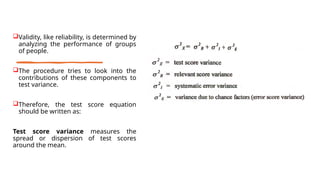
Validity, like reliability,is determined by
analyzing the performance of groups
of people.
The procedure tries to look into the
contributions of these components to
test variance.
Therefore, the test score equation
should be written as:
Test score variance measures the
spread or dispersion of test scores
around the mean.
26.
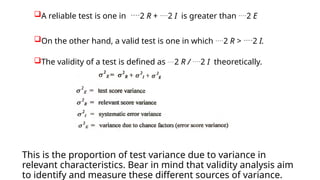
A reliable testis one in 2 R + 2 I is greater than 2 E
On the other hand, a valid test is one in which 2 R > 2 I.
The validity of a test is defined as 2 R / 2 I theoretically.
This is the proportion of test variance due to variance in
relevant characteristics. Bear in mind that validity analysis aim
to identify and measure these different sources of variance.
27.
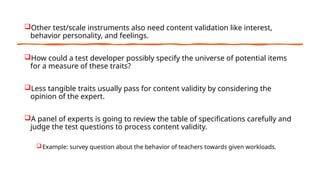
Other test/scale instrumentsalso need content validation like interest,
behavior personality, and feelings.
How could a test developer possibly specify the universe of potential items
for a measure of these traits?
Less tangible traits usually pass for content validity by considering the
opinion of the expert.
A panel of experts is going to review the table of specifications carefully and
judge the test questions to process content validity.
Example: survey question about the behavior of teachers towards given workloads.
28.
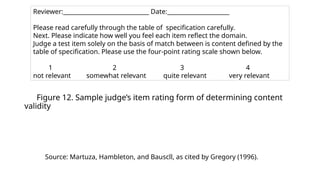
Figure 12. Samplejudge’s item rating form of determining content
validity
Source: Martuza, Hambleton, and Bauscll, as cited by Gregory (1996).
Reviewer:_____________________________ Date:_____________________
Please read carefully through the table of specification carefully.
Next. Please indicate how well you feel each item reflect the domain.
Judge a test item solely on the basis of match between is content defined by the
table of specification. Please use the four-point rating scale shown below.
1 2 3 4
not relevant somewhat relevant quite relevant very relevant
29.
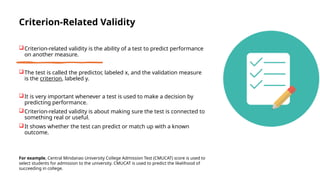
Criterion-Related Validity
Criterion-related validityis the ability of a test to predict performance
on another measure.
The test is called the predictor, labeled x, and the validation measure
is the criterion, labeled y.
It is very important whenever a test is used to make a decision by
predicting performance.
Criterion-related validity is about making sure the test is connected to
something real or useful.
It shows whether the test can predict or match up with a known
outcome.
For example, Central Mindanao University College Admission Test (CMUCAT) score is used to
select students for admission to the university. CMUCAT is used to predict the likelihood of
succeeding in college.
30.
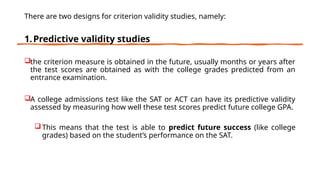
There are twodesigns for criterion validity studies, namely:
1.Predictive validity studies
the criterion measure is obtained in the future, usually months or years after
the test scores are obtained as with the college grades predicted from an
entrance examination.
A college admissions test like the SAT or ACT can have its predictive validity
assessed by measuring how well these test scores predict future college GPA.
This means that the test is able to predict future success (like college
grades) based on the student’s performance on the SAT.
31.
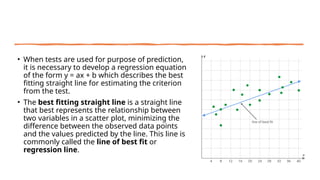
• When testsare used for purpose of prediction,
it is necessary to develop a regression equation
of the form y = ax + b which describes the best
fitting straight line for estimating the criterion
from the test.
• The best fitting straight line is a straight line
that best represents the relationship between
two variables in a scatter plot, minimizing the
difference between the observed data points
and the values predicted by the line. This line is
commonly called the line of best fit or
regression line.
32.
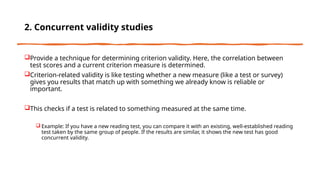
2. Concurrent validitystudies
Provide a technique for determining criterion validity. Here, the correlation between
test scores and a current criterion measure is determined.
Criterion-related validity is like testing whether a new measure (like a test or survey)
gives you results that match up with something we already know is reliable or
important.
This checks if a test is related to something measured at the same time.
Example: If you have a new reading test, you can compare it with an existing, well-established reading
test taken by the same group of people. If the results are similar, it shows the new test has good
concurrent validity.
33.
Construct Validity
The lasttype of validity is construct
validity. A construct is a theoretical,
intangible quality or trait in which
individuals differ.
Construct validity ensures that a
test measures the concept it is
intended to measure
(Messick, as cited by Gregory, 1996).
Example of constructs includes
mathematics, teacher, and school.
These constructs are inferred from
behavior, attitudes and feelings of
the individual.
34.
Construct Validity
Construct validityis about making
sure a test or tool measures what it’s
supposed to measure.
For example, if you're creating a test
to measure happiness, construct
validity checks if the test is really
measuring happiness, and not
something like stress or satisfaction.
35.
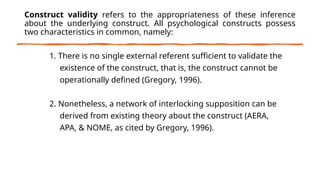
Construct validity refersto the appropriateness of these inference
about the underlying construct. All psychological constructs possess
two characteristics in common, namely:
1. There is no single external referent sufficient to validate the
existence of the construct, that is, the construct cannot be
operationally defined (Gregory, 1996).
2. Nonetheless, a network of interlocking supposition can be
derived from existing theory about the construct (AERA,
APA, & NOME, as cited by Gregory, 1996).
36.
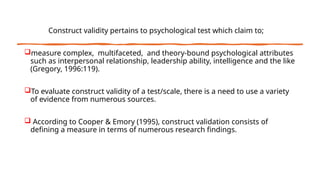
Construct validity pertainsto psychological test which claim to;
measure complex, multifaceted, and theory-bound psychological attributes
such as interpersonal relationship, leadership ability, intelligence and the like
(Gregory, 1996:119).
To evaluate construct validity of a test/scale, there is a need to use a variety
of evidence from numerous sources.
According to Cooper & Emory (1995), construct validation consists of
defining a measure in terms of numerous research findings.
37.
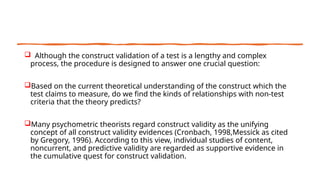
Although theconstruct validation of a test is a lengthy and complex
process, the procedure is designed to answer one crucial question:
Based on the current theoretical understanding of the construct which the
test claims to measure, do we find the kinds of relationships with non-test
criteria that the theory predicts?
Many psychometric theorists regard construct validity as the unifying
concept of all construct validity evidences (Cronbach, 1998,Messick as cited
by Gregory, 1996). According to this view, individual studies of content,
noncurrent, and predictive validity are regarded as supportive evidence in
the cumulative quest for construct validation.
38.
Approaches to
Construct Validity
Howdoes a test/scale developer determine if an instrument
possesses construct validity or not?
Most studies of construct validity fall into one of the following
categories (Gregory, 1996):
1. Analysis to determine if the test items or sub-tests are
homogeneous and therefore measure a single construct.
2. Study of developmental changes to determine if they are
consistent with the theory of the construct.
3. Research to ascertain if group differences in test scores are
theory-consistent.
39.
4. Analysis todetermine if intervention effects
on test scores are theory-consistent.
5. Correlation of the test with other related and
unrelated tests and measures.
6. Factor analysis of test scores in relation to
other sources of information.
40.
These sources ofconstruct validity evidence will be examined
below:
1. Test homogeneity.
If a test measures a single construct, then its component items will be
homogeneous (also referred to as internally consistent). To achieve this
goal, correlate each potential item with the total scores and select items
that show high correlations with the total score.
2. Appropriate developmental changes.
Many constructs can be assured to show regular age-graded changes
from early childhood into mature adulthood and perhaps beyond.
41.
3. Theory-consistent groupdifferences.
Persons with different backgrounds and characteristics obtain theory-
consistent scores on the test. Specifically, persons thought to be high on the
construct should obtain high scores, whereas persons with presumably low
amounts of the construct should obtain low scores.
4. Theory-consistent intervention effects.
This is showing the test/scale scores change in appropriate directions and
amount in reaction to planned or unplanned interventions.
42.
5. Convergent anddiscriminant validation.
Convergent validation is demonstrated when the test correlates highly with
other variables or tests that share an overlap of construct, say a correlation
of 0.5 and above.
For example, a test measuring anxiety should show high correlations with other
established anxiety measures.
On the other hand, discriminant validity is demonstrated when a test does
not correlate with variables from which it should differ.
For instance, a test for depression should not show a strong correlation with an
intelligence test, as they are distinct constructs.
43.
6. Factors analysis.
Itis a specialized statistical technique that is particularly useful for
investigating construct validity.
The purpose of factor analysis is to identify the minimum number of factors
required to account for the intercorrelations among a battery of tests.
The goal in factor analysis is to find a smaller set of dimensions called
factors that can account for the observed array of inter-correlations among
individual tests.
A typical approach in factor analysis is to administer a battery of tests to
several hundred subjects and then calculate a correlation matrix from the
scores on all possible pairs of tests.
44.
Let’s say you'redeveloping a personality inventory and hypothesize that
personality consists of five factors (such as extraversion, agreeableness,
conscientiousness, neuroticism, and openness to experience). You create a set
of items, and then use factor analysis to determine whether the items group
into these five factors. If the factor analysis shows that the items align with
these five factors, it suggests that your test has good construct validity. If the
items do not group into the expected factors, you might need to revise the
test.
45.
For example, a15-item test on the Semantic Differential Scale has been administered
to a sample of 155 students to identify the characteristics of a reflective teacher. The
computer-implemented procedures for factor analysis search this pattern of inter-
correlations, identify a small numbers of factors, then produce a table of factor
loadings. A factor loading is actually a correlation between an individual test and a
single factor.
Thus, factor loadings can vary between -1.0 and +1.0. The final outcome of a factor
analysis is a table depicting the correlation of each test with each factor. A table of
factor loadings helps describe the factorial composition of a test and thereby provides
information relevant to construct validity.
46.
More specifically, astudy was conducted to identify the
characteristics of a construct “reflective teacher”.
A Semantic Differential Scale of 15 items was responded by
155 students form Central Mindanao University Laboratory
High School.
Factor analysis was used to determine the factors that
describe a reflective teacher.
47.
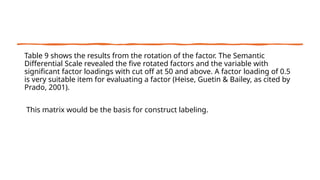
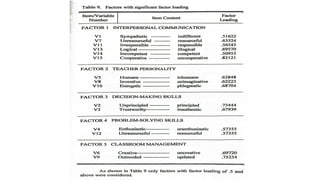
Table 9 showsthe results from the rotation of the factor. The Semantic
Differential Scale revealed the five rotated factors and the variable with
significant factor loadings with cut off at 50 and above. A factor loading of 0.5
is very suitable item for evaluating a factor (Heise, Guetin & Bailey, as cited by
Prado, 2001).
This matrix would be the basis for construct labeling.
49.
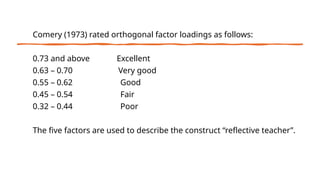
Comery (1973) ratedorthogonal factor loadings as follows:
0.73 and above Excellent
0.63 – 0.70 Very good
0.55 – 0.62 Good
0.45 – 0.54 Fair
0.32 – 0.44 Poor
The five factors are used to describe the construct “reflective teacher”.
50.
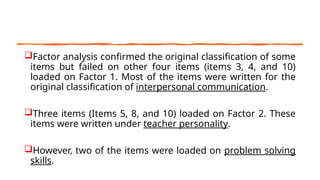
Factor analysis confirmedthe original classification of some
items but failed on other four items (items 3, 4, and 10)
loaded on Factor 1. Most of the items were written for the
original classification of interpersonal communication.
Three items (Items 5, 8, and 10) loaded on Factor 2. These
items were written under teacher personality.
However, two of the items were loaded on problem solving
skills.
51.
Two itemsloaded on Factor 3. These were
labeled as decision-making skills. Both factor 4 and
factor 5 had two factors which loaded on them.
52.
Face Validity
Face validityis not really a form of validity. A test has
face validity if it looks valid to test users, examines
and especially the examinees.
It is just a matter of social acceptability, and not a
technical form of validity in the same category as
content, criterion-related or construct validity (Nevo,
as cited by Gregory, 1996).
The test must possess face validity; otherwise, the
test takers may be dissatisfied and doubt the value
of psychological testing.
Face validity is useful in making tests appear relevant
and engaging to participants, but it’s not a
guarantee of the test's true effectiveness.
Editor's Notes
#2 Behavior - the way in which an animal or person acts in response to a particular situation or stimulus.
#45 The Semantic Differential Scale is a valuable tool for understanding how people perceive various objects, concepts, or phenomena along a range of evaluative dimensions.
The scale is designed to capture the emotional or evaluative responses of individuals to a particular object or concept.
A reflective teacher is one who actively engages in the process of self-evaluation and critical thinking about their teaching practices, experiences, and outcomes. This reflection is a key aspect of professional growth and improvement in teaching.
Factor loadings are crucial for understanding the structure of the factors in factor analysis. They help you determine which variables are most strongly associated with each factor, allowing you to interpret the factors more meaningfully. In practical terms, they guide decisions about which items to keep in a test or measurement scale, and they provide insight into how well the items are reflecting the underlying constructs you want to measure.