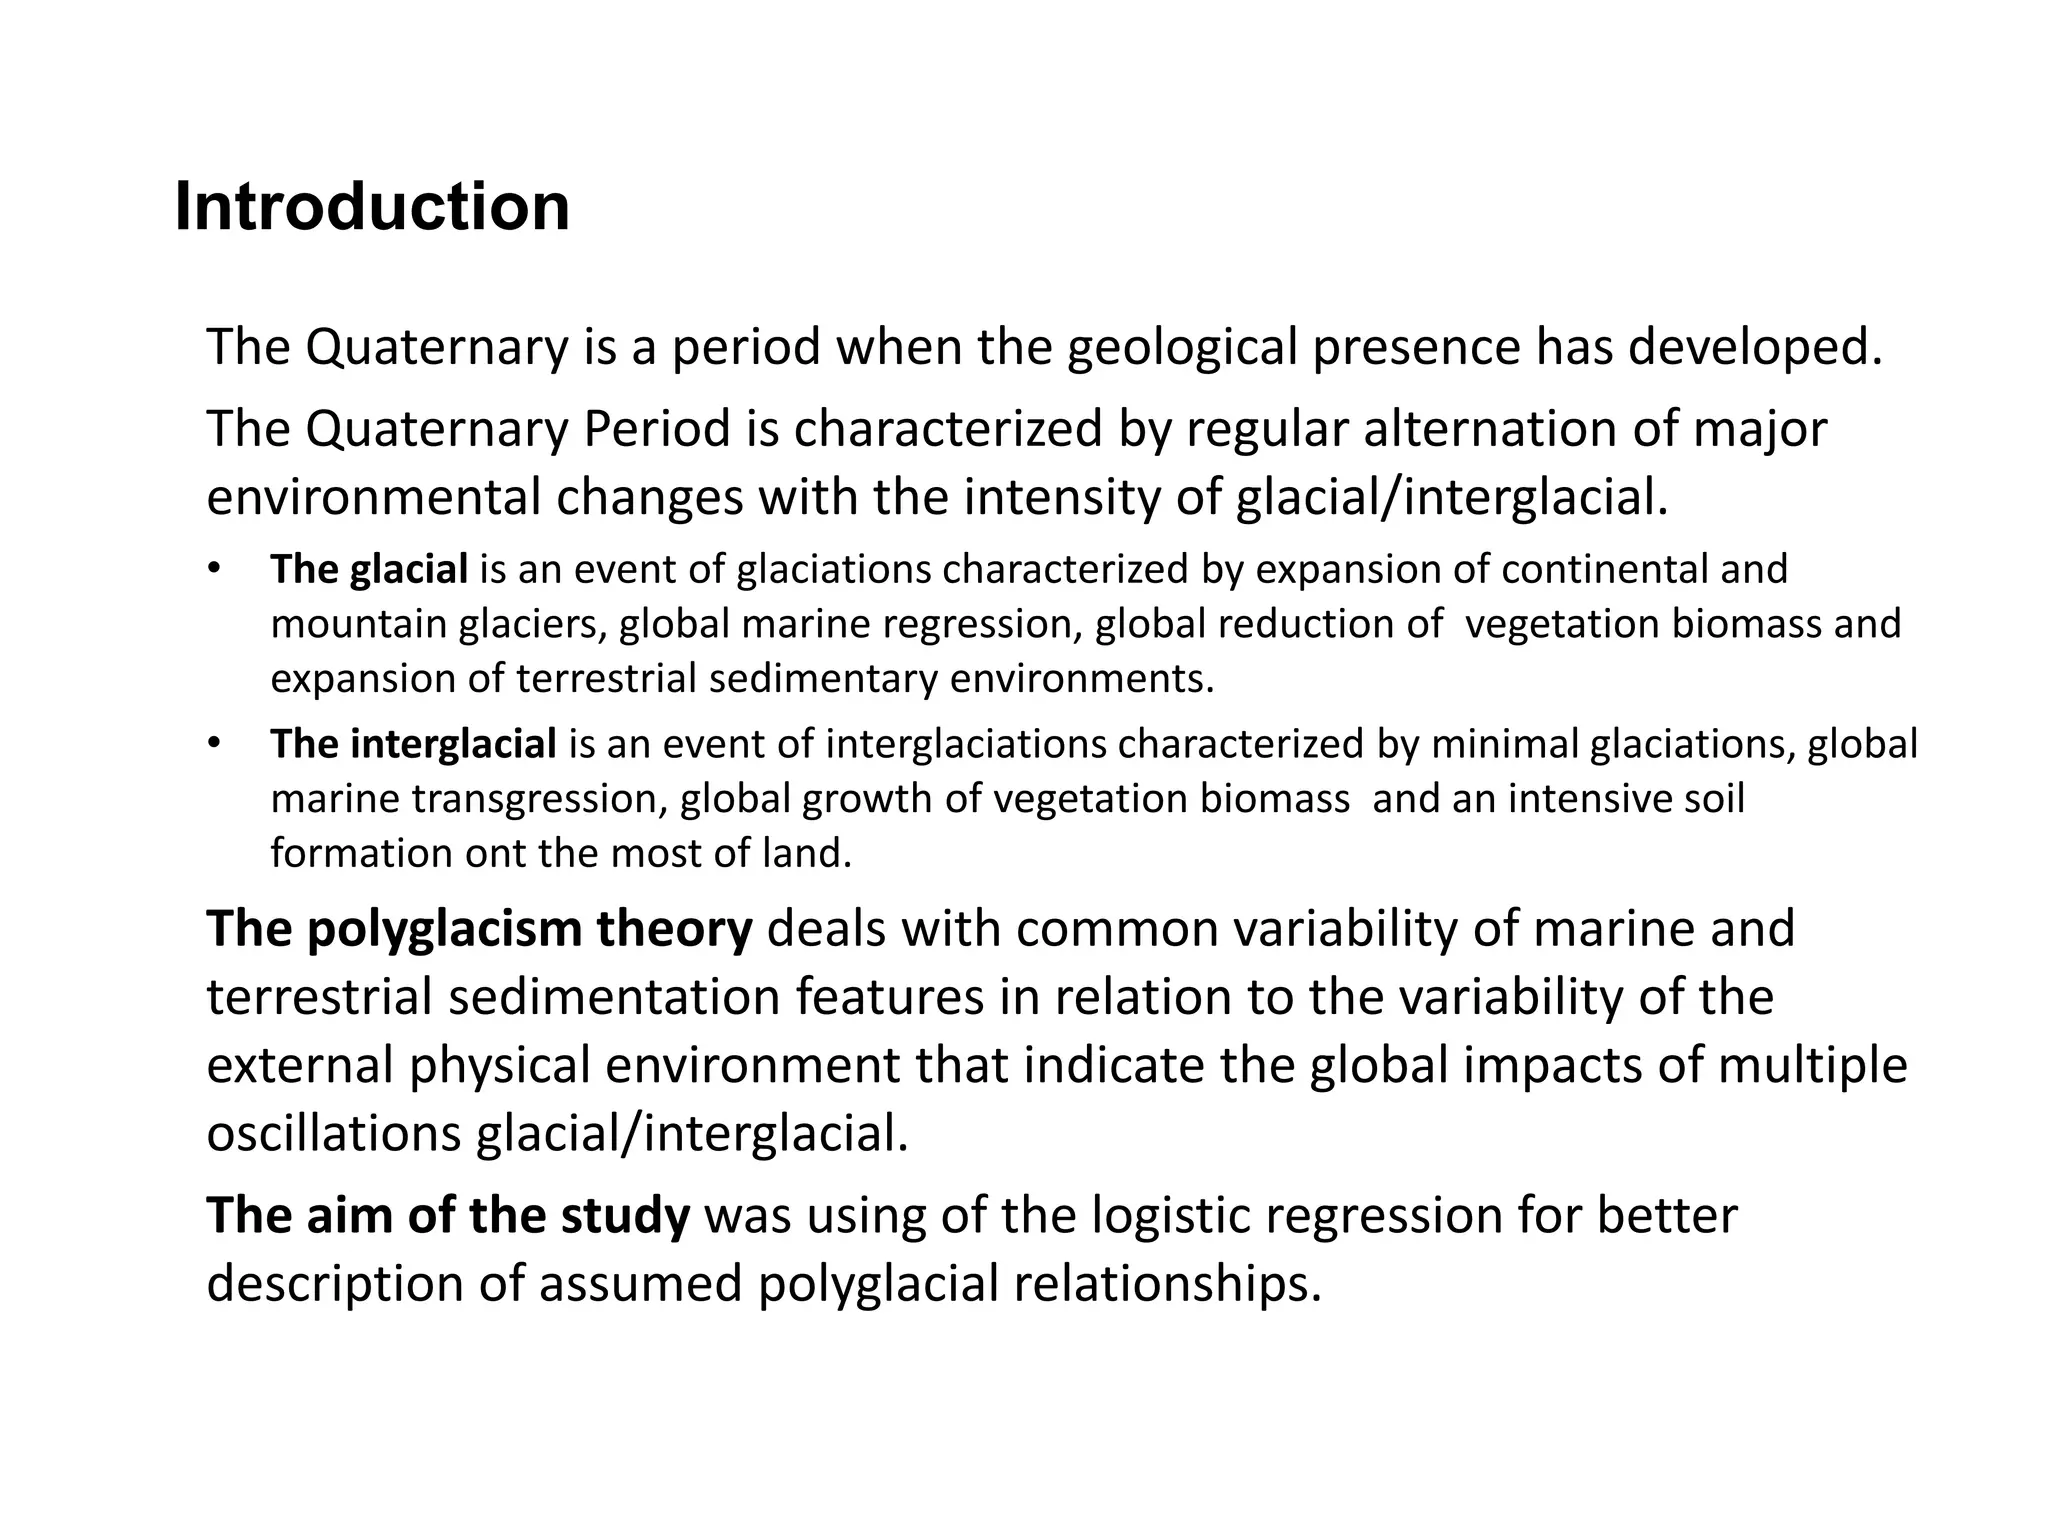
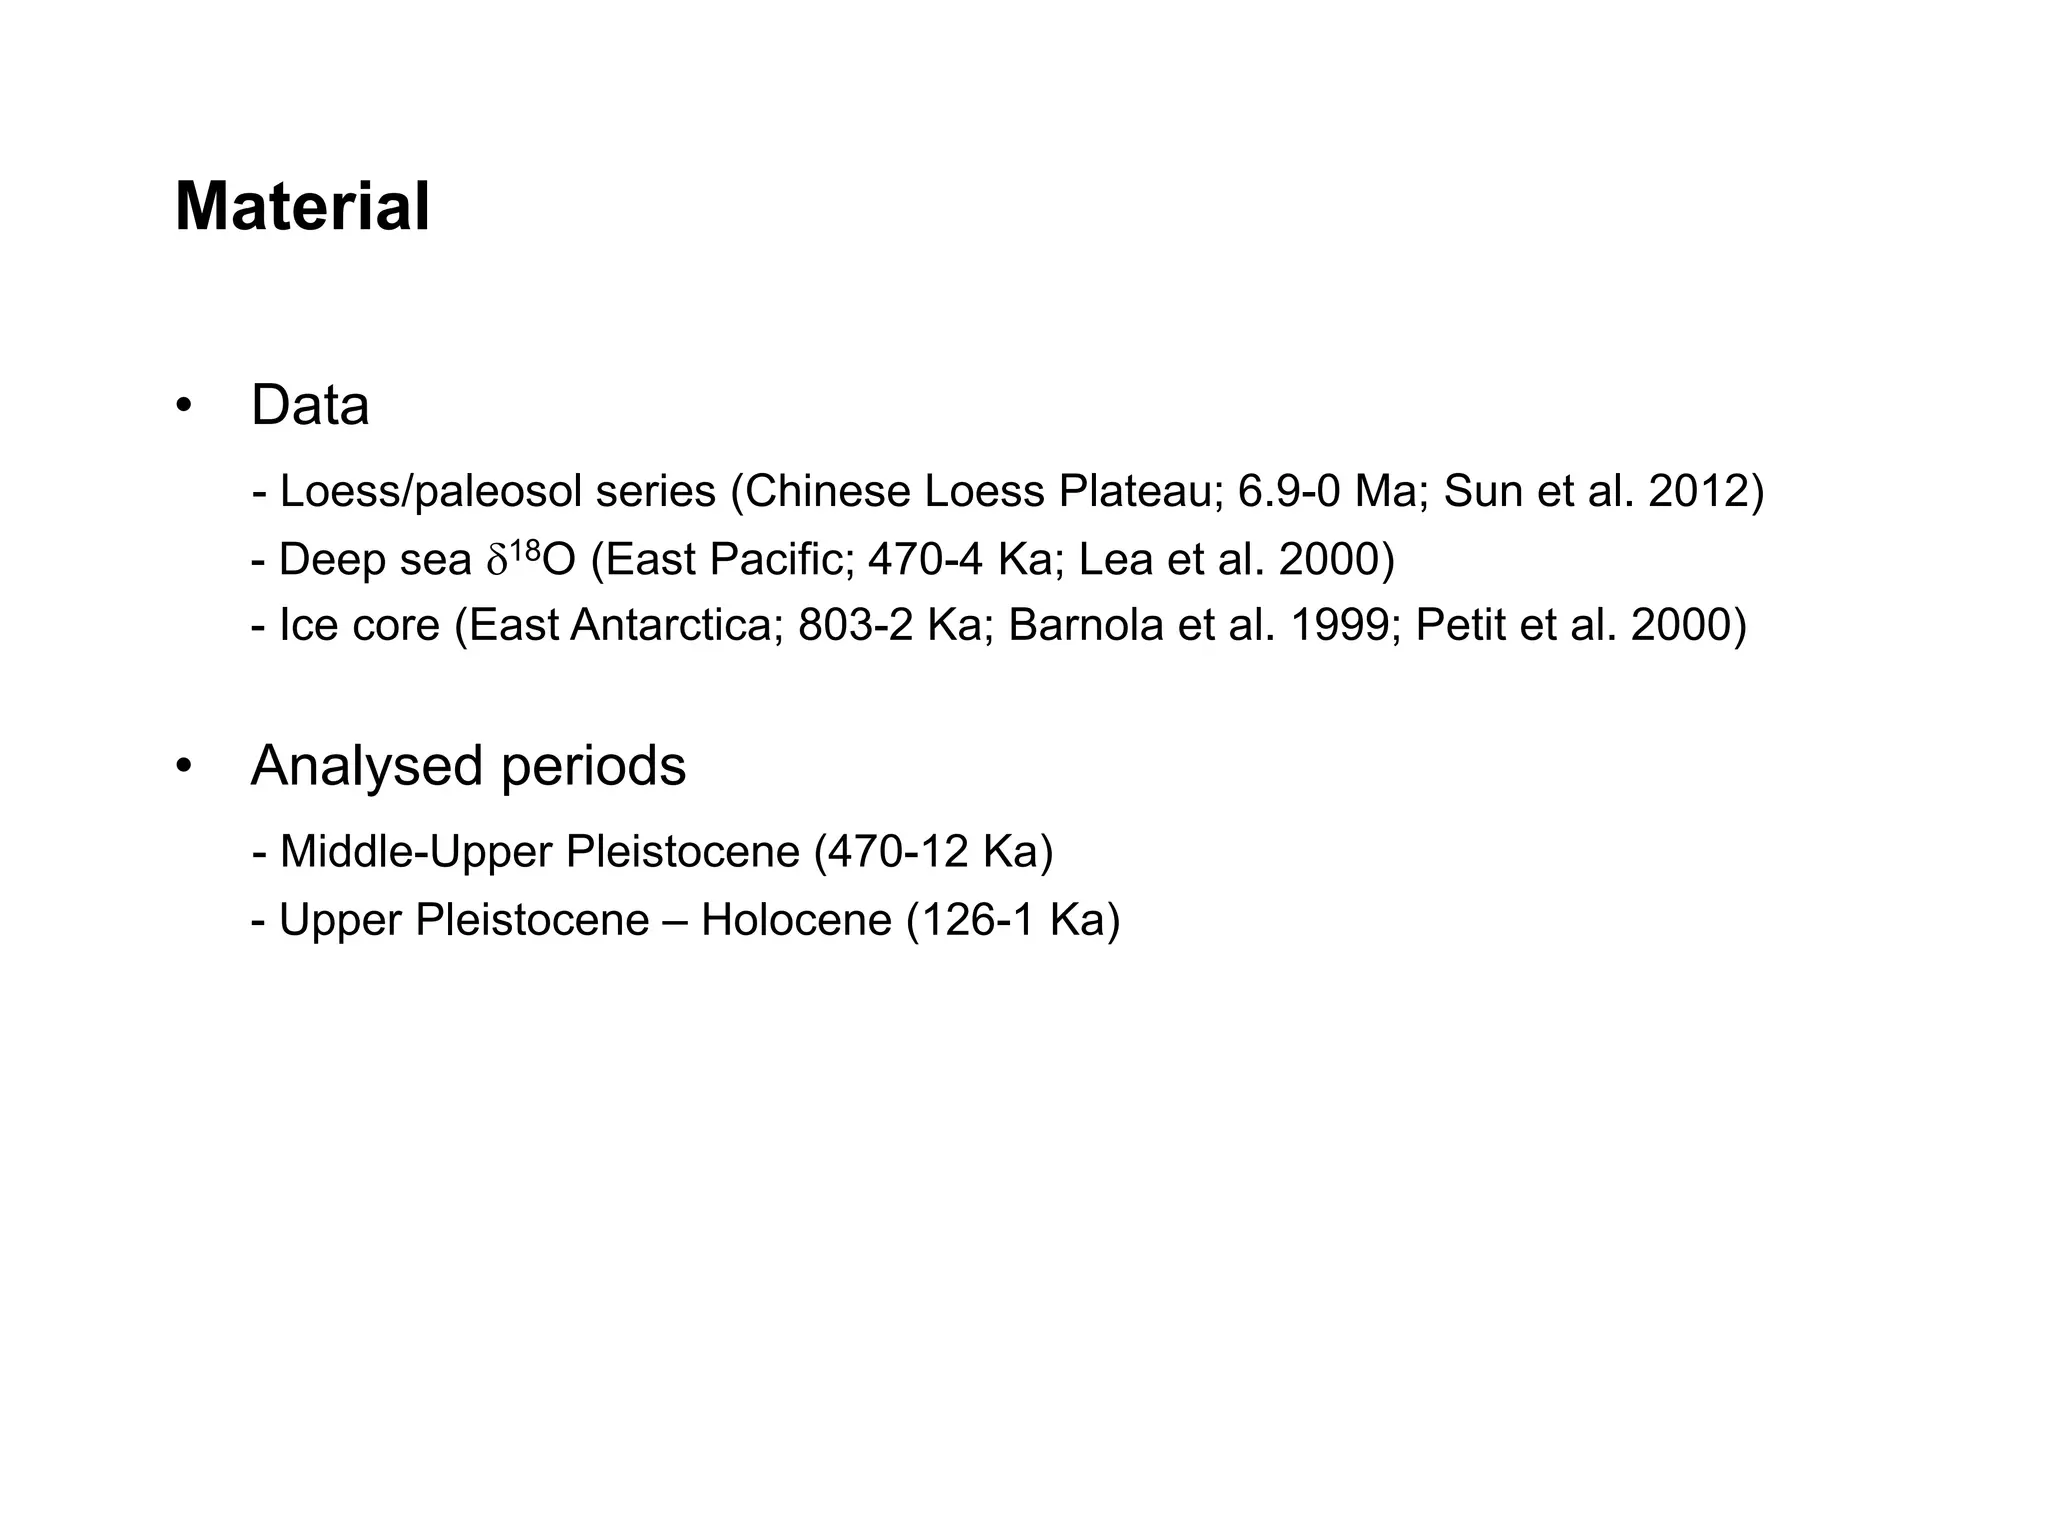
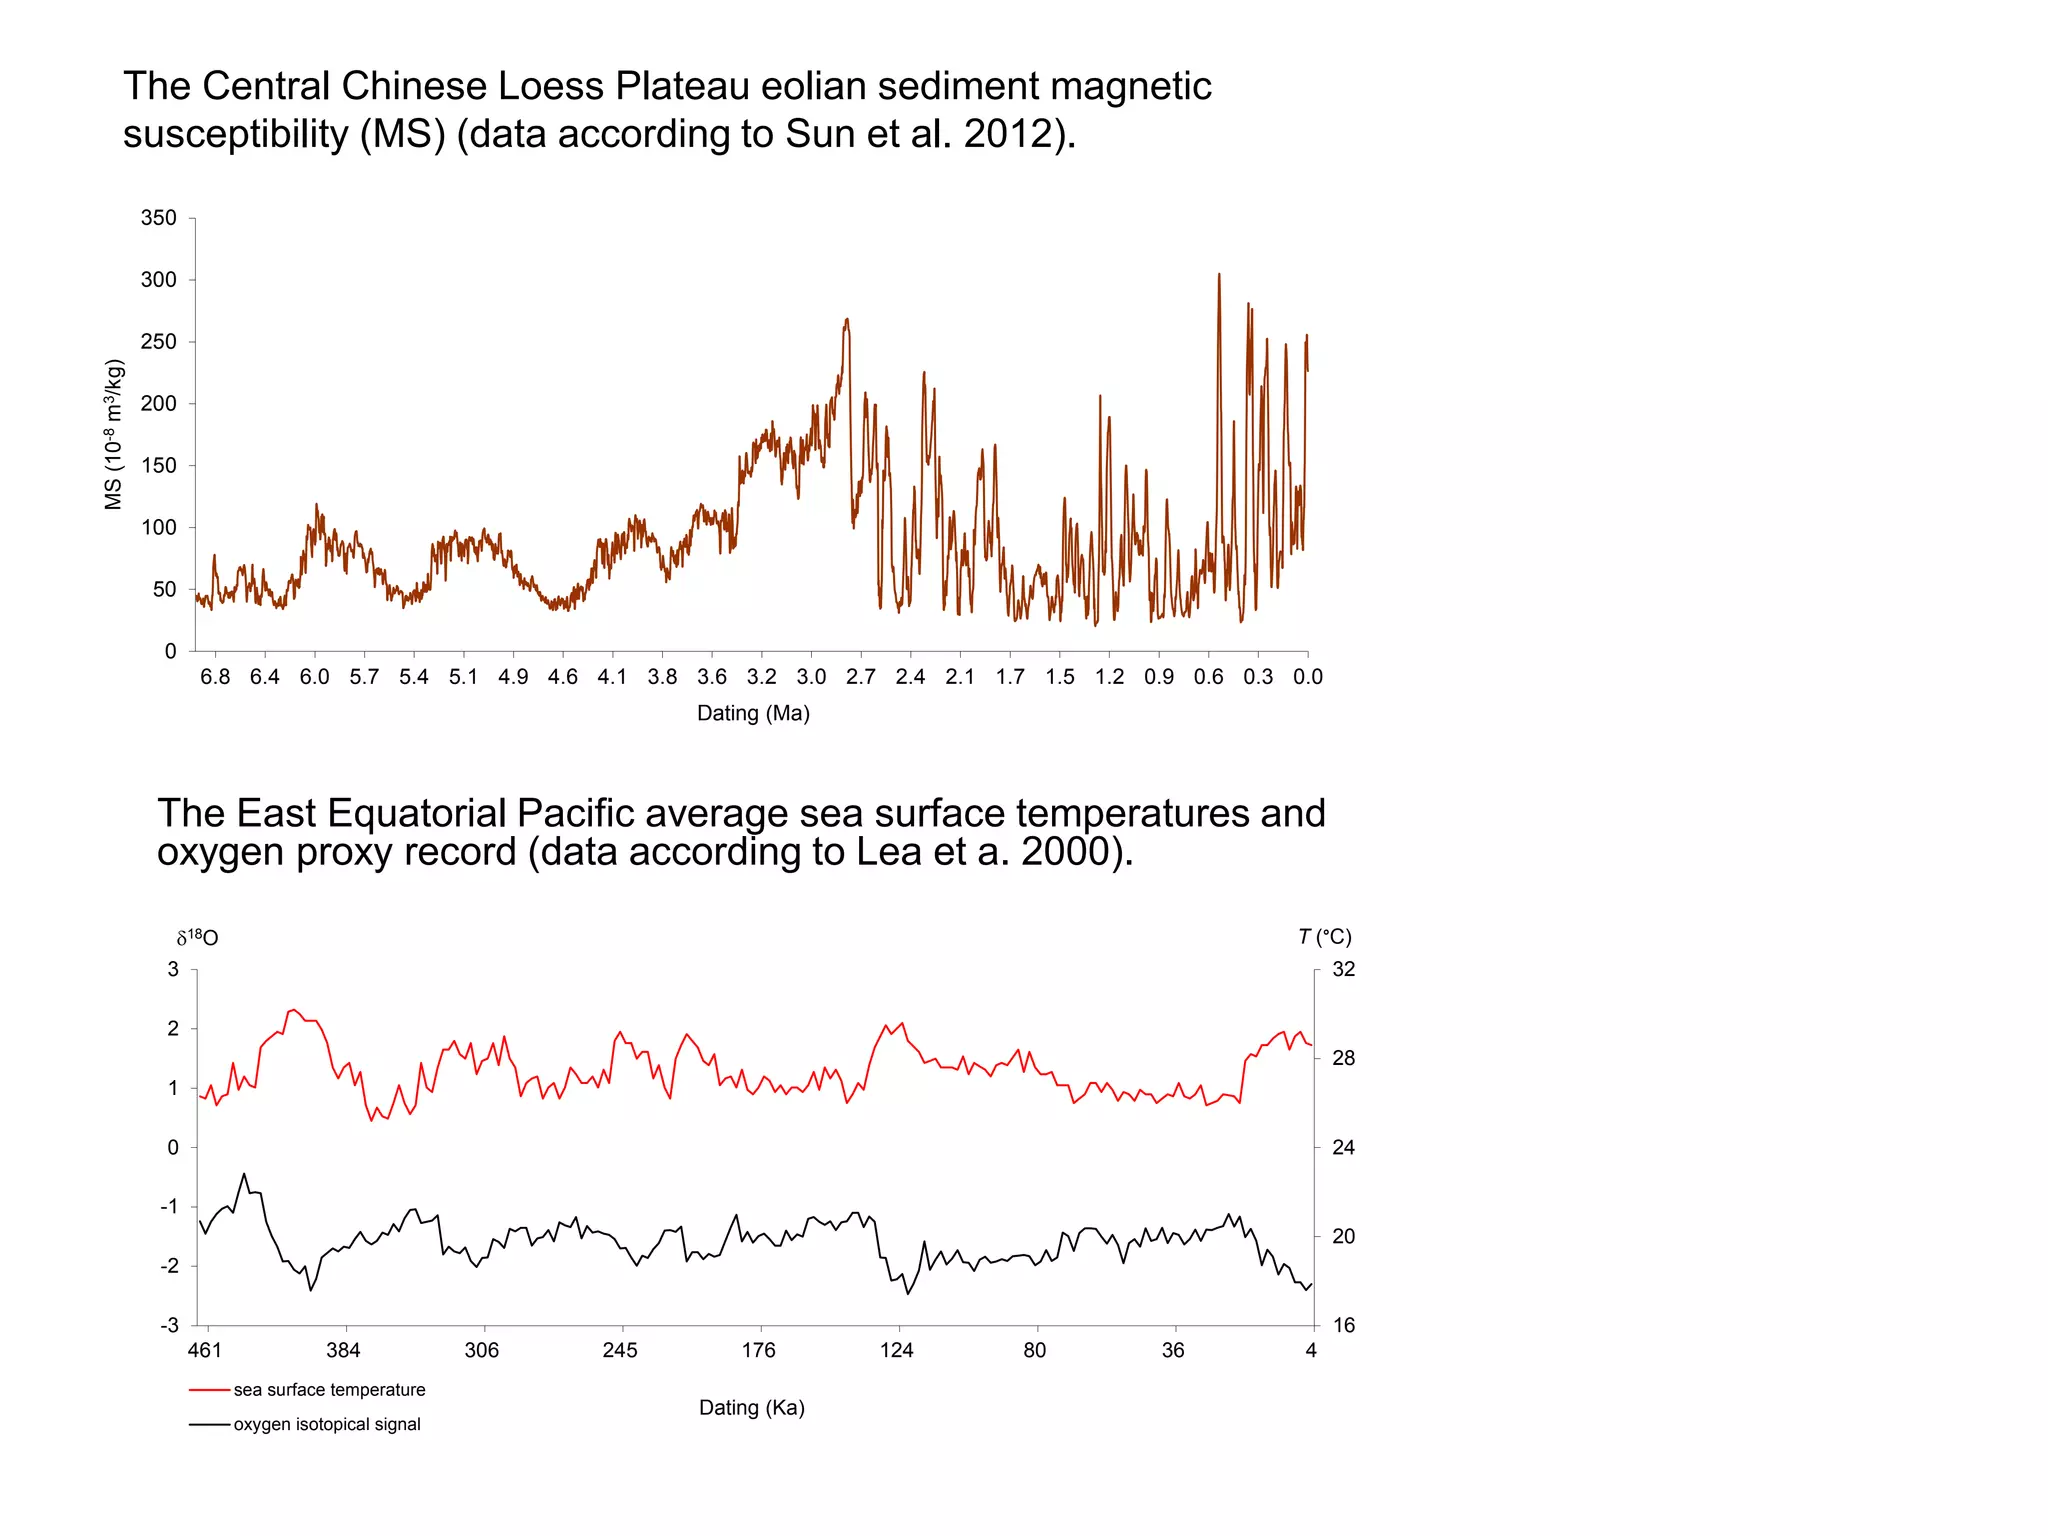
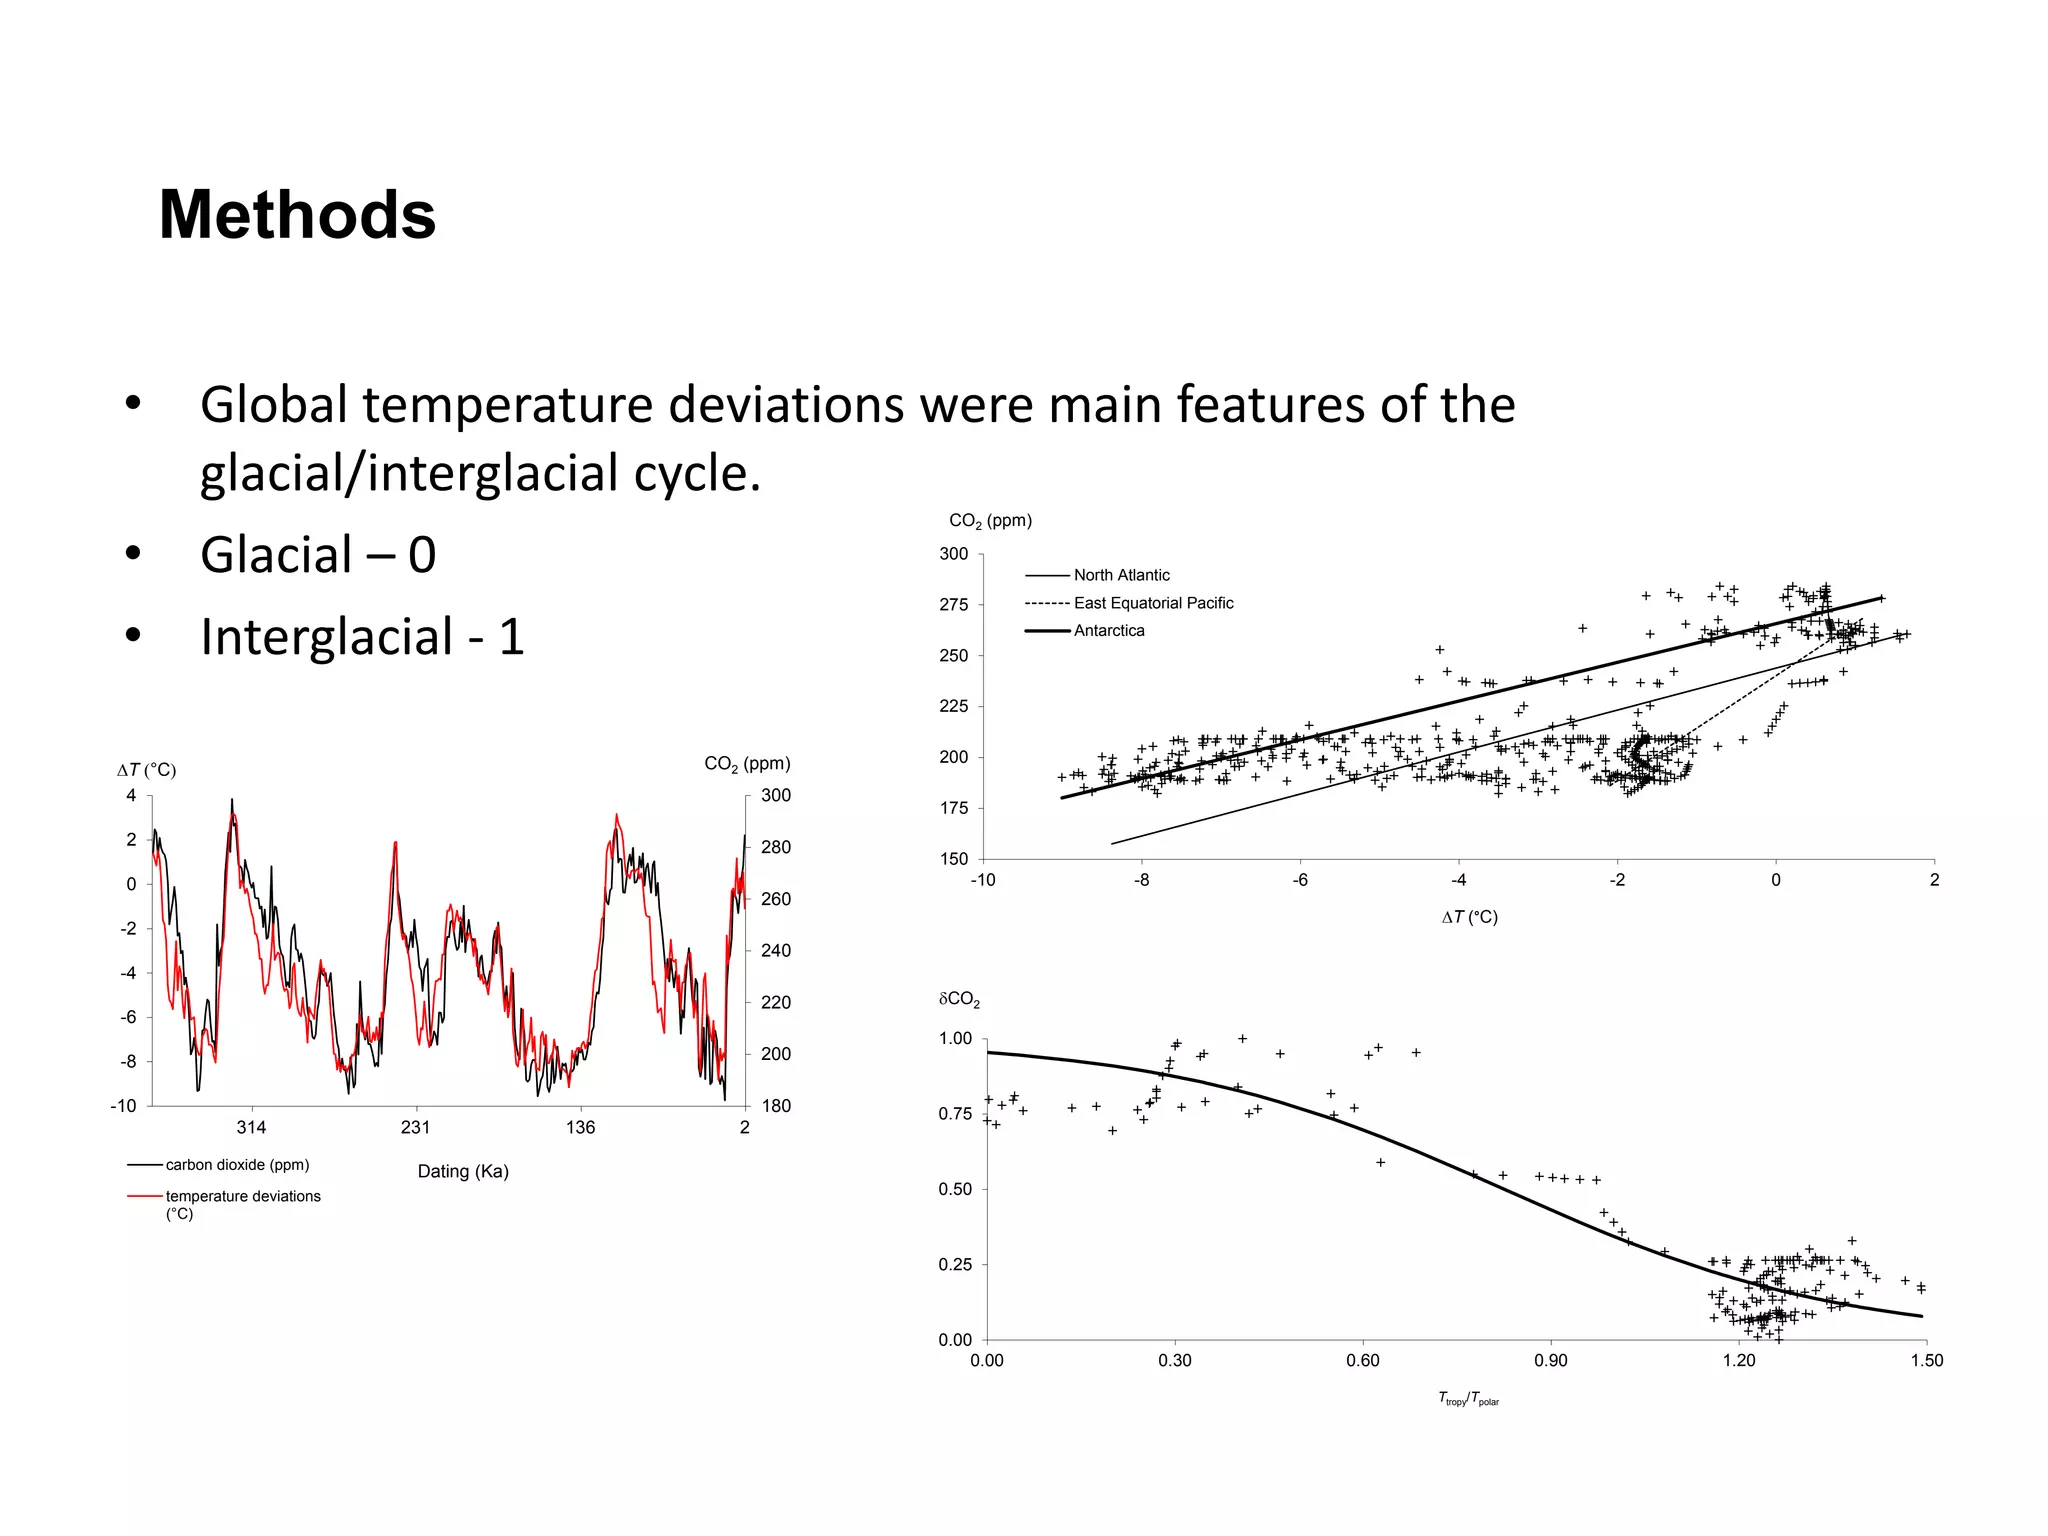
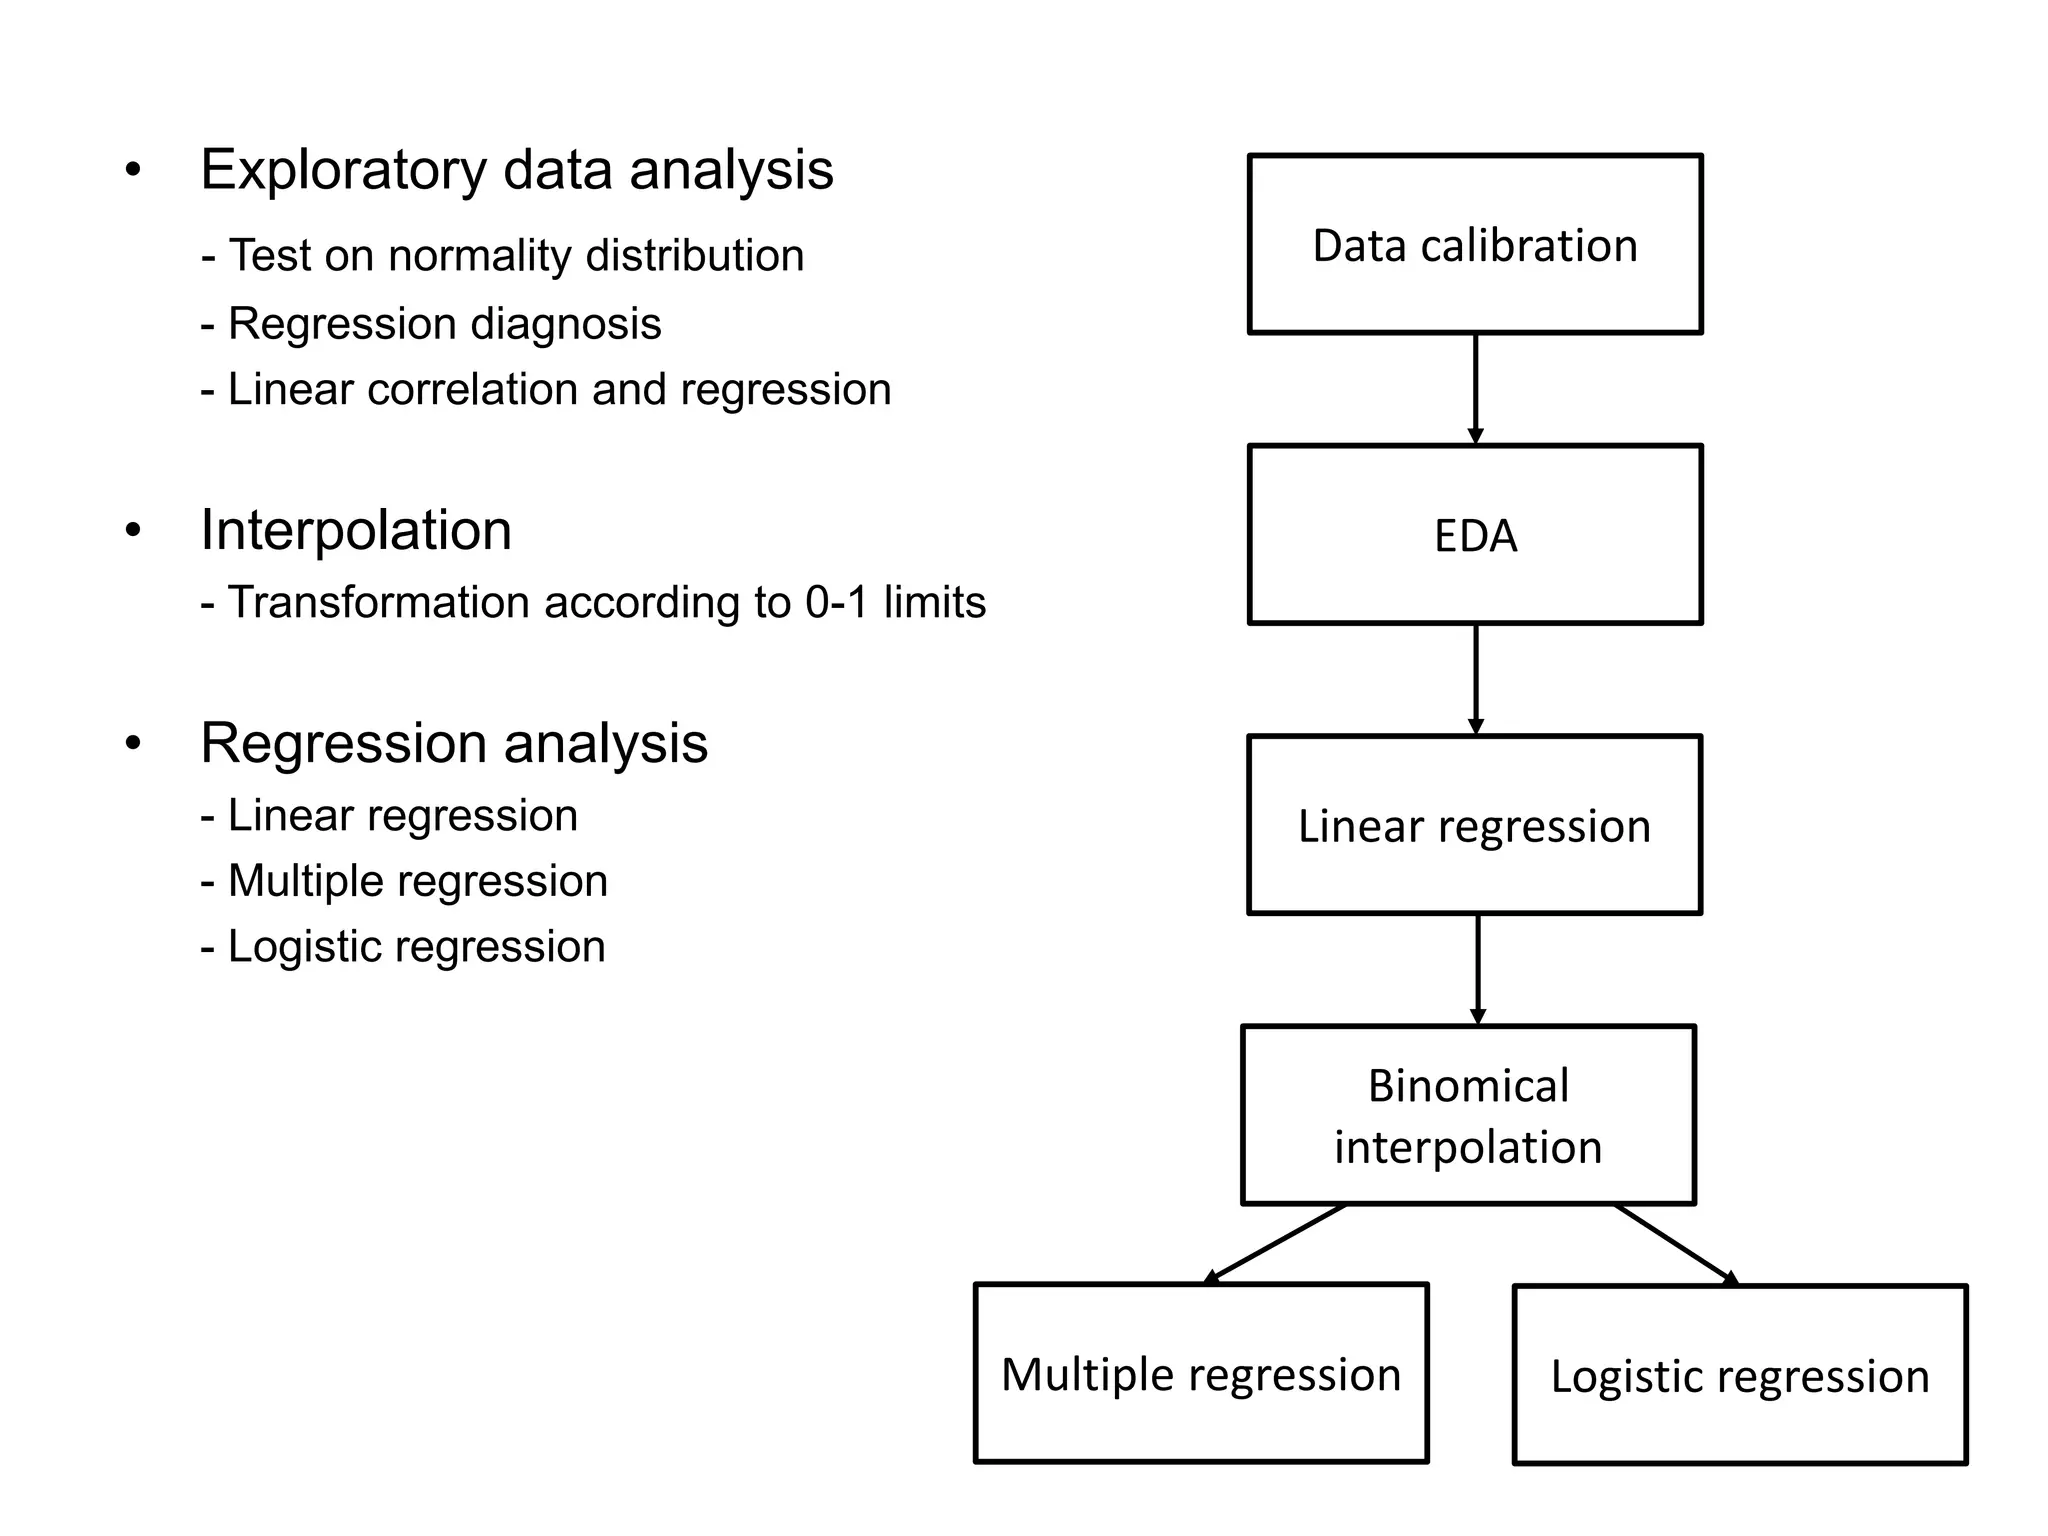
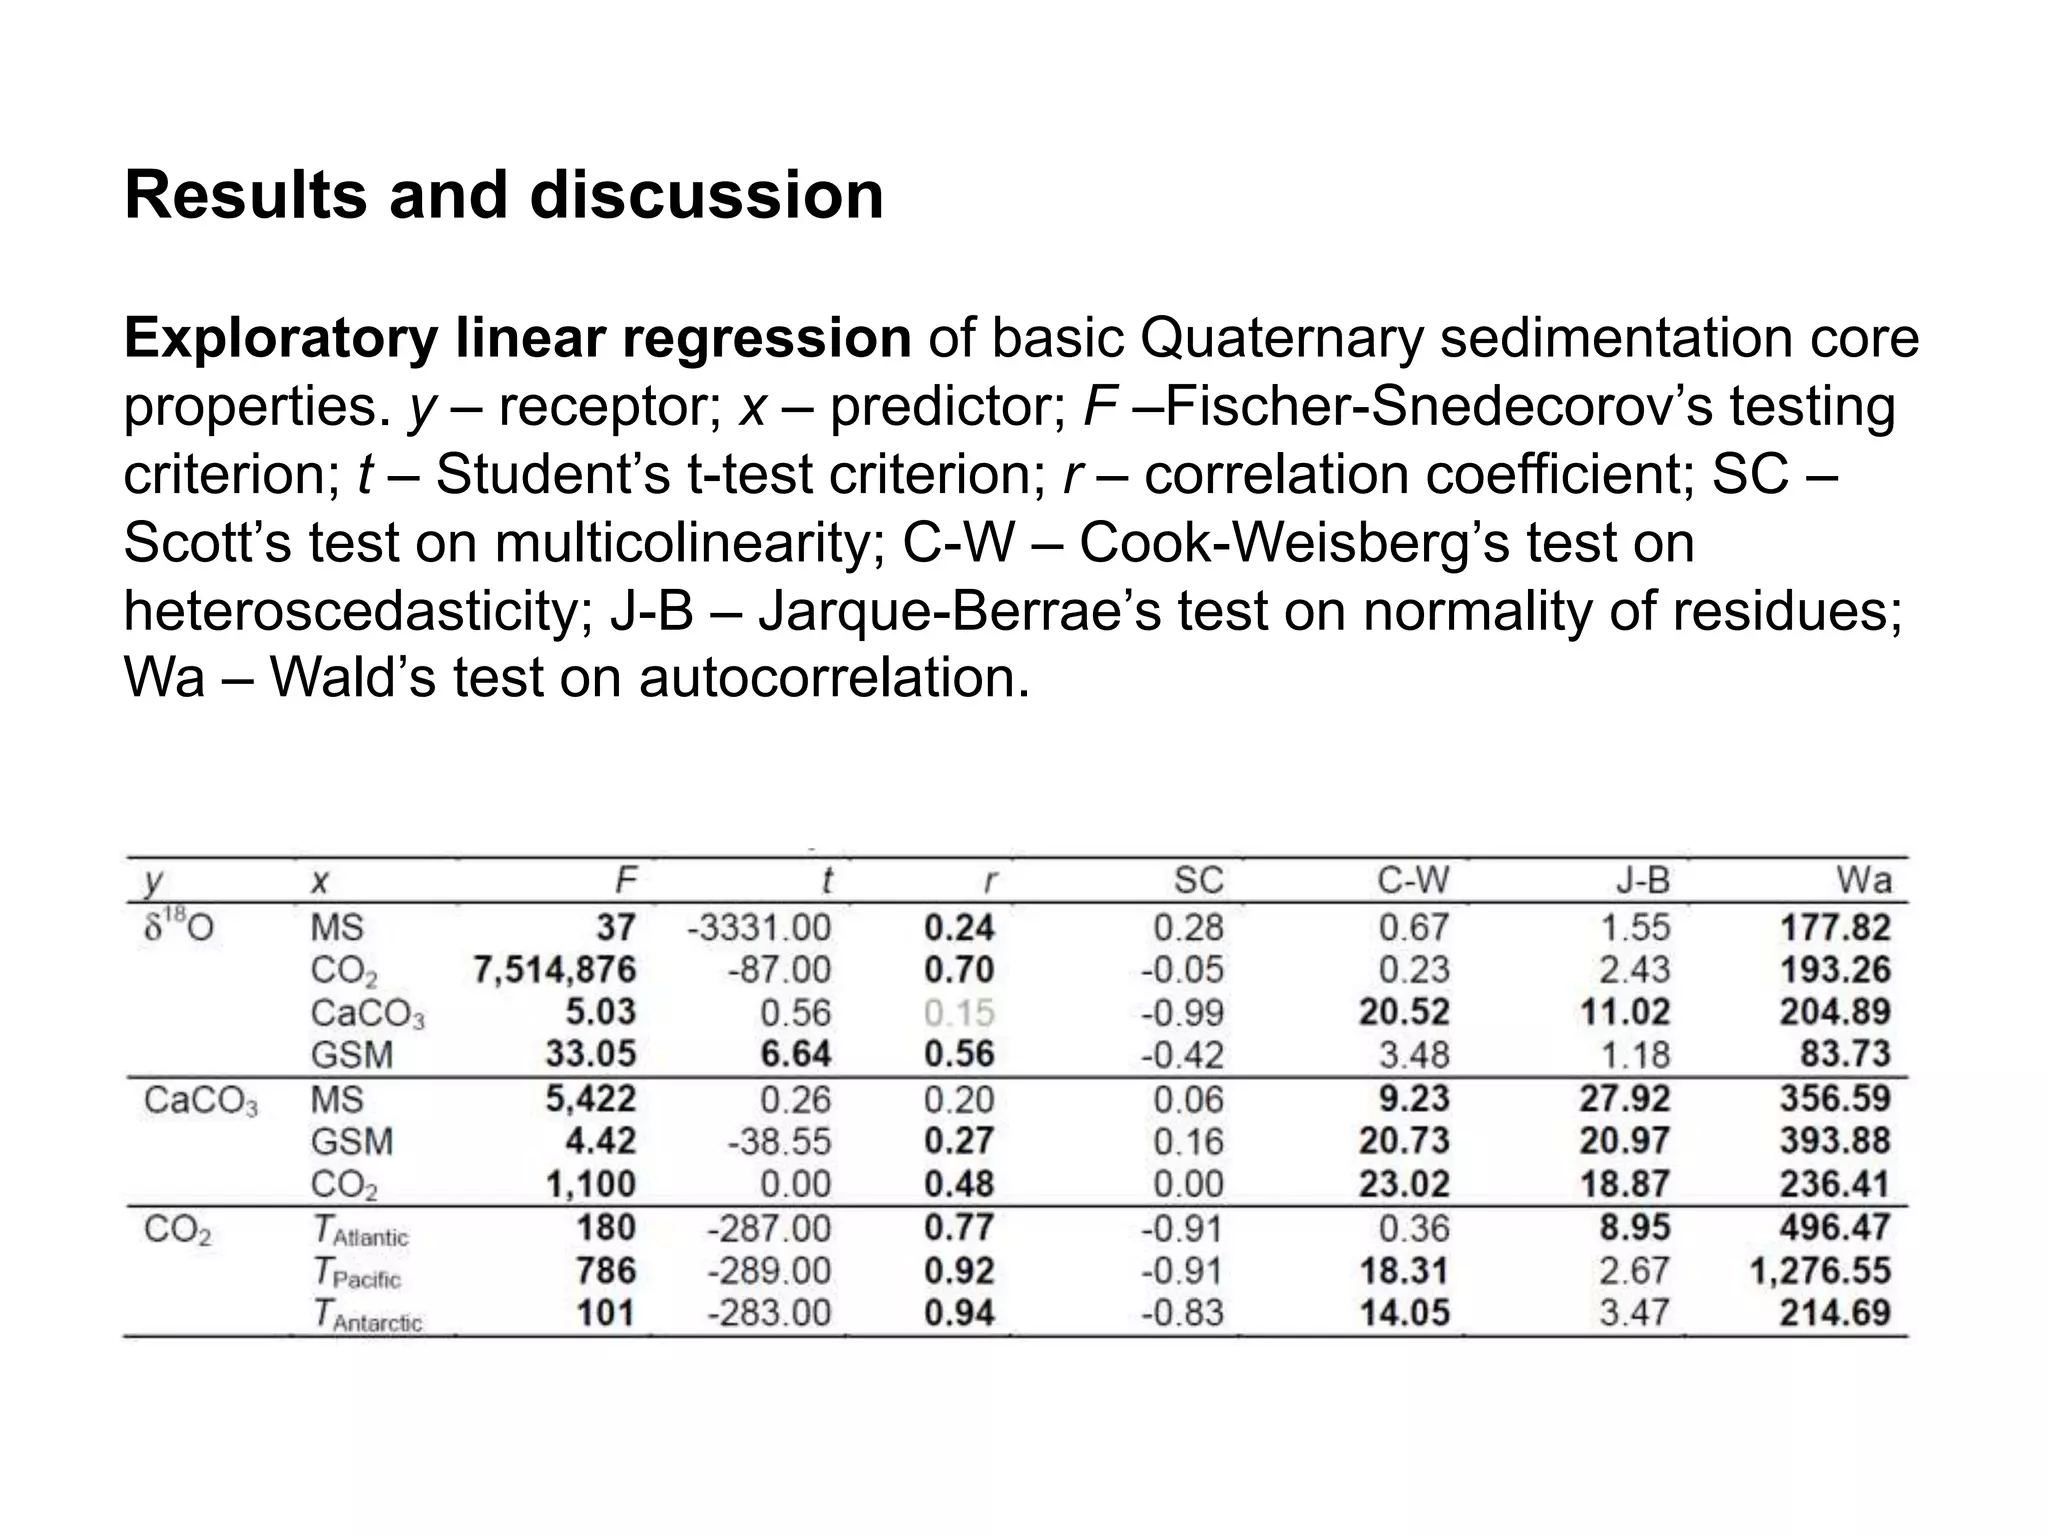
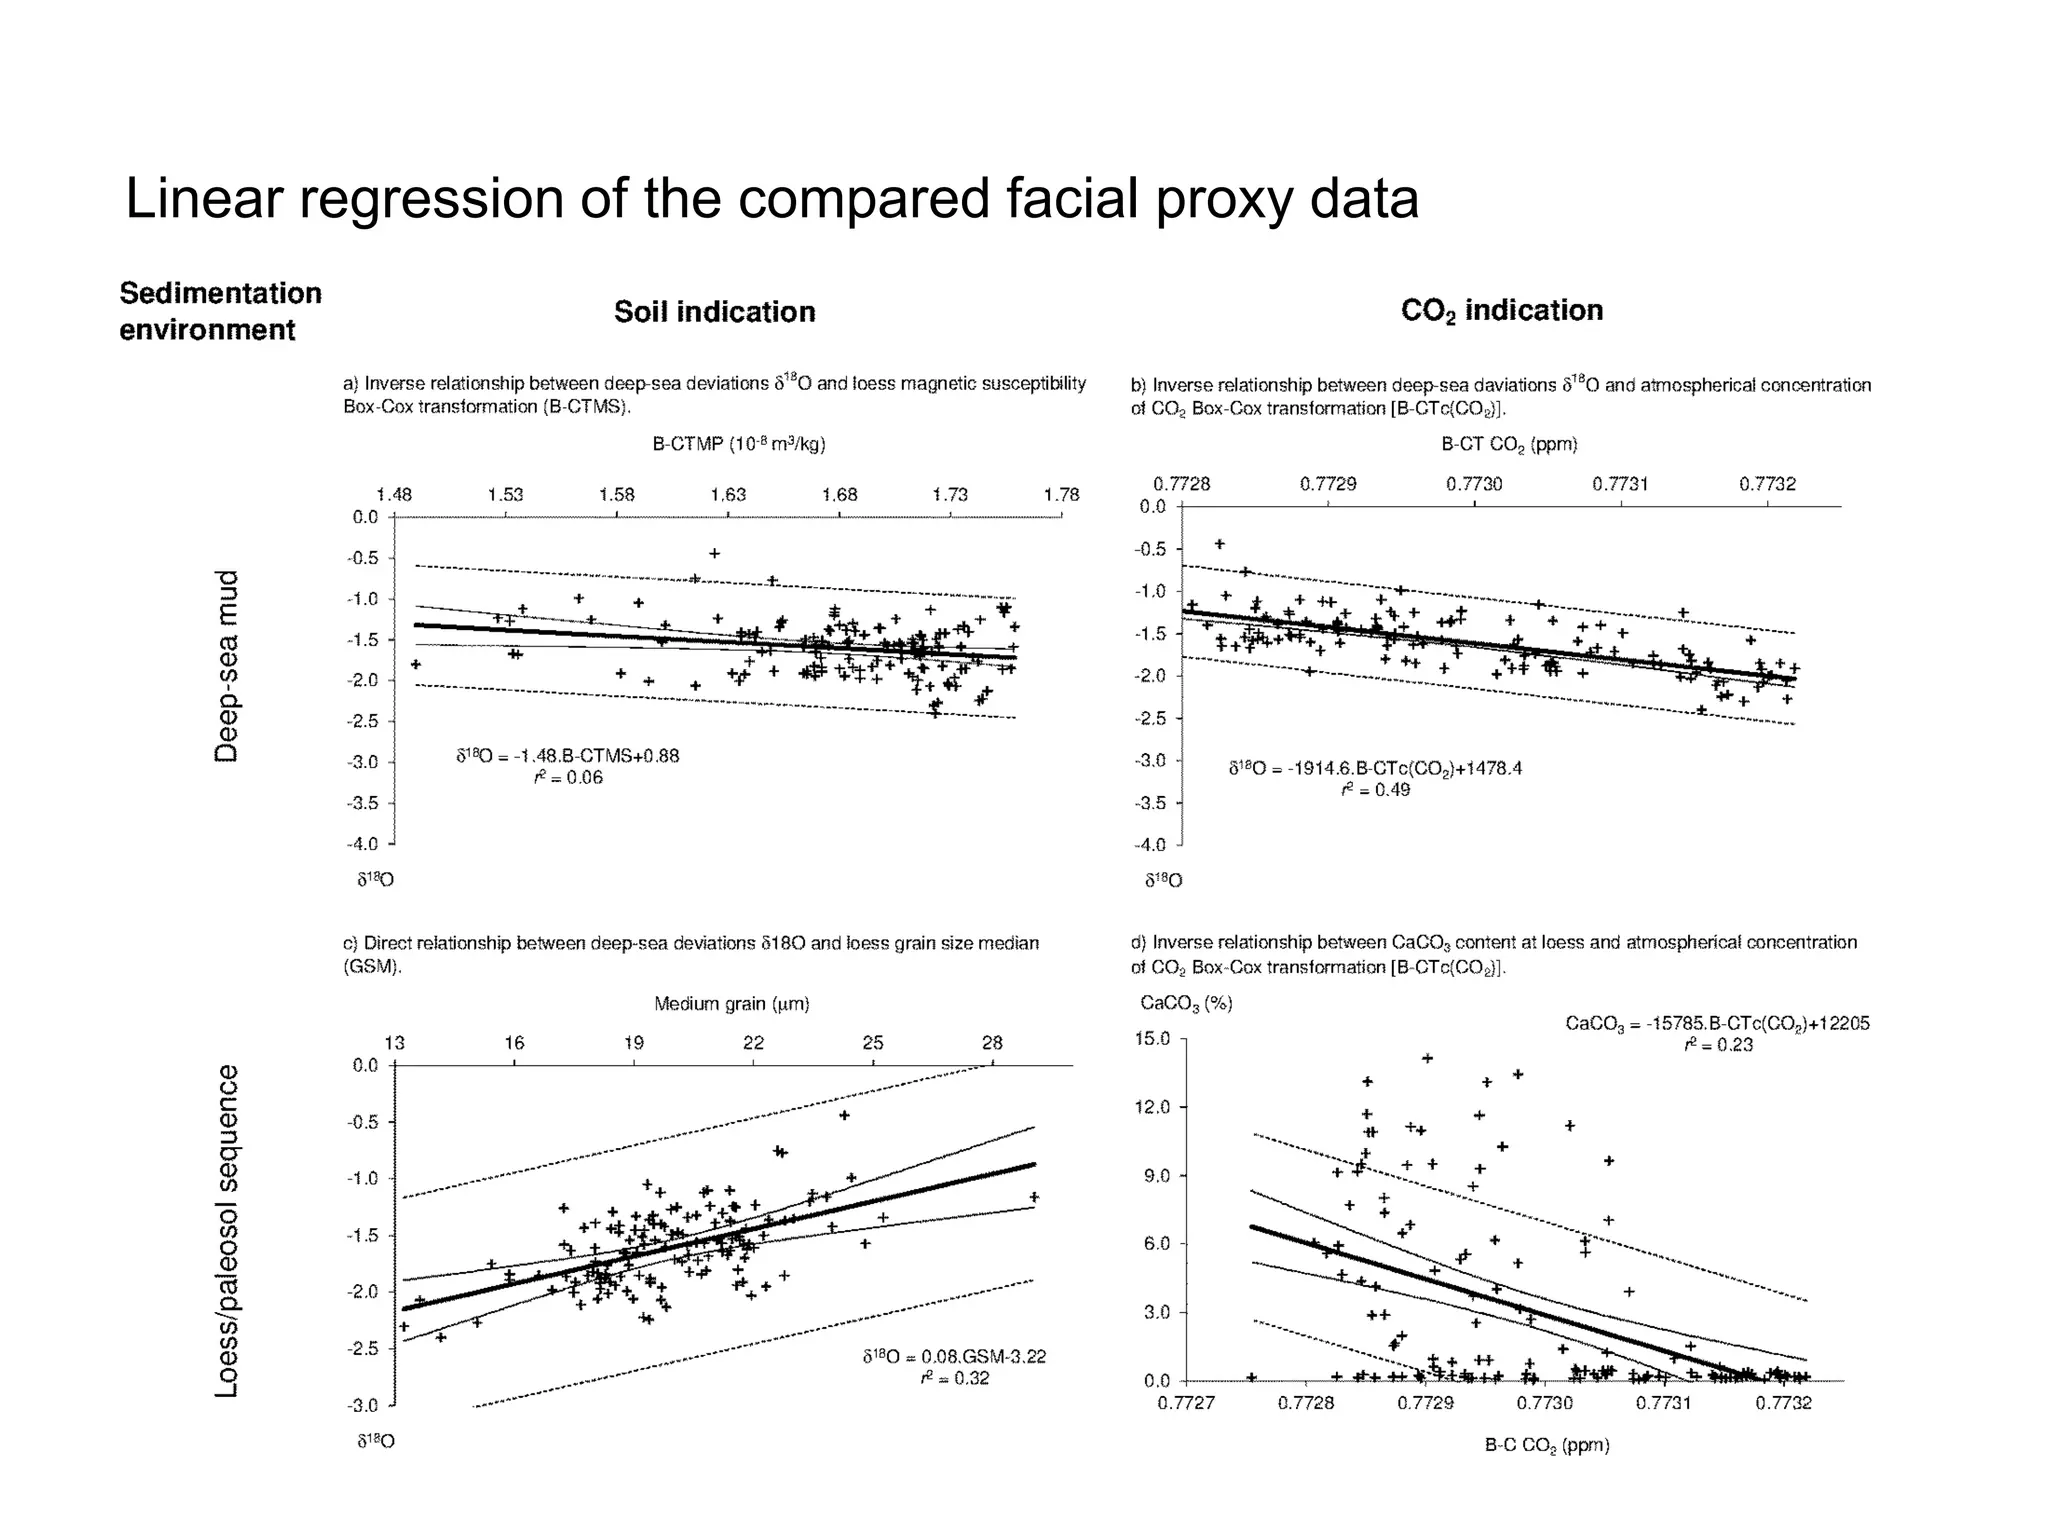
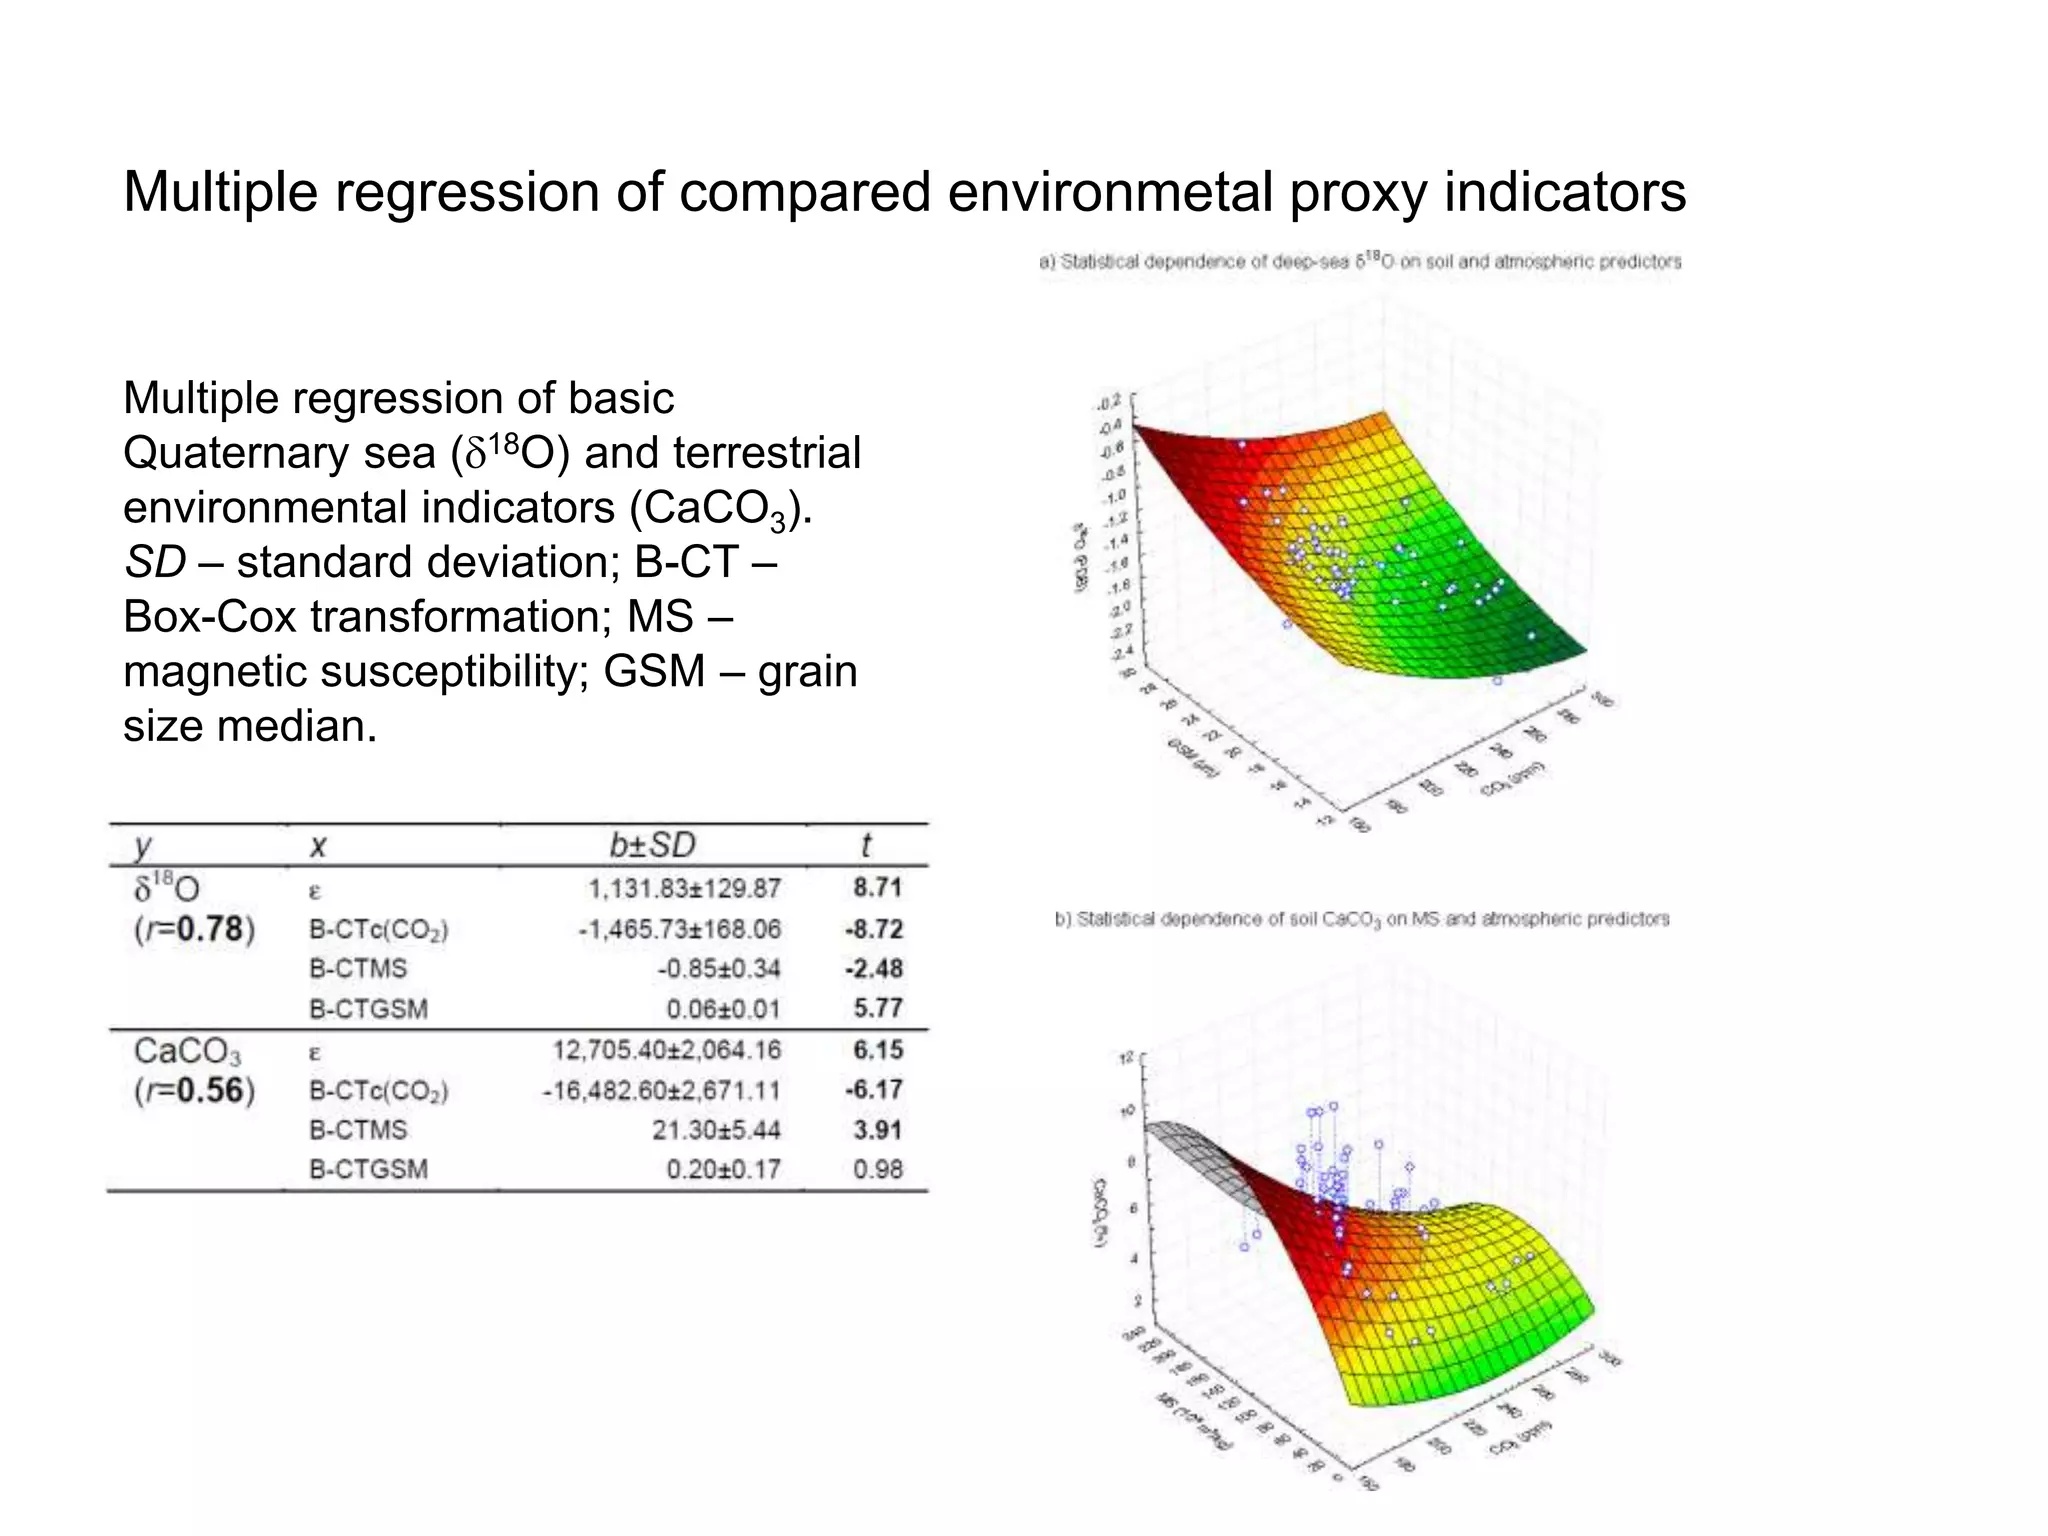
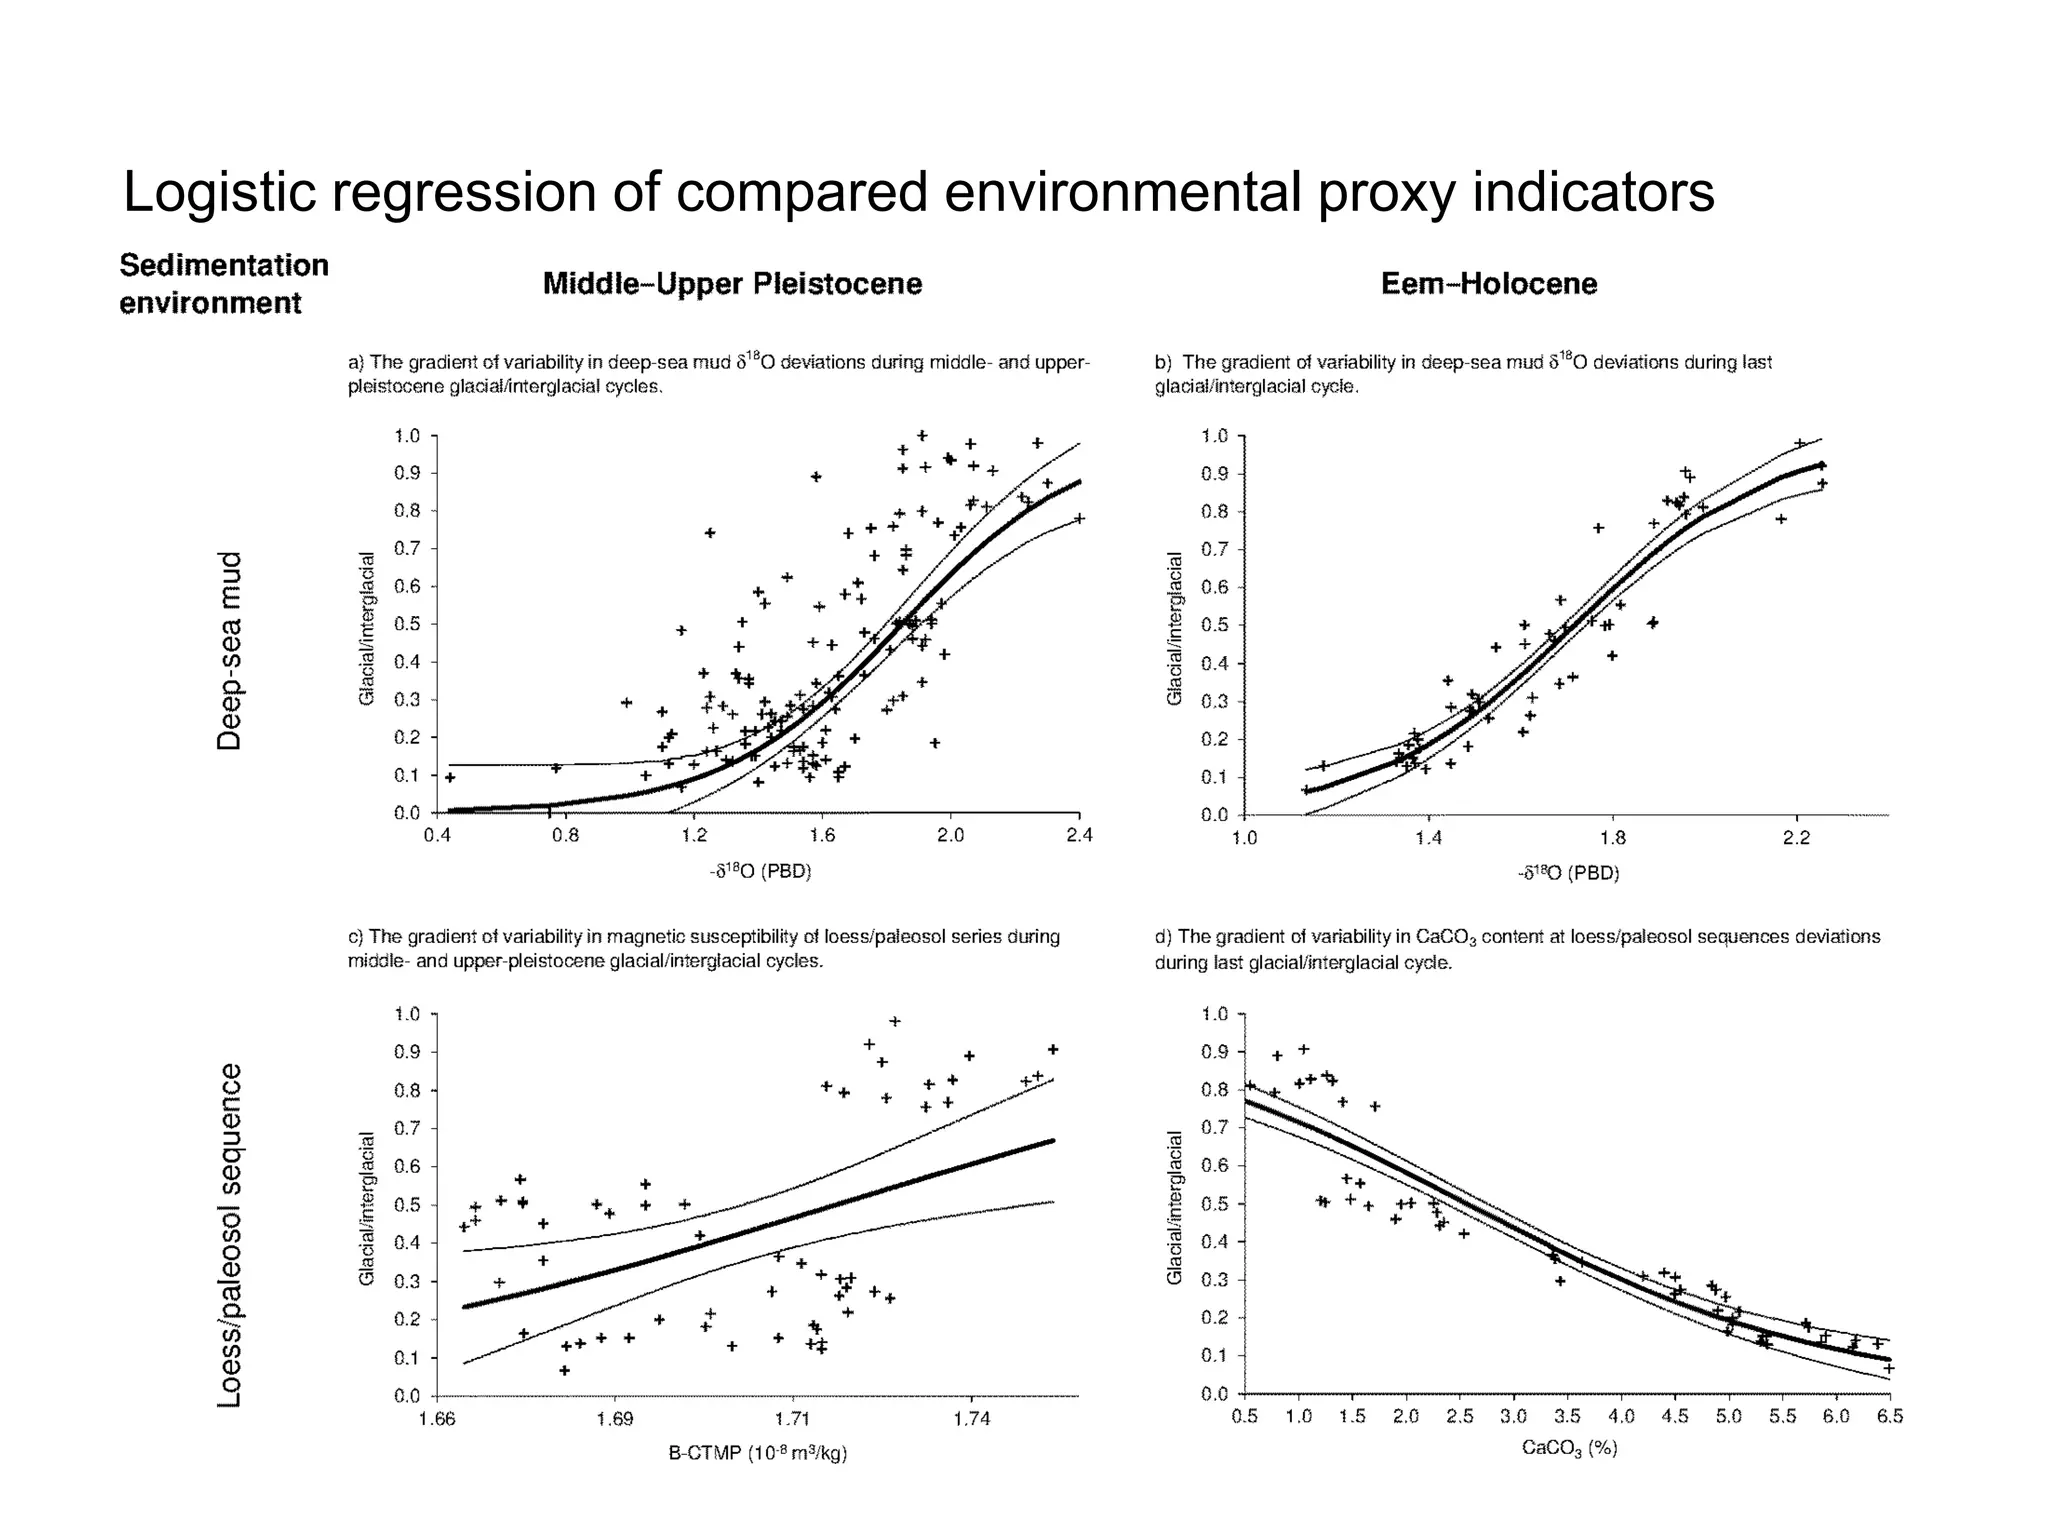
Regression analysis of 
relations among 
Quaternary environmental 
change indicators 
Pavel Samec
Content 
• Introduction 
- Glacial/interglacial cycles 
- The polyglacism theory 
• Material 
- Loess/paleosol proxy series 
- Deep-sea mud proxy series 
- Ice core proxy series 
• Methods 
- Exploratory data analysis 
- Interpolation 
- Multiple regression 
- Logistic regression 
• Results and Discussion 
• Summary 
• References
Introduction 
The Quaternary is a period when the geological presence has developed. 
The Quaternary Period is characterized by regular alternation of major 
environmental changes with the intensity of glacial/interglacial. 
• The glacial is an event of glaciations characterized by expansion of continental and 
mountain glaciers, global marine regression, global reduction of vegetation biomass and 
expansion of terrestrial sedimentary environments. 
• The interglacial is an event of interglaciations characterized by minimal glaciations, global 
marine transgression, global growth of vegetation biomass and an intensive soil 
formation ont the most of land. 
The polyglacism theory deals with common variability of marine and 
terrestrial sedimentation features in relation to the variability of the 
external physical environment that indicate the global impacts of multiple 
oscillations glacial/interglacial. 
The aim of the study was using of the logistic regression for better 
description of assumed polyglacial relationships.
Material 
• Data 
- Loess/paleosol series (Chinese Loess Plateau; 6.9-0 Ma; Sun et al. 2012) 
- Deep sea d18O (East Pacific; 470-4 Ka; Lea et al. 2000) 
- Ice core (East Antarctica; 803-2 Ka; Barnola et al. 1999; Petit et al. 2000) 
• Analysed periods 
- Middle-Upper Pleistocene (470-12 Ka) 
- Upper Pleistocene – Holocene (126-1 Ka)
The Central Chinese Loess Plateau eolian sediment magnetic 
susceptibility (MS) (data according to Sun et al. 2012). 
350 
300 
250 
200 
150 
100 
50 
0 
6.8 6.4 6.0 5.7 5.4 5.1 4.9 4.6 4.1 3.8 3.6 3.2 3.0 2.7 2.4 2.1 1.7 1.5 1.2 0.9 0.6 0.3 0.0 
MS (10-8 m3/kg) 
Dating (Ma) 
The East Equatorial Pacific average sea surface temperatures and 
oxygen proxy record (data according to Lea et a. 2000). 
d18O T (°C) 
3 
2 
1 
0 
-1 
-2 
-3 
32 
28 
24 
20 
16 
461 384 306 245 176 124 80 36 4 
Dating (Ka) 
sea surface temperature 
oxygen isotopical signal
Methods 
• Global temperature deviations were main features of the 
glacial/interglacial cycle. 
• Glacial – 0 
• Interglacial - 1 
DT (°C) CO2 (ppm) 
4 
2 
0 
-2 
-4 
-6 
-8 
-10 
300 
280 
260 
240 
220 
200 
180 
314 231 136 2 
carbon dioxide (ppm) Dating (Ka) 
temperature deviations 
(°C) 
CO2 (ppm) 
300 
275 
250 
225 
200 
175 
150 
-10 -8 -6 -4 -2 0 2 
DT (°C) 
North Atlantic 
East Equatorial Pacific 
Antarctica 
dCO2 
1.00 
0.75 
0.50 
0.25 
0.00 
0.00 0.30 0.60 0.90 1.20 1.50 
Ttropy/Tpolar
• Exploratory data analysis 
- Test on normality distribution 
- Regression diagnosis 
- Linear correlation and regression 
• Interpolation 
- Transformation according to 0-1 limits 
• Regression analysis 
- Linear regression 
- Multiple regression 
- Logistic regression 
Data calibration 
EDA 
Linear regression 
Binomical 
interpolation 
Multiple regression Logistic regression
Results and discussion 
Exploratory linear regression of basic Quaternary sedimentation core 
properties. y – receptor; x – predictor; F –Fischer-Snedecorov’s testing 
criterion; t – Student’s t-test criterion; r ‒ correlation coefficient; SC – 
Scott’s test on multicolinearity; C-W – Cook-Weisberg’s test on 
heteroscedasticity; J-B – Jarque-Berrae’s test on normality of residues; 
Wa – Wald’s test on autocorrelation.
Linear regression of the compared facial proxy data
Multiple regression of compared environmetal proxy indicators 
Multiple regression of basic 
Quaternary sea (d18O) and terrestrial 
environmental indicators (CaCO3). 
SD – standard deviation; B-CT – 
Box-Cox transformation; MS – 
magnetic susceptibility; GSM – grain 
size median.
Logistic regression of compared environmental proxy indicators
Summary 
• Changes in the basic soil properties of a loess/paleosol sequences reliably 
do not indicate changes in the intensity of glacial/interglacial cycles 
between the Middle and Upper Pleistocene. 
• Changes in the basic soil properties of a loess/paleosol sequences have 
been reflecting climatic changes statistically more significantly than the 
deep-sea sedimentation since the Upper Pleistocene (cycle eem‒visla) . 
• Correlations of atmospheric CO2 and surface temperatures are greater 
than correlation of other polyglacial phenomenas. 
• Linear regression revealed on the assumption that the dependences of soil 
properties were smaller than polyglacial relations of other environmental 
indicators. 
• Logistic regression suggested that temporal variability in feedbacks 
between climatic change predictors and properties of forming sediments 
may be cause of the lack of a simple Quaternary climatic change 
indication.
References 
• BARNOLA J.M. et al. (1999): Historical CO2 record from the Vostok ice core. In: 
Trends: A Compendium of Data on Global Change. U. S. Department of Energy Oak 
Ridge. 
• HEIKKINEN R.K. et al. (2006): Methods and uncertainties in bioclimatic envelope 
modelling under climate change. Progress in Physical Geography 30: 6751‒6777. 
• KUKLA J. (1978): The Classical European Glacial Stages: Correlation with deep-sea 
sediments. Transactions of the Nebraska Academy of Science 6: 57–93. 
• KUKLA G., CÍLEK V. (1996): Plio-Pleistocene megacycles: record of climate and 
tectonics. Palaeogeography, Palaeoclimatology, Palaeoecology 120: 171‒194. 
• LEA D.W. et al. (2000): Climate impact of late Quaternary equatorial Pacific sea 
surface temperature variations. Science 289: 1719–1724. 
• OSBORN J. W. (2010): Improving your data transformation: Applying the Box-Cox 
transformation. Practical Assessment, Research & Evaluation 15: 2‒9. 
• PETIT J.R. (1999): Climate and atmospheric history of the past 420,000 years from 
the Vostok ice core, Antarctica. Nature 399: 429–436. 
• SUN Y. (2012): Seven million years of wind and precipitation variability on the 
Chinese Loess Plateau. Earth and Planetary Science Letters 297: 525–535.

Samec - Regression analysis of relations among main Quaternary environmental changes indicators

  • 1.
    Regression analysis of relations among Quaternary environmental change indicators Pavel Samec
  • 2.
    Content • Introduction - Glacial/interglacial cycles - The polyglacism theory • Material - Loess/paleosol proxy series - Deep-sea mud proxy series - Ice core proxy series • Methods - Exploratory data analysis - Interpolation - Multiple regression - Logistic regression • Results and Discussion • Summary • References
  • 3.
    Introduction The Quaternaryis a period when the geological presence has developed. The Quaternary Period is characterized by regular alternation of major environmental changes with the intensity of glacial/interglacial. • The glacial is an event of glaciations characterized by expansion of continental and mountain glaciers, global marine regression, global reduction of vegetation biomass and expansion of terrestrial sedimentary environments. • The interglacial is an event of interglaciations characterized by minimal glaciations, global marine transgression, global growth of vegetation biomass and an intensive soil formation ont the most of land. The polyglacism theory deals with common variability of marine and terrestrial sedimentation features in relation to the variability of the external physical environment that indicate the global impacts of multiple oscillations glacial/interglacial. The aim of the study was using of the logistic regression for better description of assumed polyglacial relationships.
  • 4.
    Material • Data - Loess/paleosol series (Chinese Loess Plateau; 6.9-0 Ma; Sun et al. 2012) - Deep sea d18O (East Pacific; 470-4 Ka; Lea et al. 2000) - Ice core (East Antarctica; 803-2 Ka; Barnola et al. 1999; Petit et al. 2000) • Analysed periods - Middle-Upper Pleistocene (470-12 Ka) - Upper Pleistocene – Holocene (126-1 Ka)
  • 5.
    The Central ChineseLoess Plateau eolian sediment magnetic susceptibility (MS) (data according to Sun et al. 2012). 350 300 250 200 150 100 50 0 6.8 6.4 6.0 5.7 5.4 5.1 4.9 4.6 4.1 3.8 3.6 3.2 3.0 2.7 2.4 2.1 1.7 1.5 1.2 0.9 0.6 0.3 0.0 MS (10-8 m3/kg) Dating (Ma) The East Equatorial Pacific average sea surface temperatures and oxygen proxy record (data according to Lea et a. 2000). d18O T (°C) 3 2 1 0 -1 -2 -3 32 28 24 20 16 461 384 306 245 176 124 80 36 4 Dating (Ka) sea surface temperature oxygen isotopical signal
  • 6.
    Methods • Globaltemperature deviations were main features of the glacial/interglacial cycle. • Glacial – 0 • Interglacial - 1 DT (°C) CO2 (ppm) 4 2 0 -2 -4 -6 -8 -10 300 280 260 240 220 200 180 314 231 136 2 carbon dioxide (ppm) Dating (Ka) temperature deviations (°C) CO2 (ppm) 300 275 250 225 200 175 150 -10 -8 -6 -4 -2 0 2 DT (°C) North Atlantic East Equatorial Pacific Antarctica dCO2 1.00 0.75 0.50 0.25 0.00 0.00 0.30 0.60 0.90 1.20 1.50 Ttropy/Tpolar
  • 7.
    • Exploratory dataanalysis - Test on normality distribution - Regression diagnosis - Linear correlation and regression • Interpolation - Transformation according to 0-1 limits • Regression analysis - Linear regression - Multiple regression - Logistic regression Data calibration EDA Linear regression Binomical interpolation Multiple regression Logistic regression
  • 8.
    Results and discussion Exploratory linear regression of basic Quaternary sedimentation core properties. y – receptor; x – predictor; F –Fischer-Snedecorov’s testing criterion; t – Student’s t-test criterion; r ‒ correlation coefficient; SC – Scott’s test on multicolinearity; C-W – Cook-Weisberg’s test on heteroscedasticity; J-B – Jarque-Berrae’s test on normality of residues; Wa – Wald’s test on autocorrelation.
  • 9.
    Linear regression ofthe compared facial proxy data
  • 10.
    Multiple regression ofcompared environmetal proxy indicators Multiple regression of basic Quaternary sea (d18O) and terrestrial environmental indicators (CaCO3). SD – standard deviation; B-CT – Box-Cox transformation; MS – magnetic susceptibility; GSM – grain size median.
  • 11.
    Logistic regression ofcompared environmental proxy indicators
  • 12.
    Summary • Changesin the basic soil properties of a loess/paleosol sequences reliably do not indicate changes in the intensity of glacial/interglacial cycles between the Middle and Upper Pleistocene. • Changes in the basic soil properties of a loess/paleosol sequences have been reflecting climatic changes statistically more significantly than the deep-sea sedimentation since the Upper Pleistocene (cycle eem‒visla) . • Correlations of atmospheric CO2 and surface temperatures are greater than correlation of other polyglacial phenomenas. • Linear regression revealed on the assumption that the dependences of soil properties were smaller than polyglacial relations of other environmental indicators. • Logistic regression suggested that temporal variability in feedbacks between climatic change predictors and properties of forming sediments may be cause of the lack of a simple Quaternary climatic change indication.
  • 13.
    References • BARNOLAJ.M. et al. (1999): Historical CO2 record from the Vostok ice core. In: Trends: A Compendium of Data on Global Change. U. S. Department of Energy Oak Ridge. • HEIKKINEN R.K. et al. (2006): Methods and uncertainties in bioclimatic envelope modelling under climate change. Progress in Physical Geography 30: 6751‒6777. • KUKLA J. (1978): The Classical European Glacial Stages: Correlation with deep-sea sediments. Transactions of the Nebraska Academy of Science 6: 57–93. • KUKLA G., CÍLEK V. (1996): Plio-Pleistocene megacycles: record of climate and tectonics. Palaeogeography, Palaeoclimatology, Palaeoecology 120: 171‒194. • LEA D.W. et al. (2000): Climate impact of late Quaternary equatorial Pacific sea surface temperature variations. Science 289: 1719–1724. • OSBORN J. W. (2010): Improving your data transformation: Applying the Box-Cox transformation. Practical Assessment, Research & Evaluation 15: 2‒9. • PETIT J.R. (1999): Climate and atmospheric history of the past 420,000 years from the Vostok ice core, Antarctica. Nature 399: 429–436. • SUN Y. (2012): Seven million years of wind and precipitation variability on the Chinese Loess Plateau. Earth and Planetary Science Letters 297: 525–535.