Download as PDF, PPTX
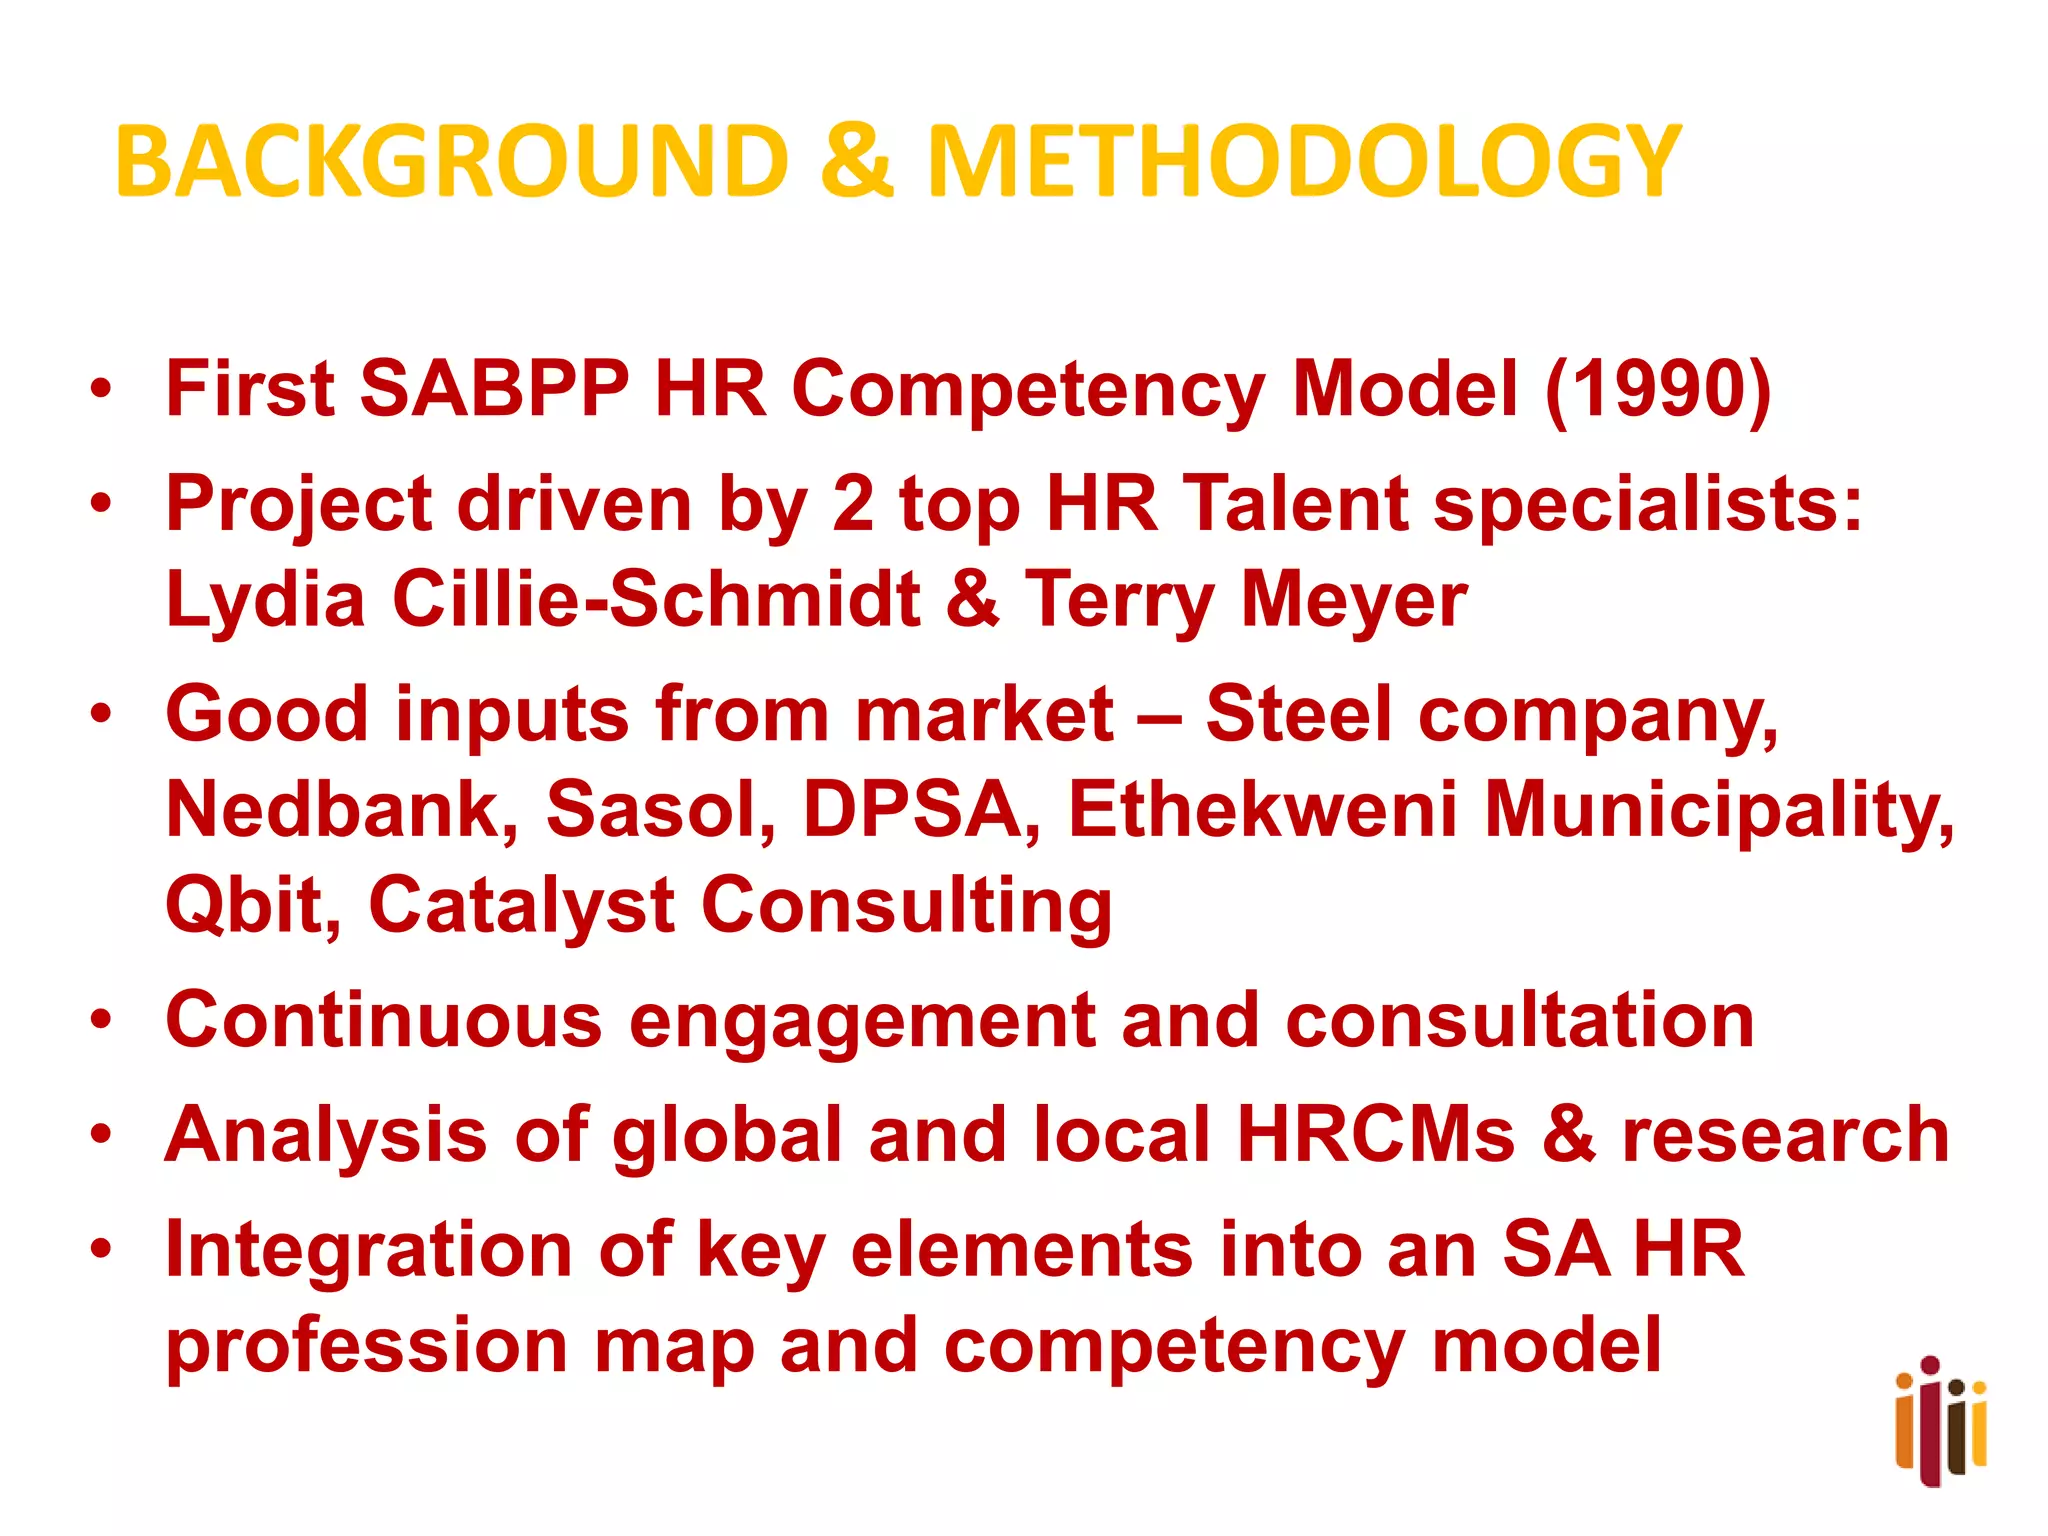
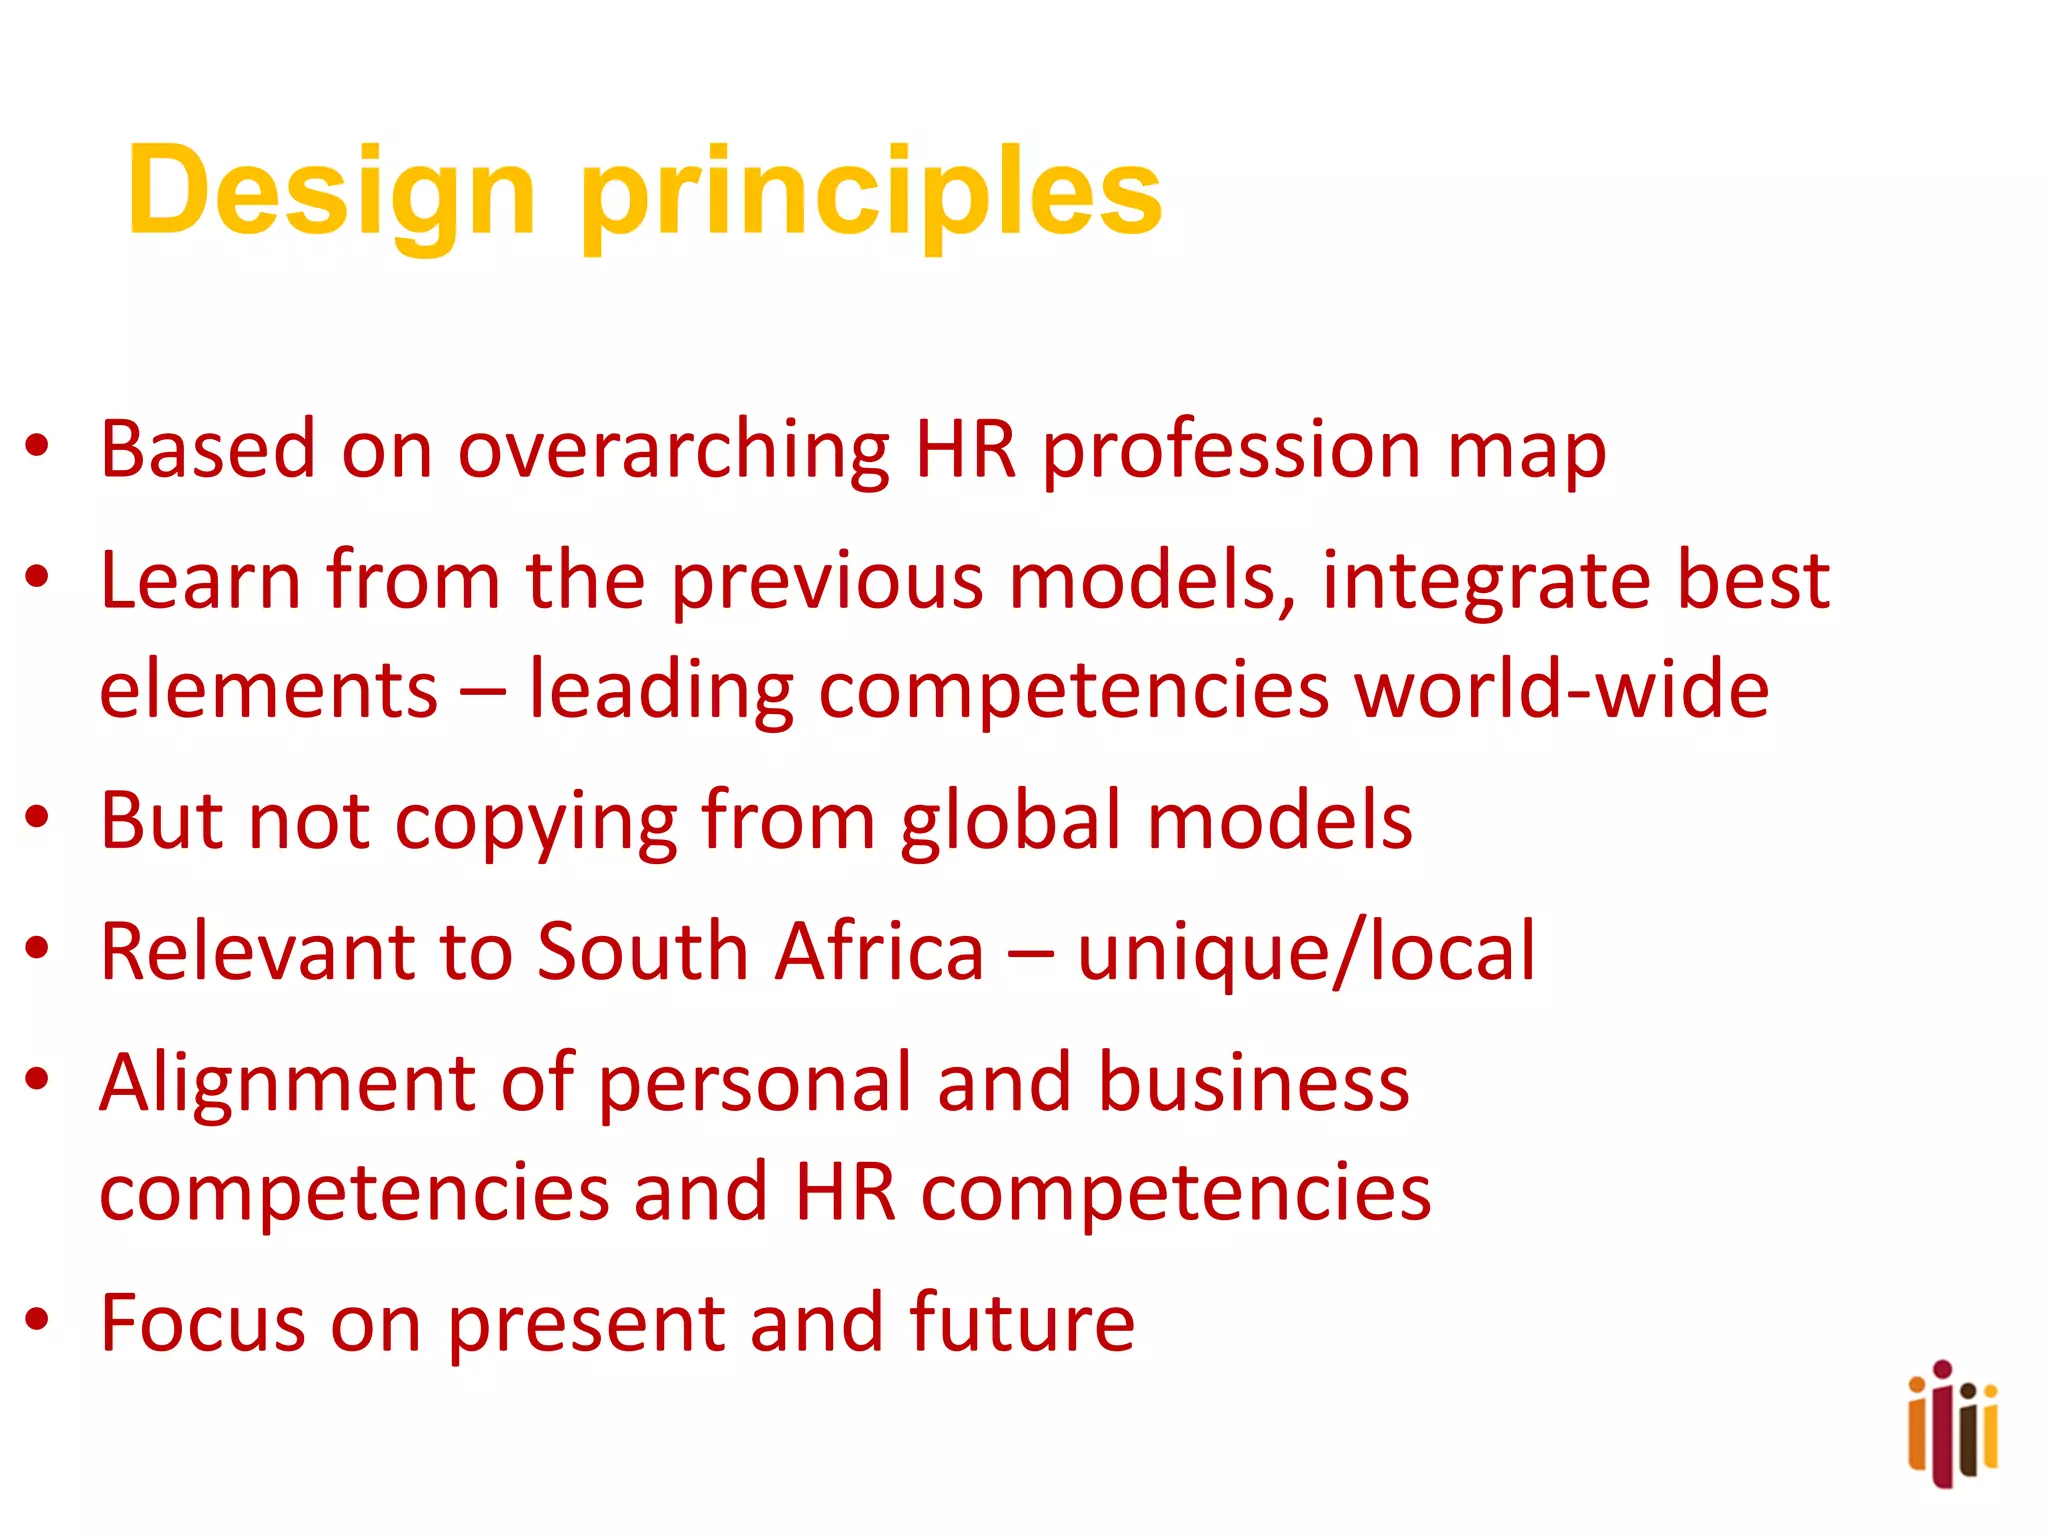
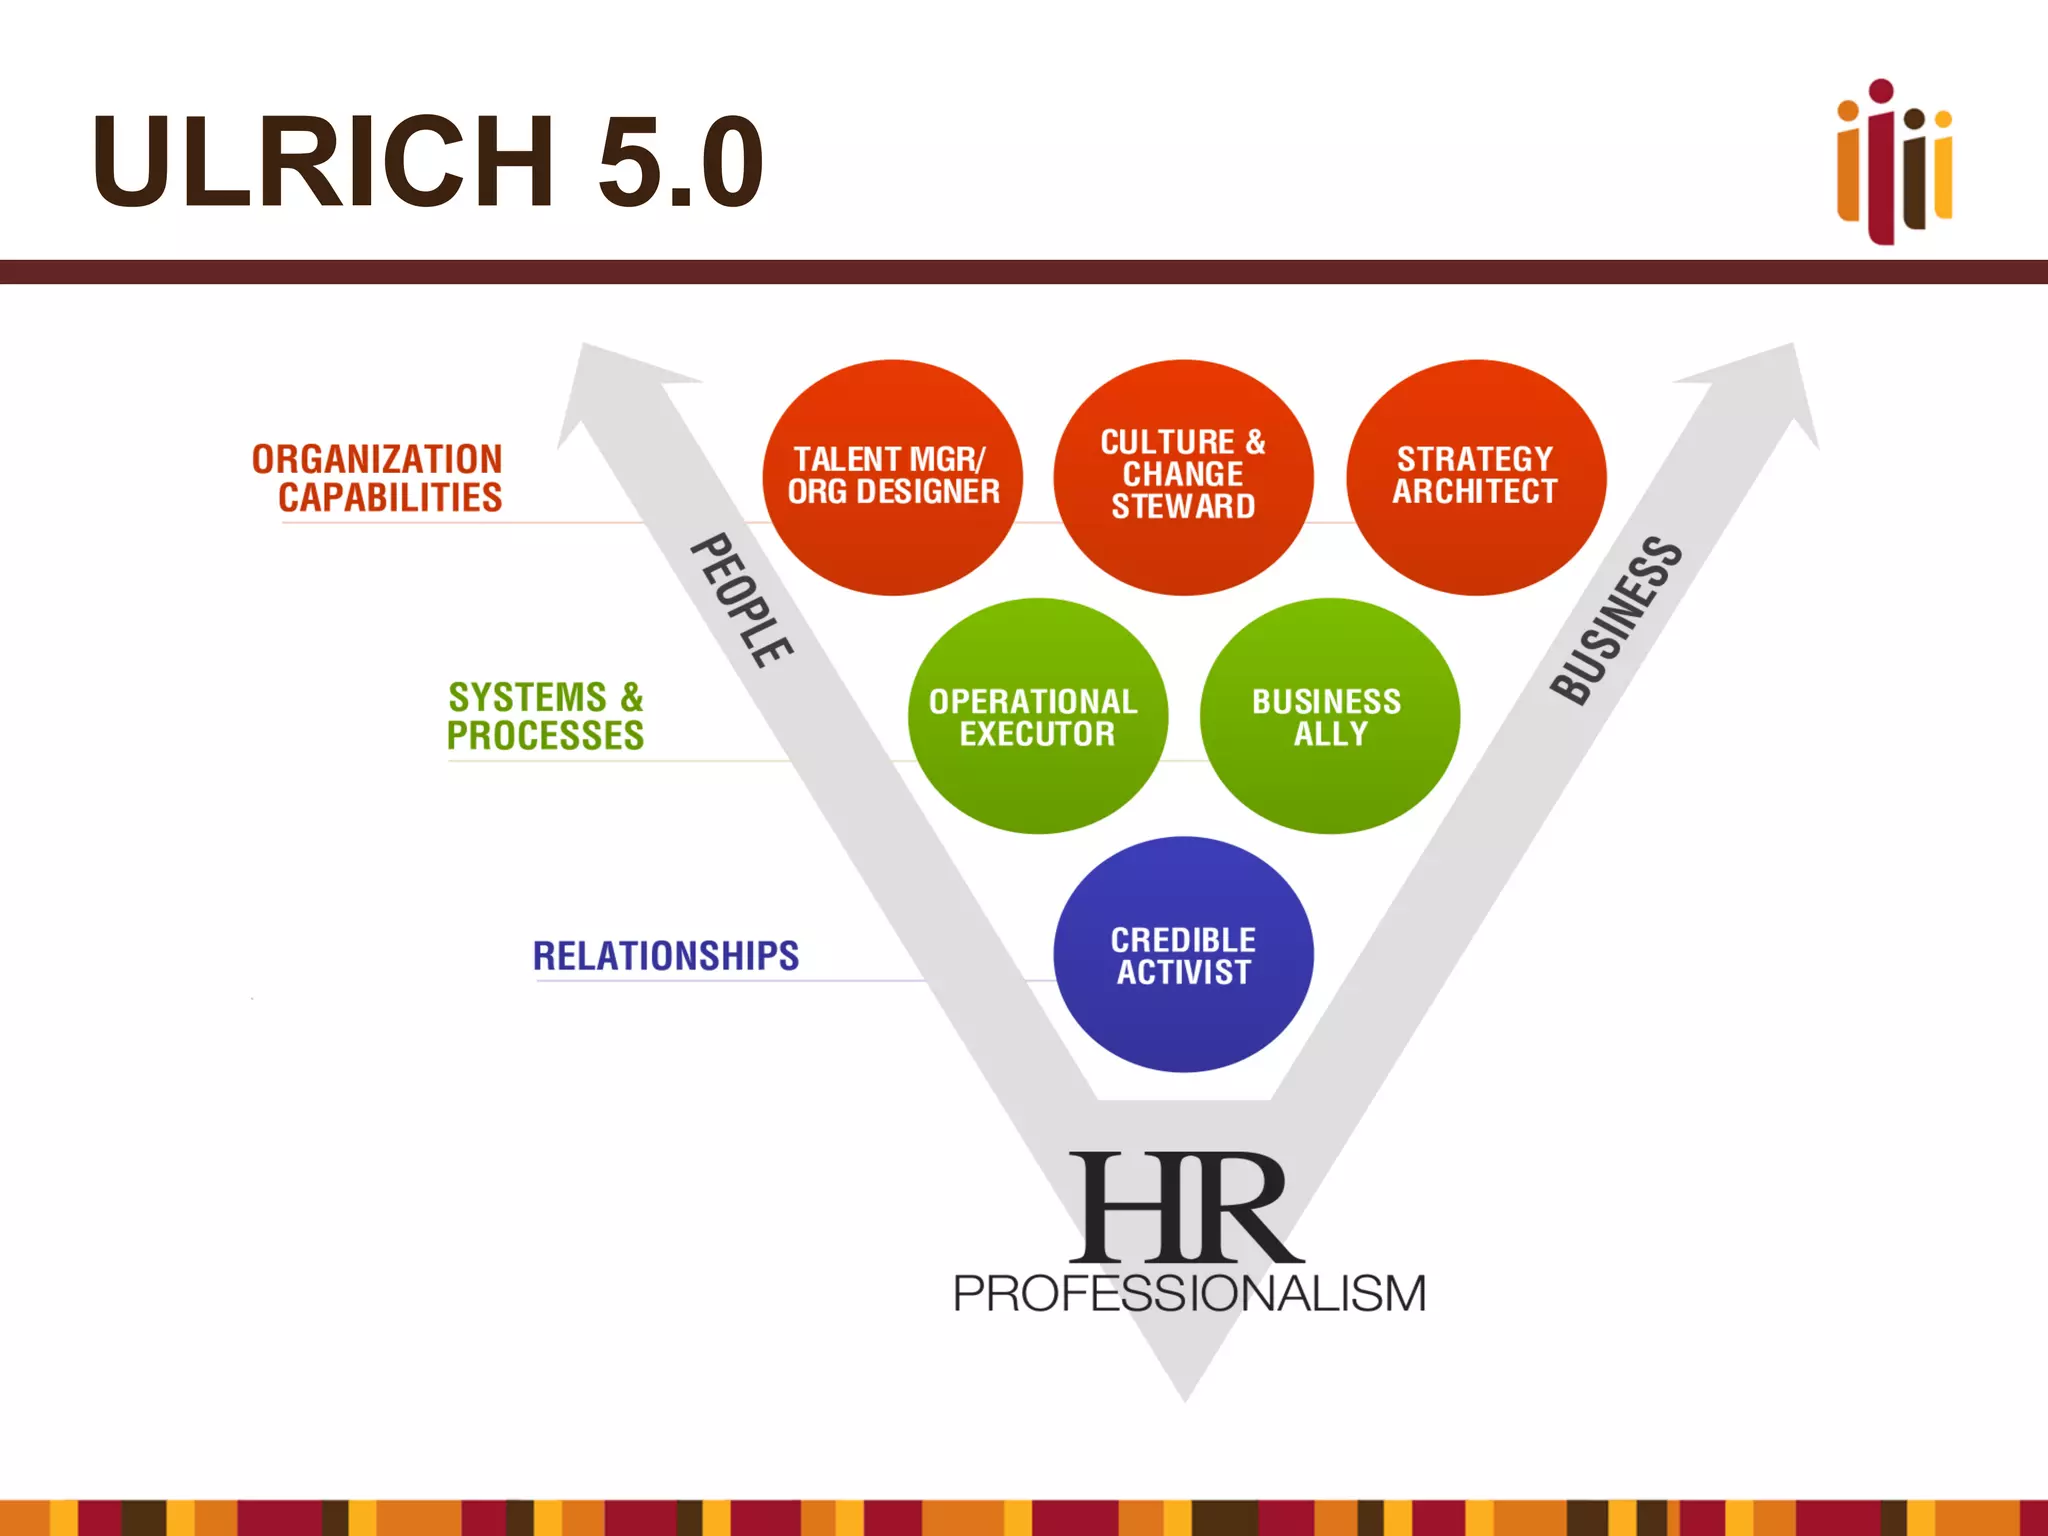
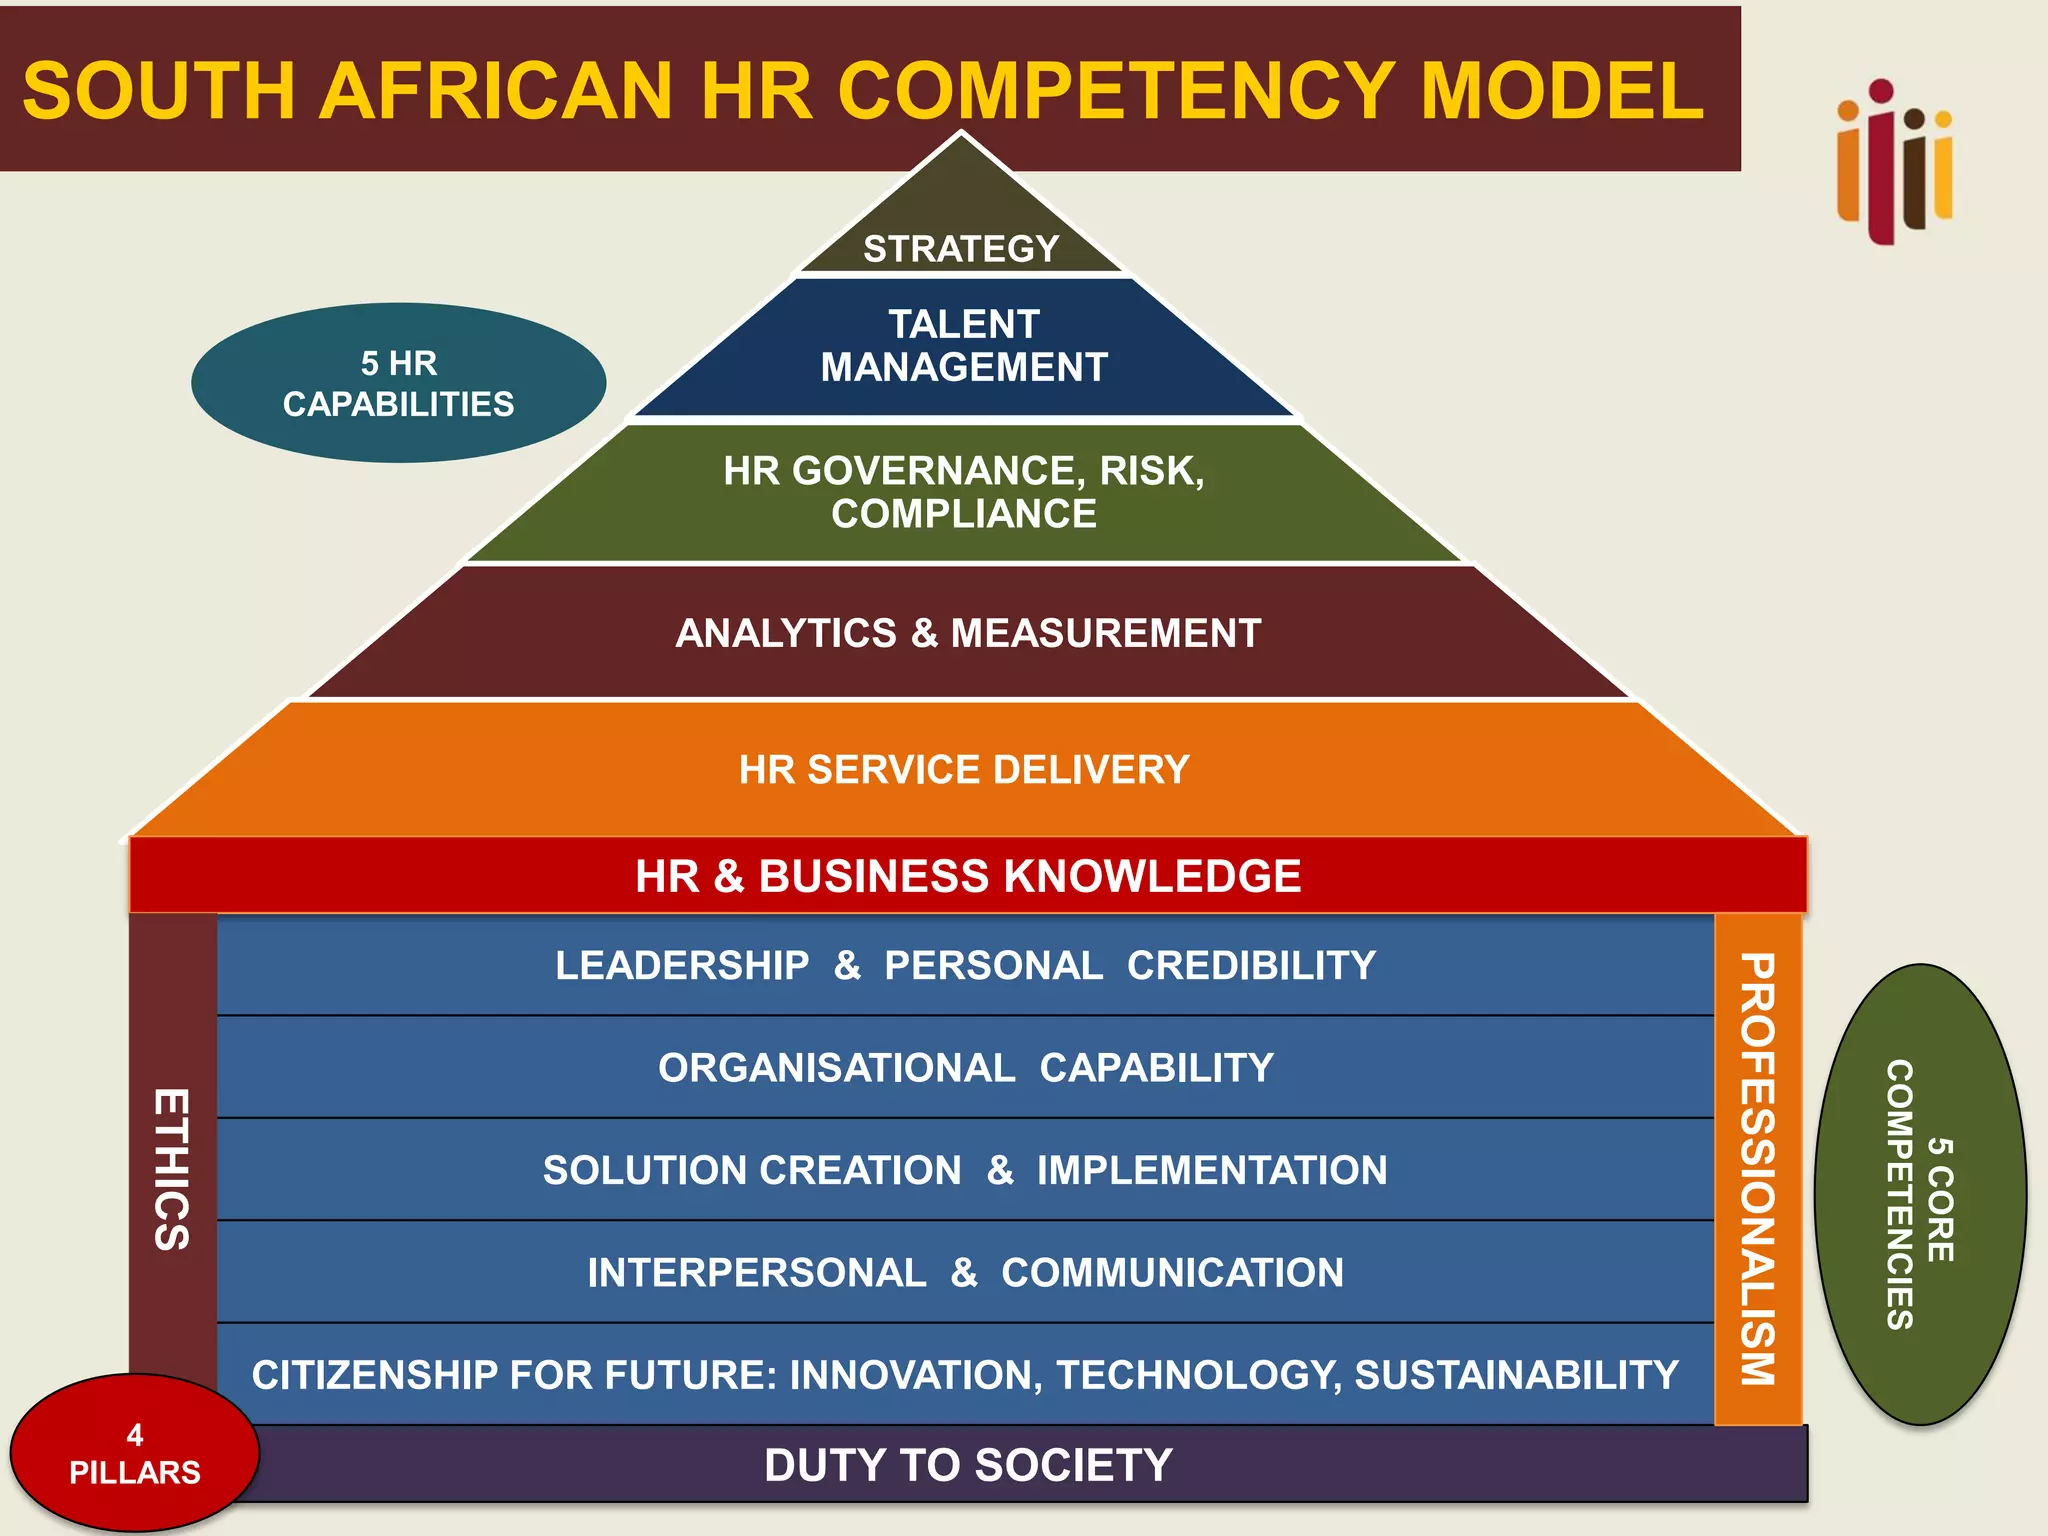

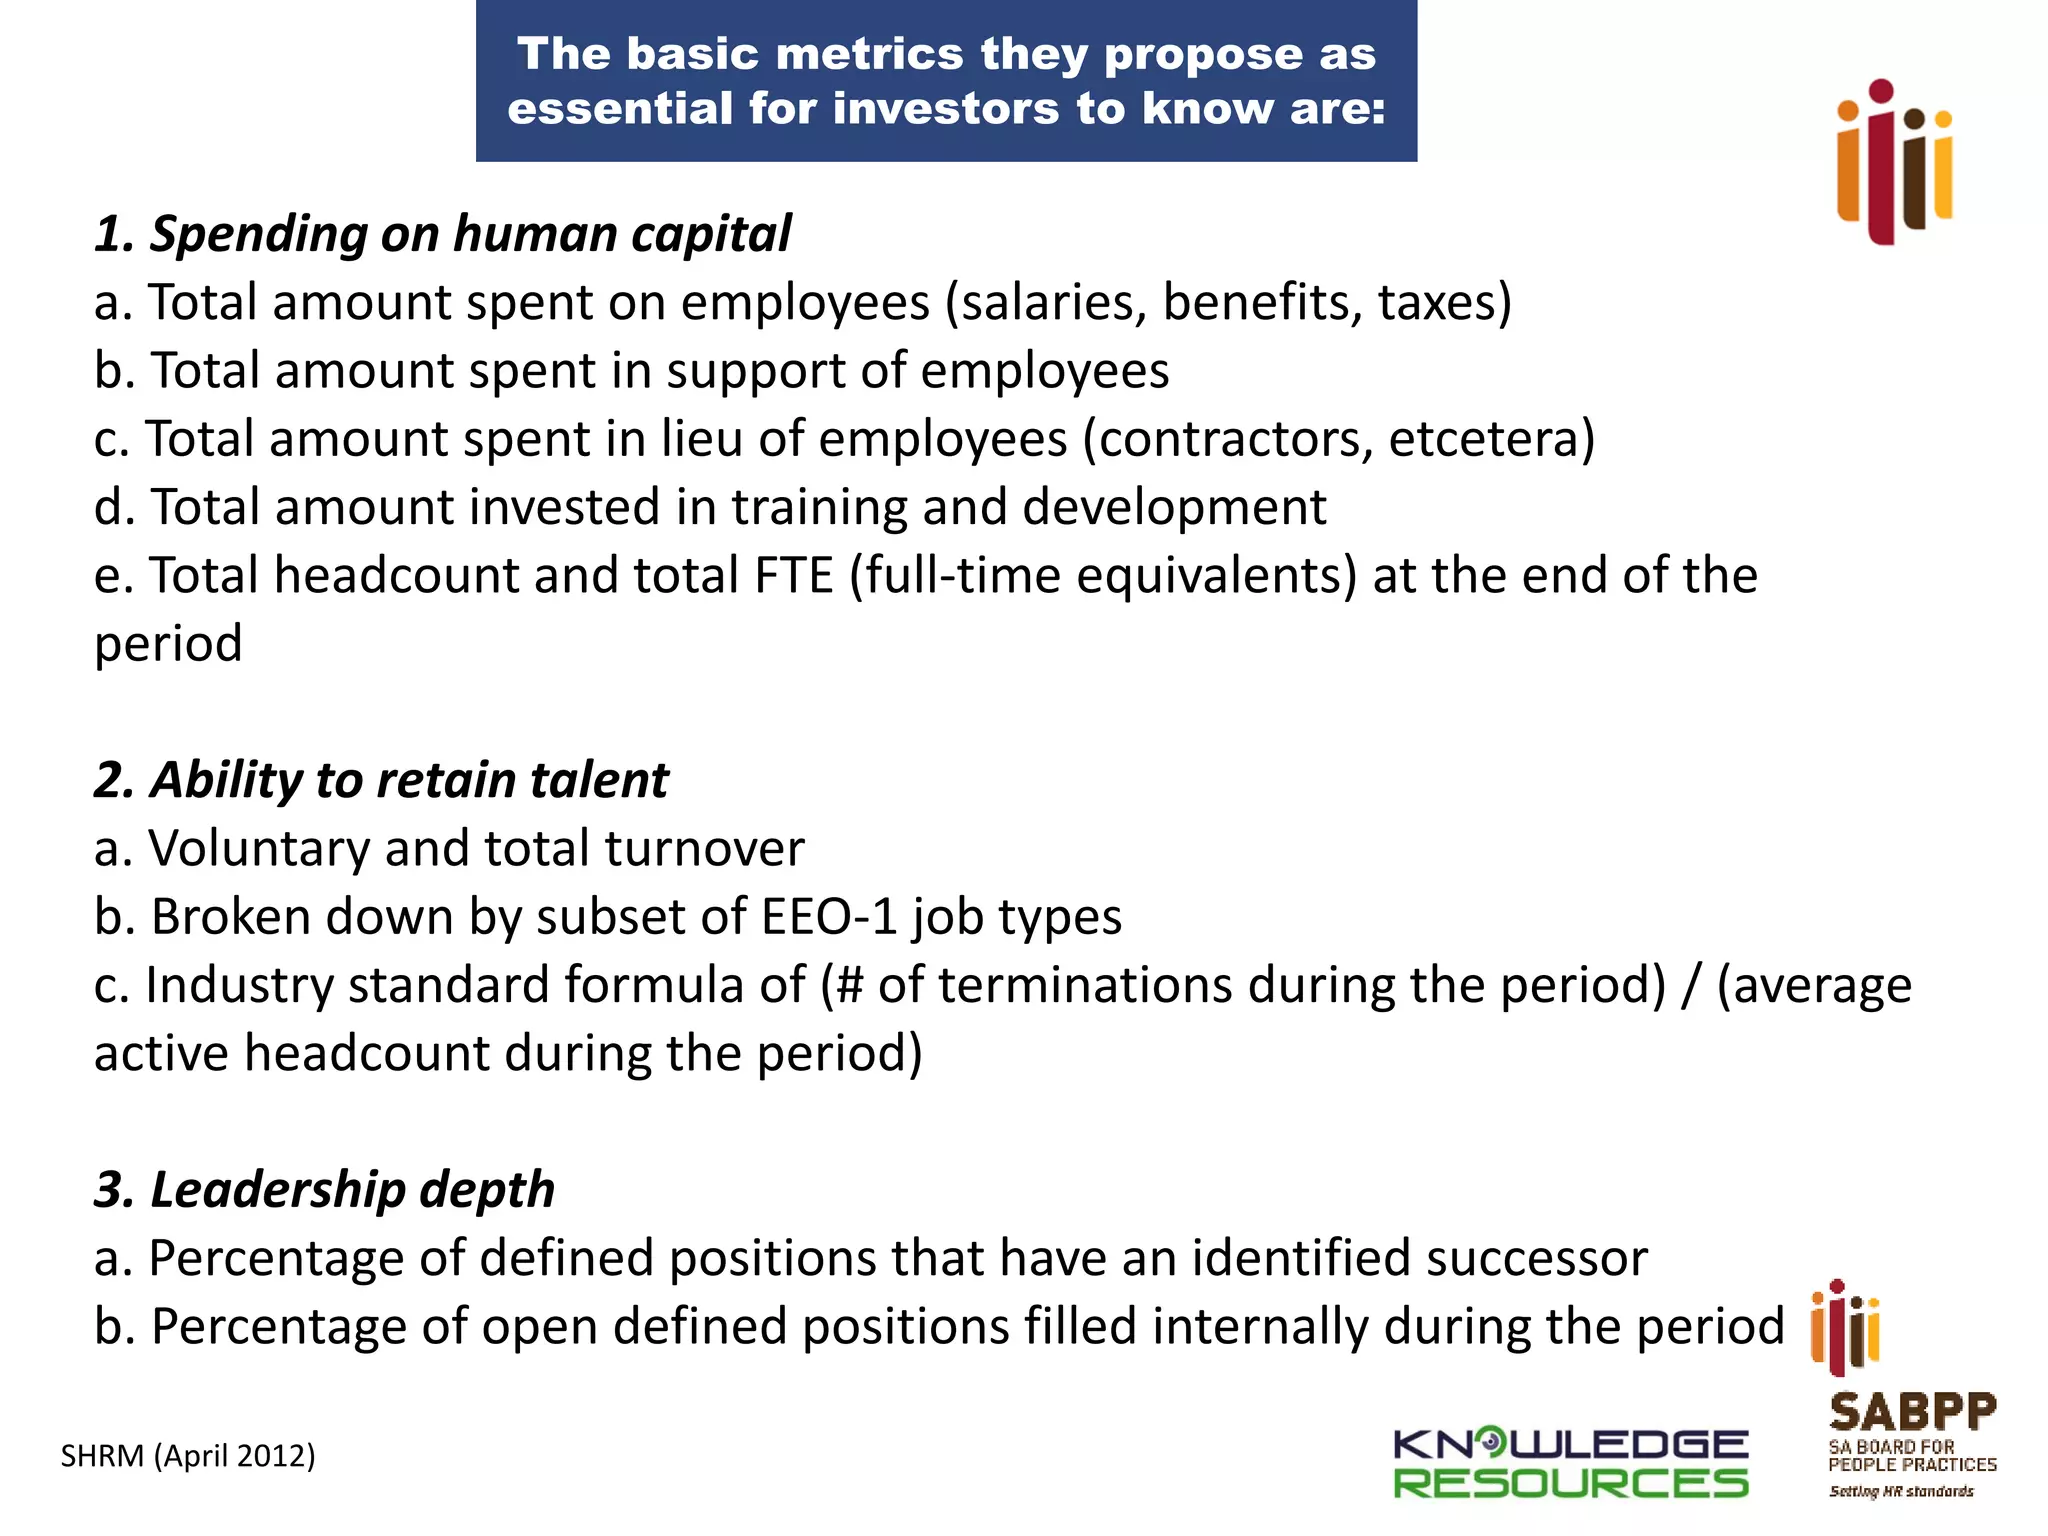
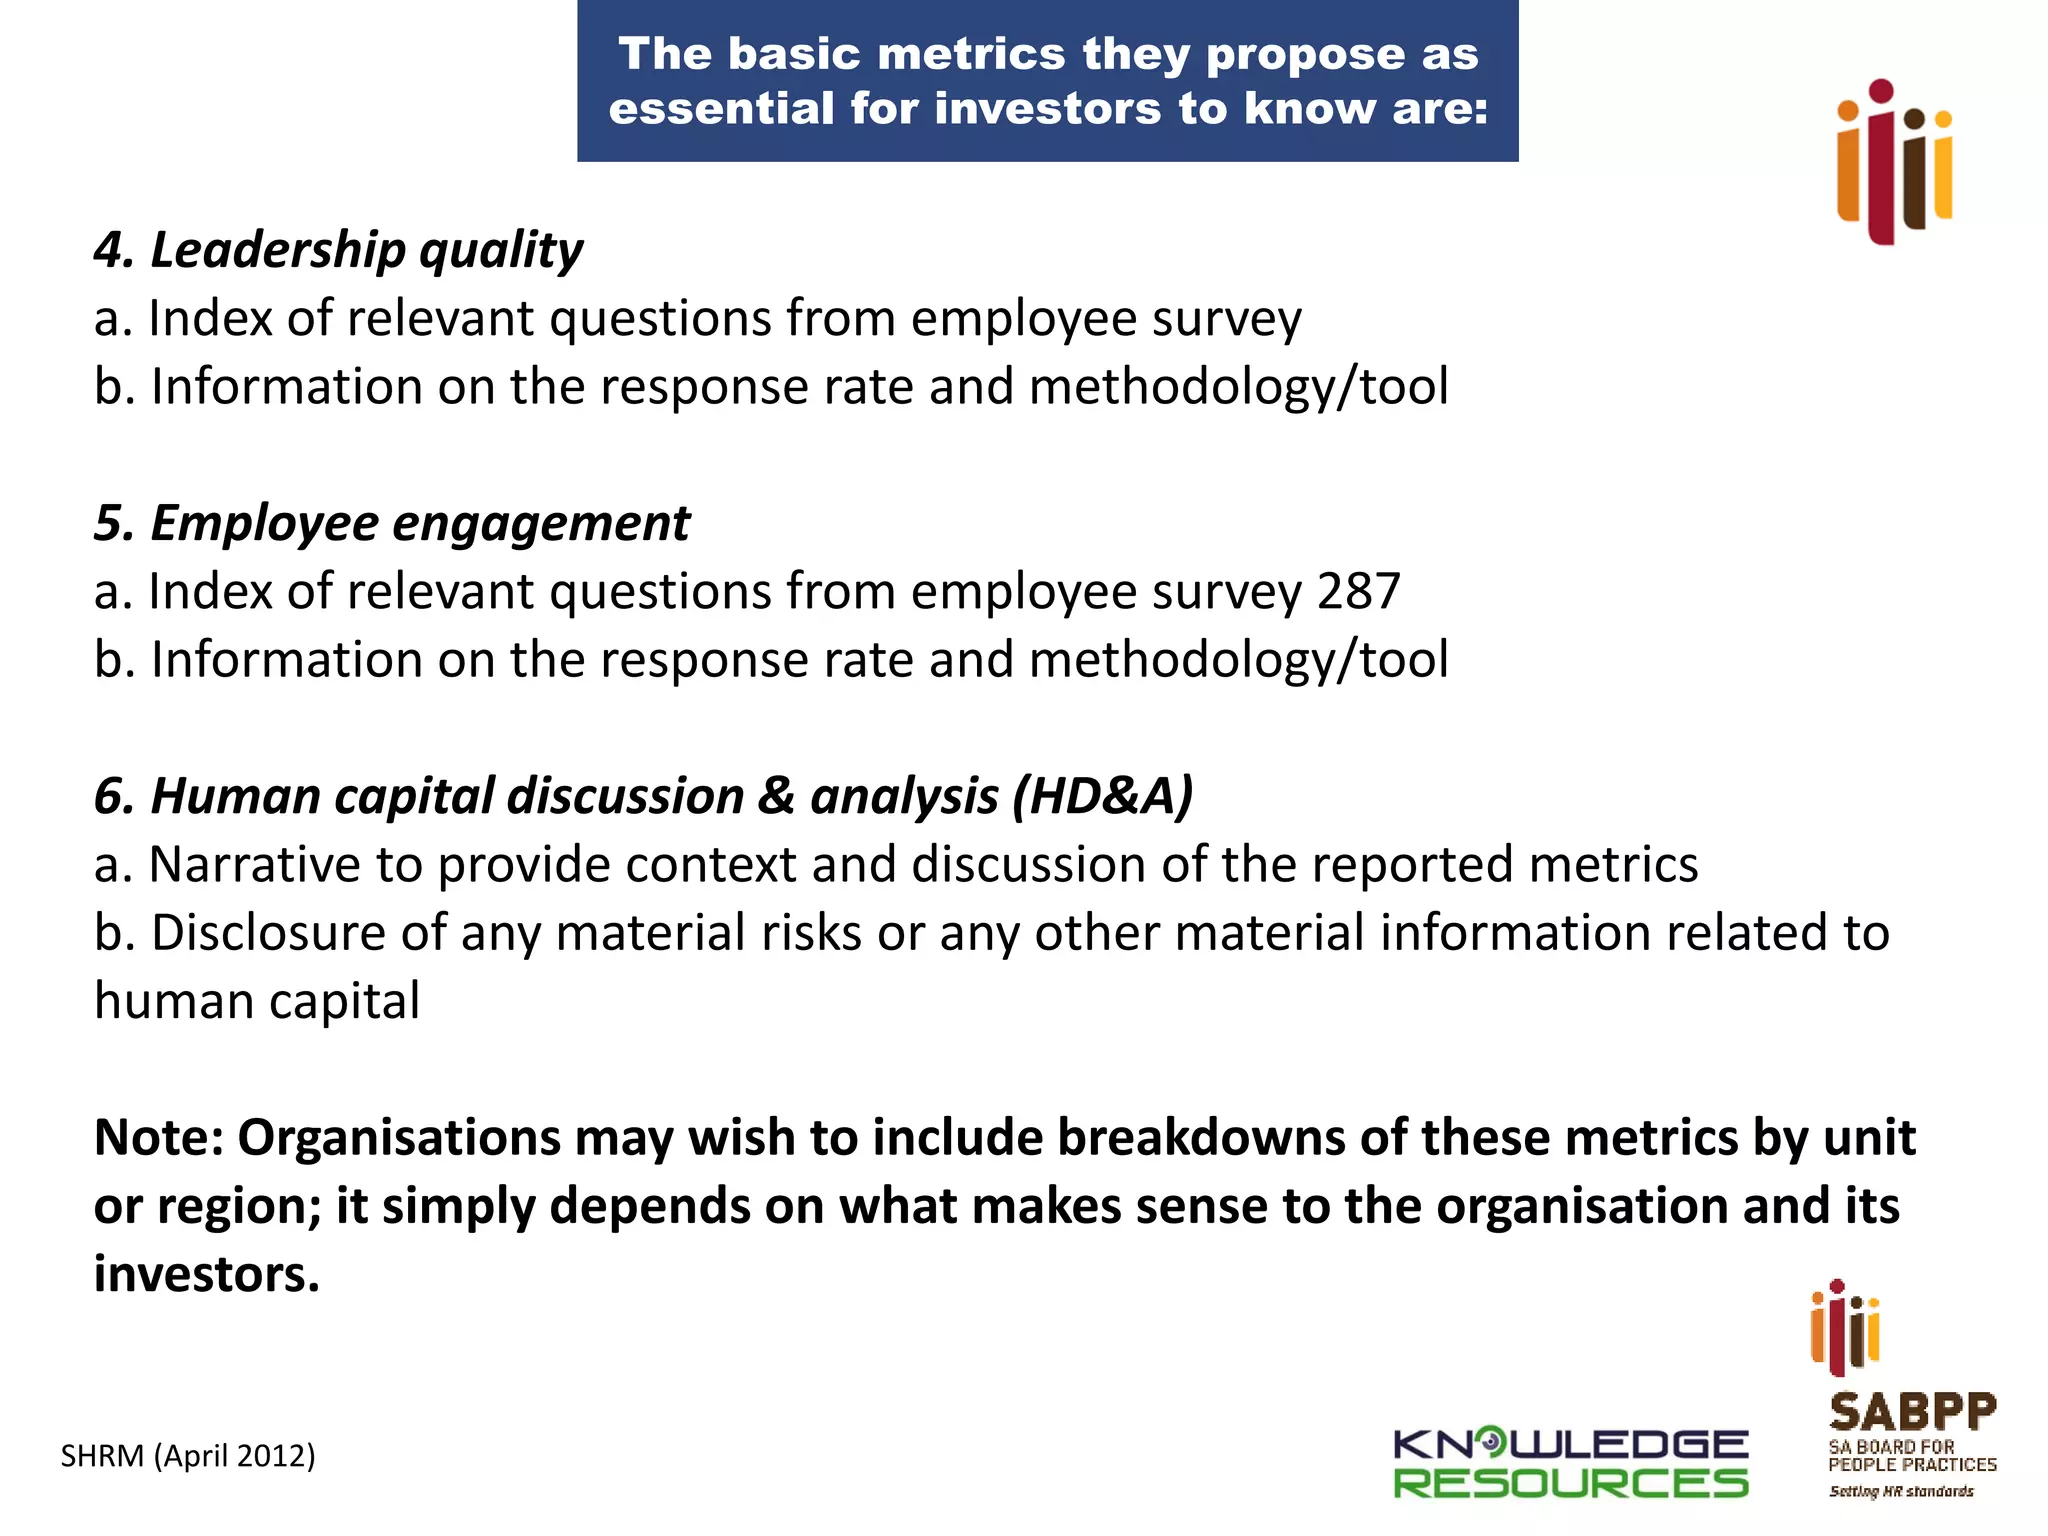
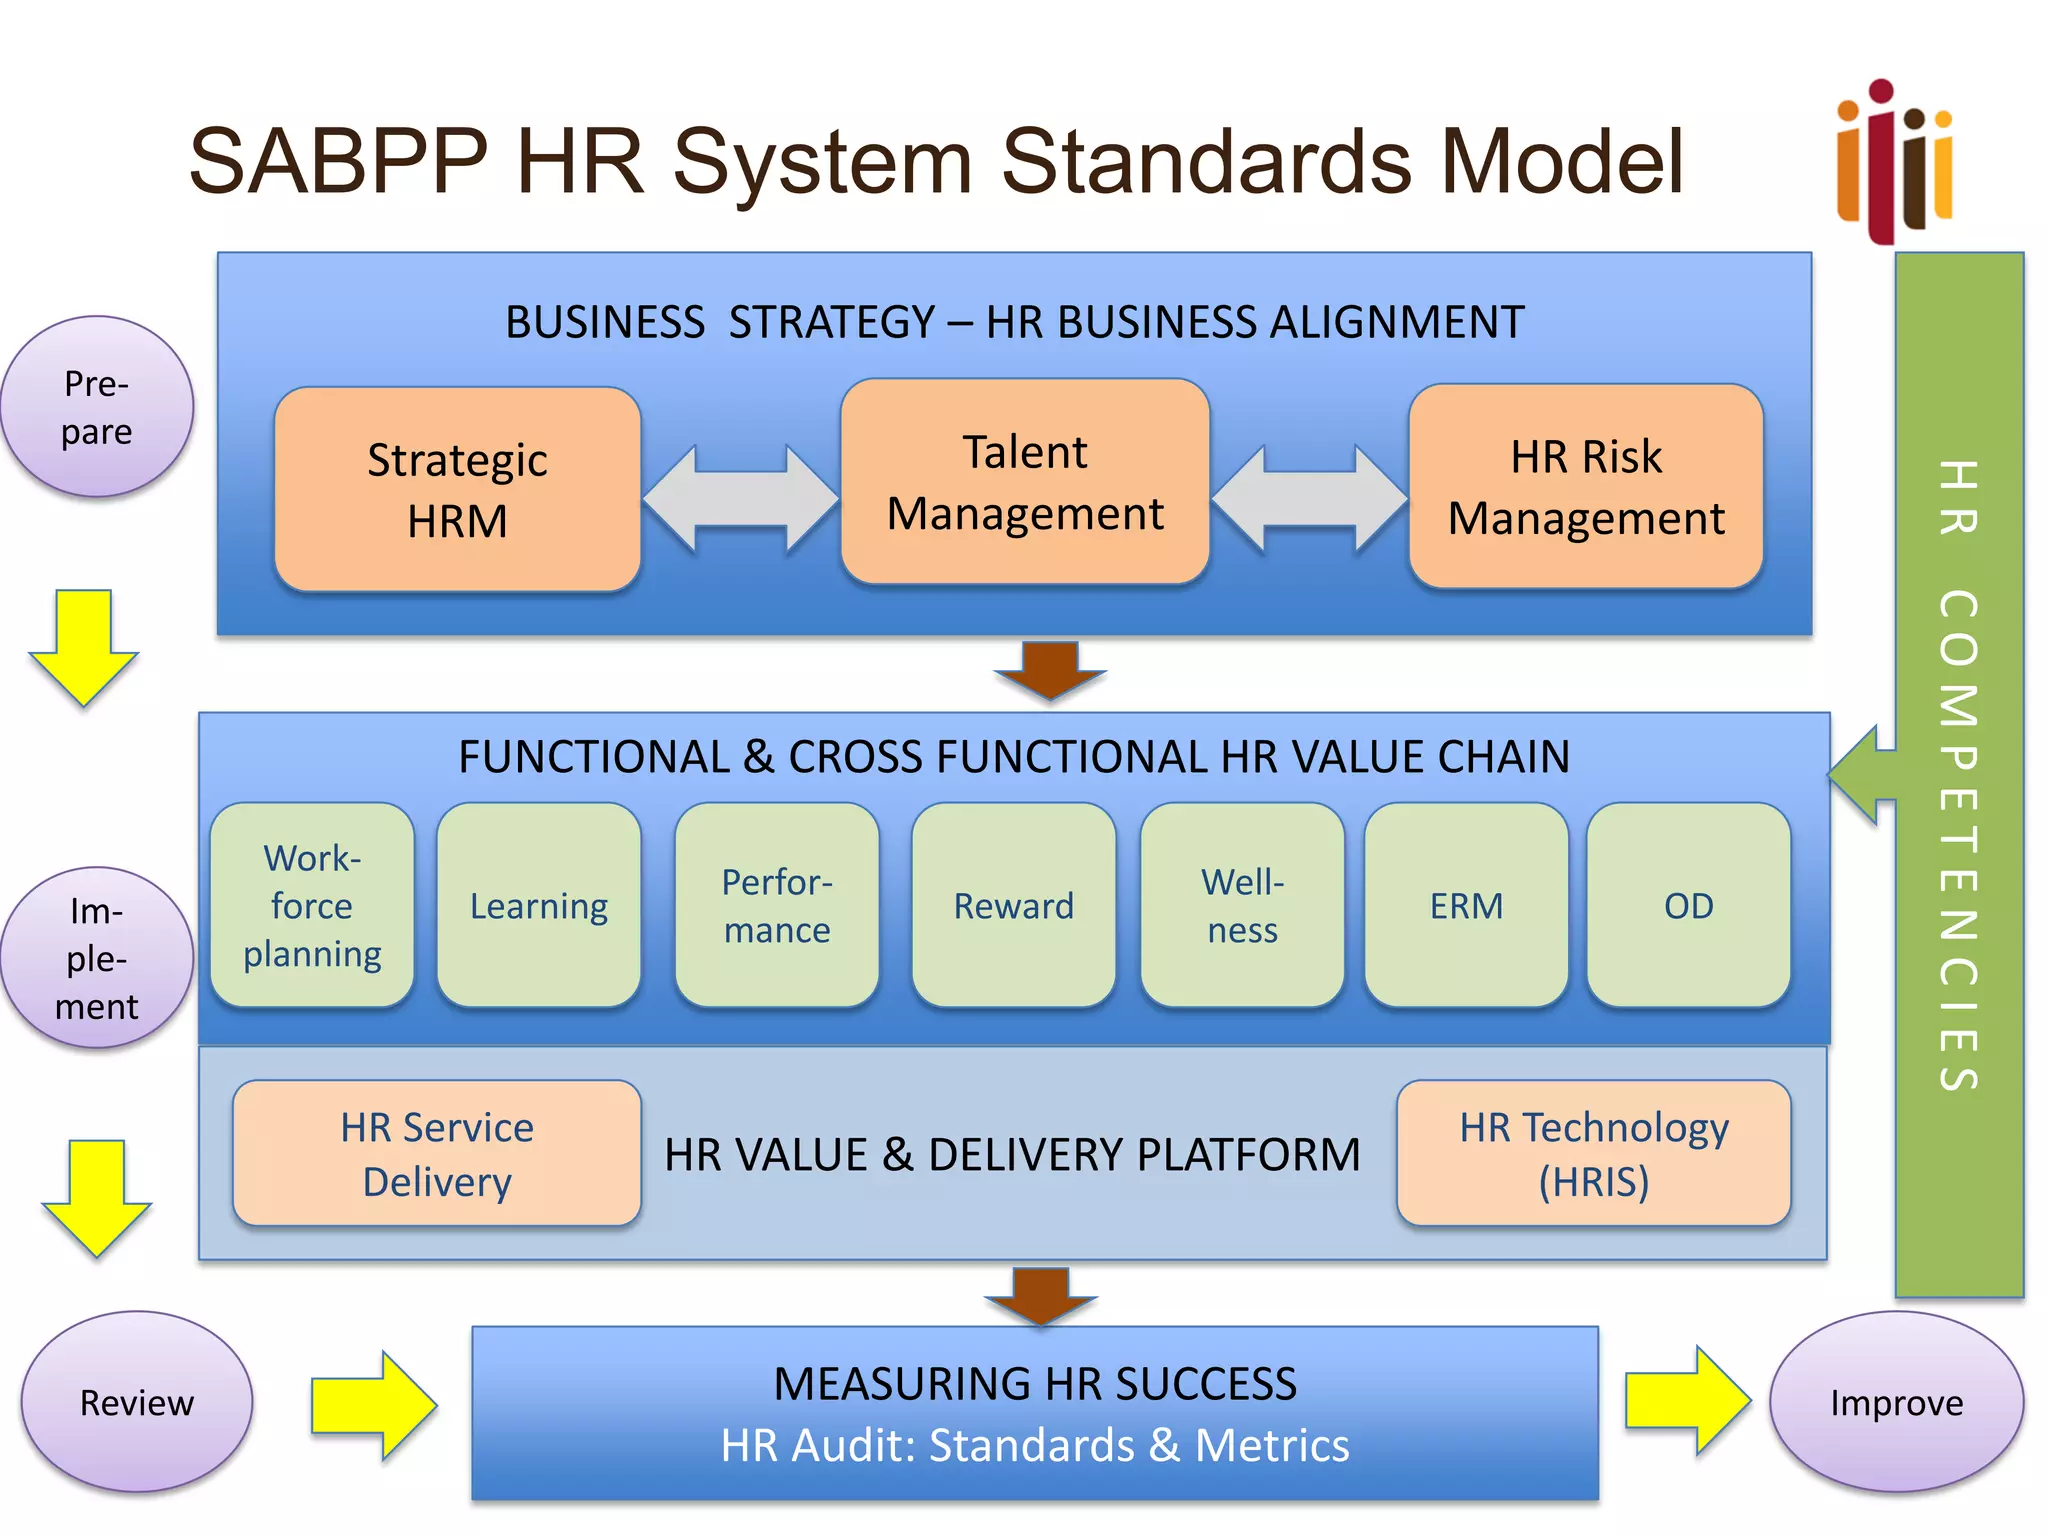
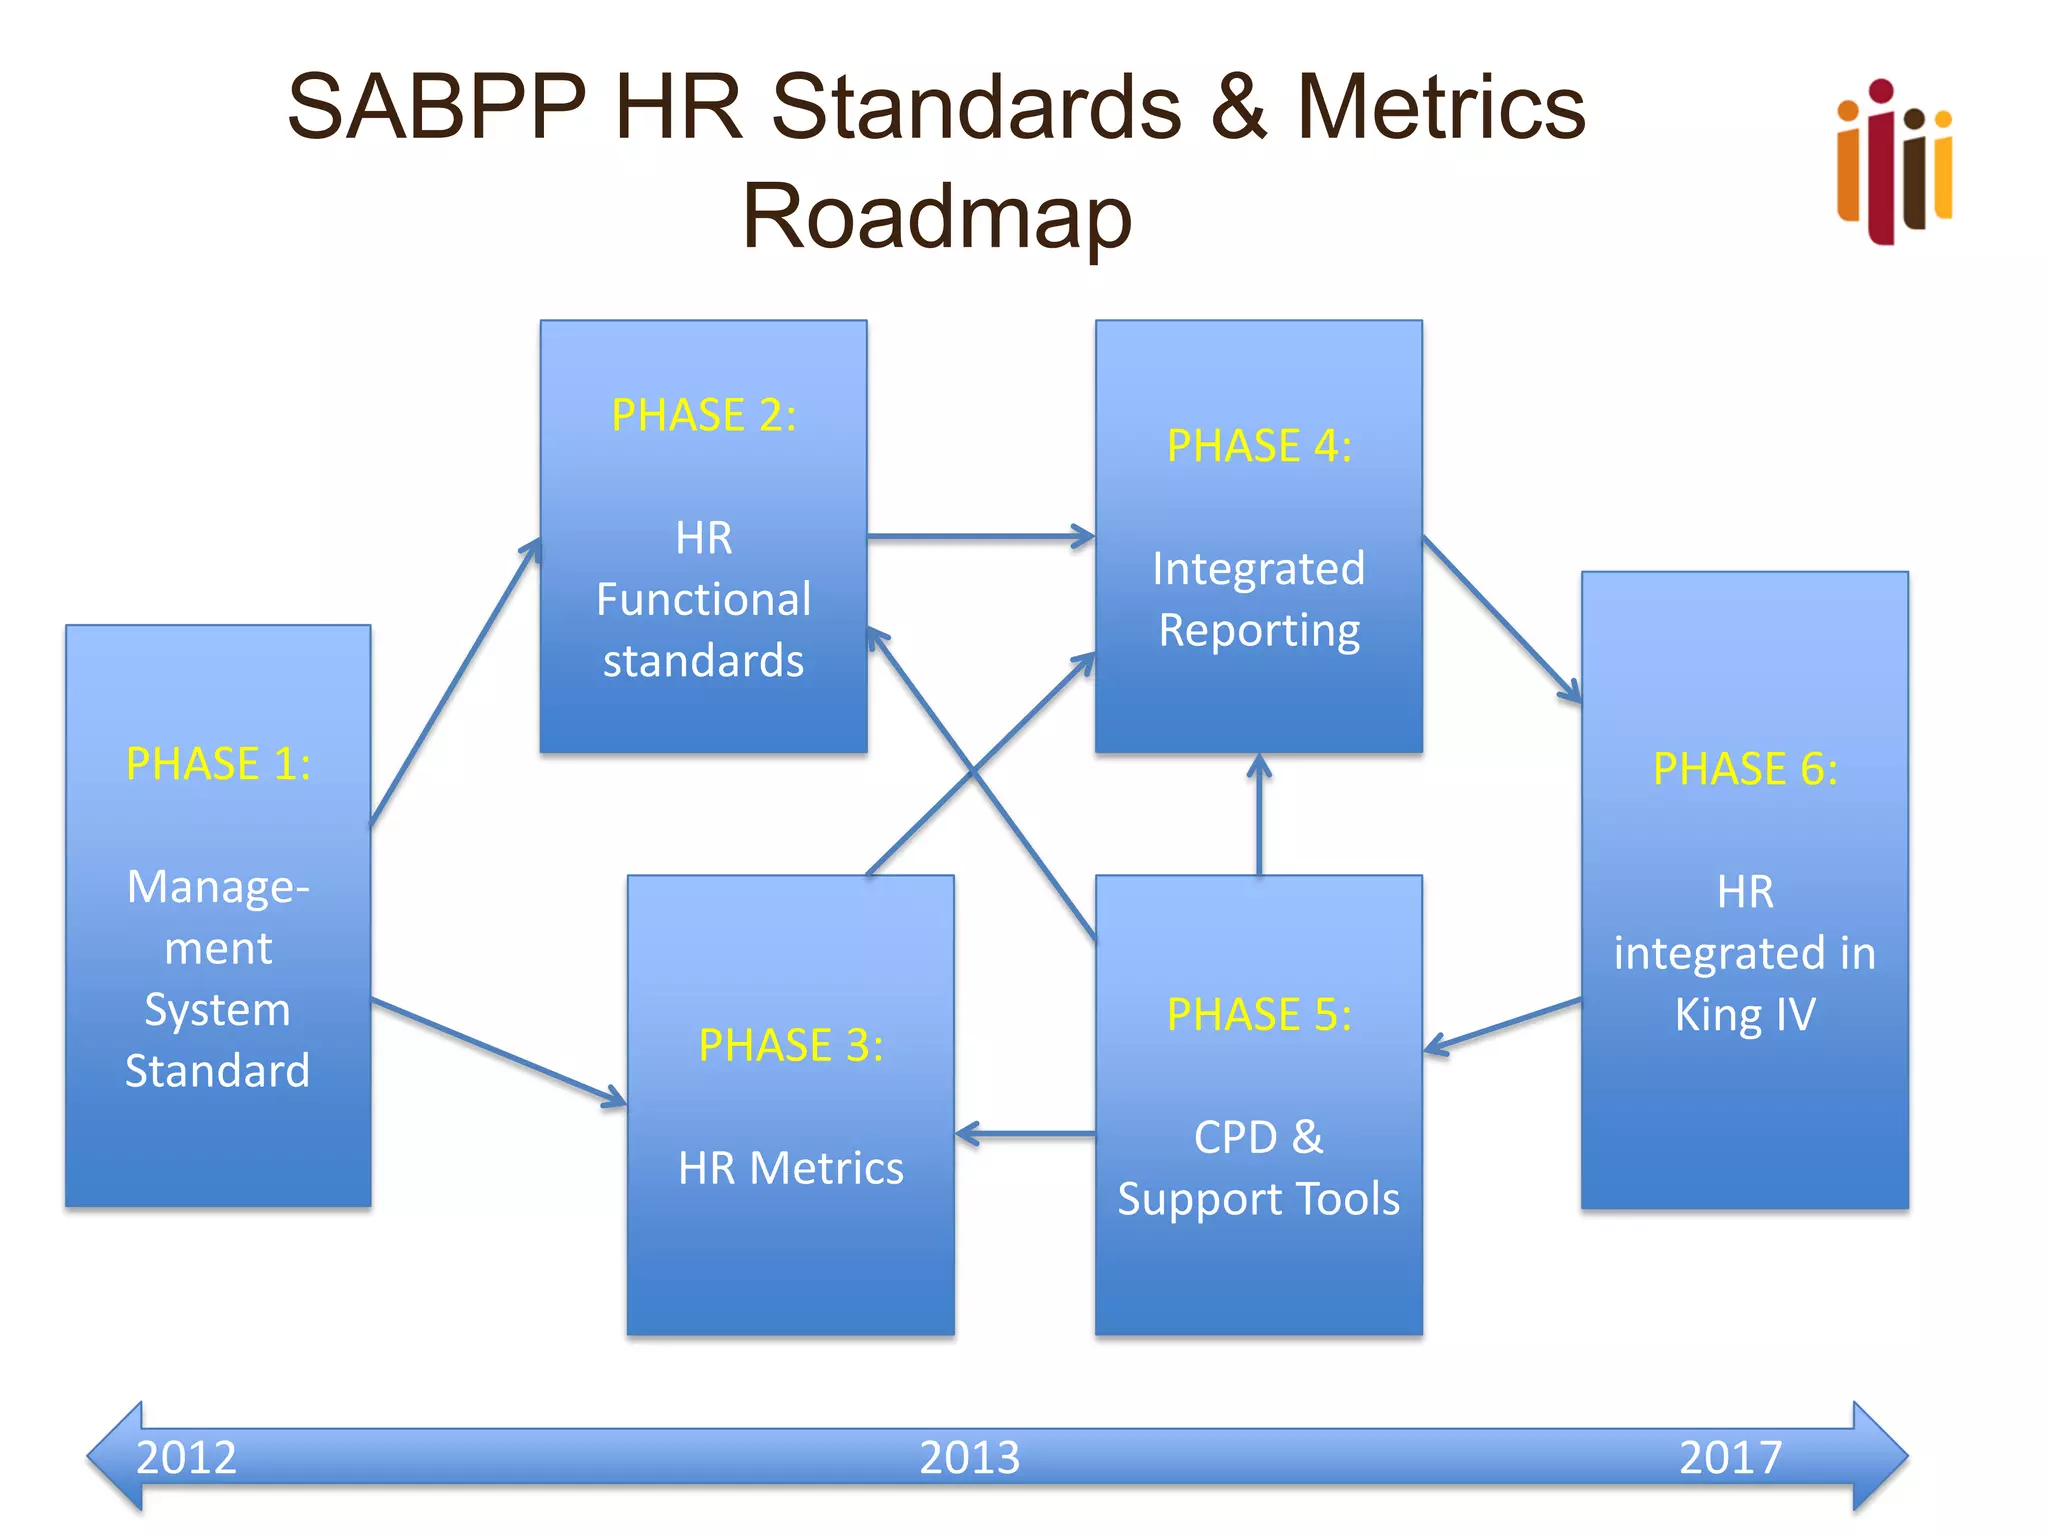
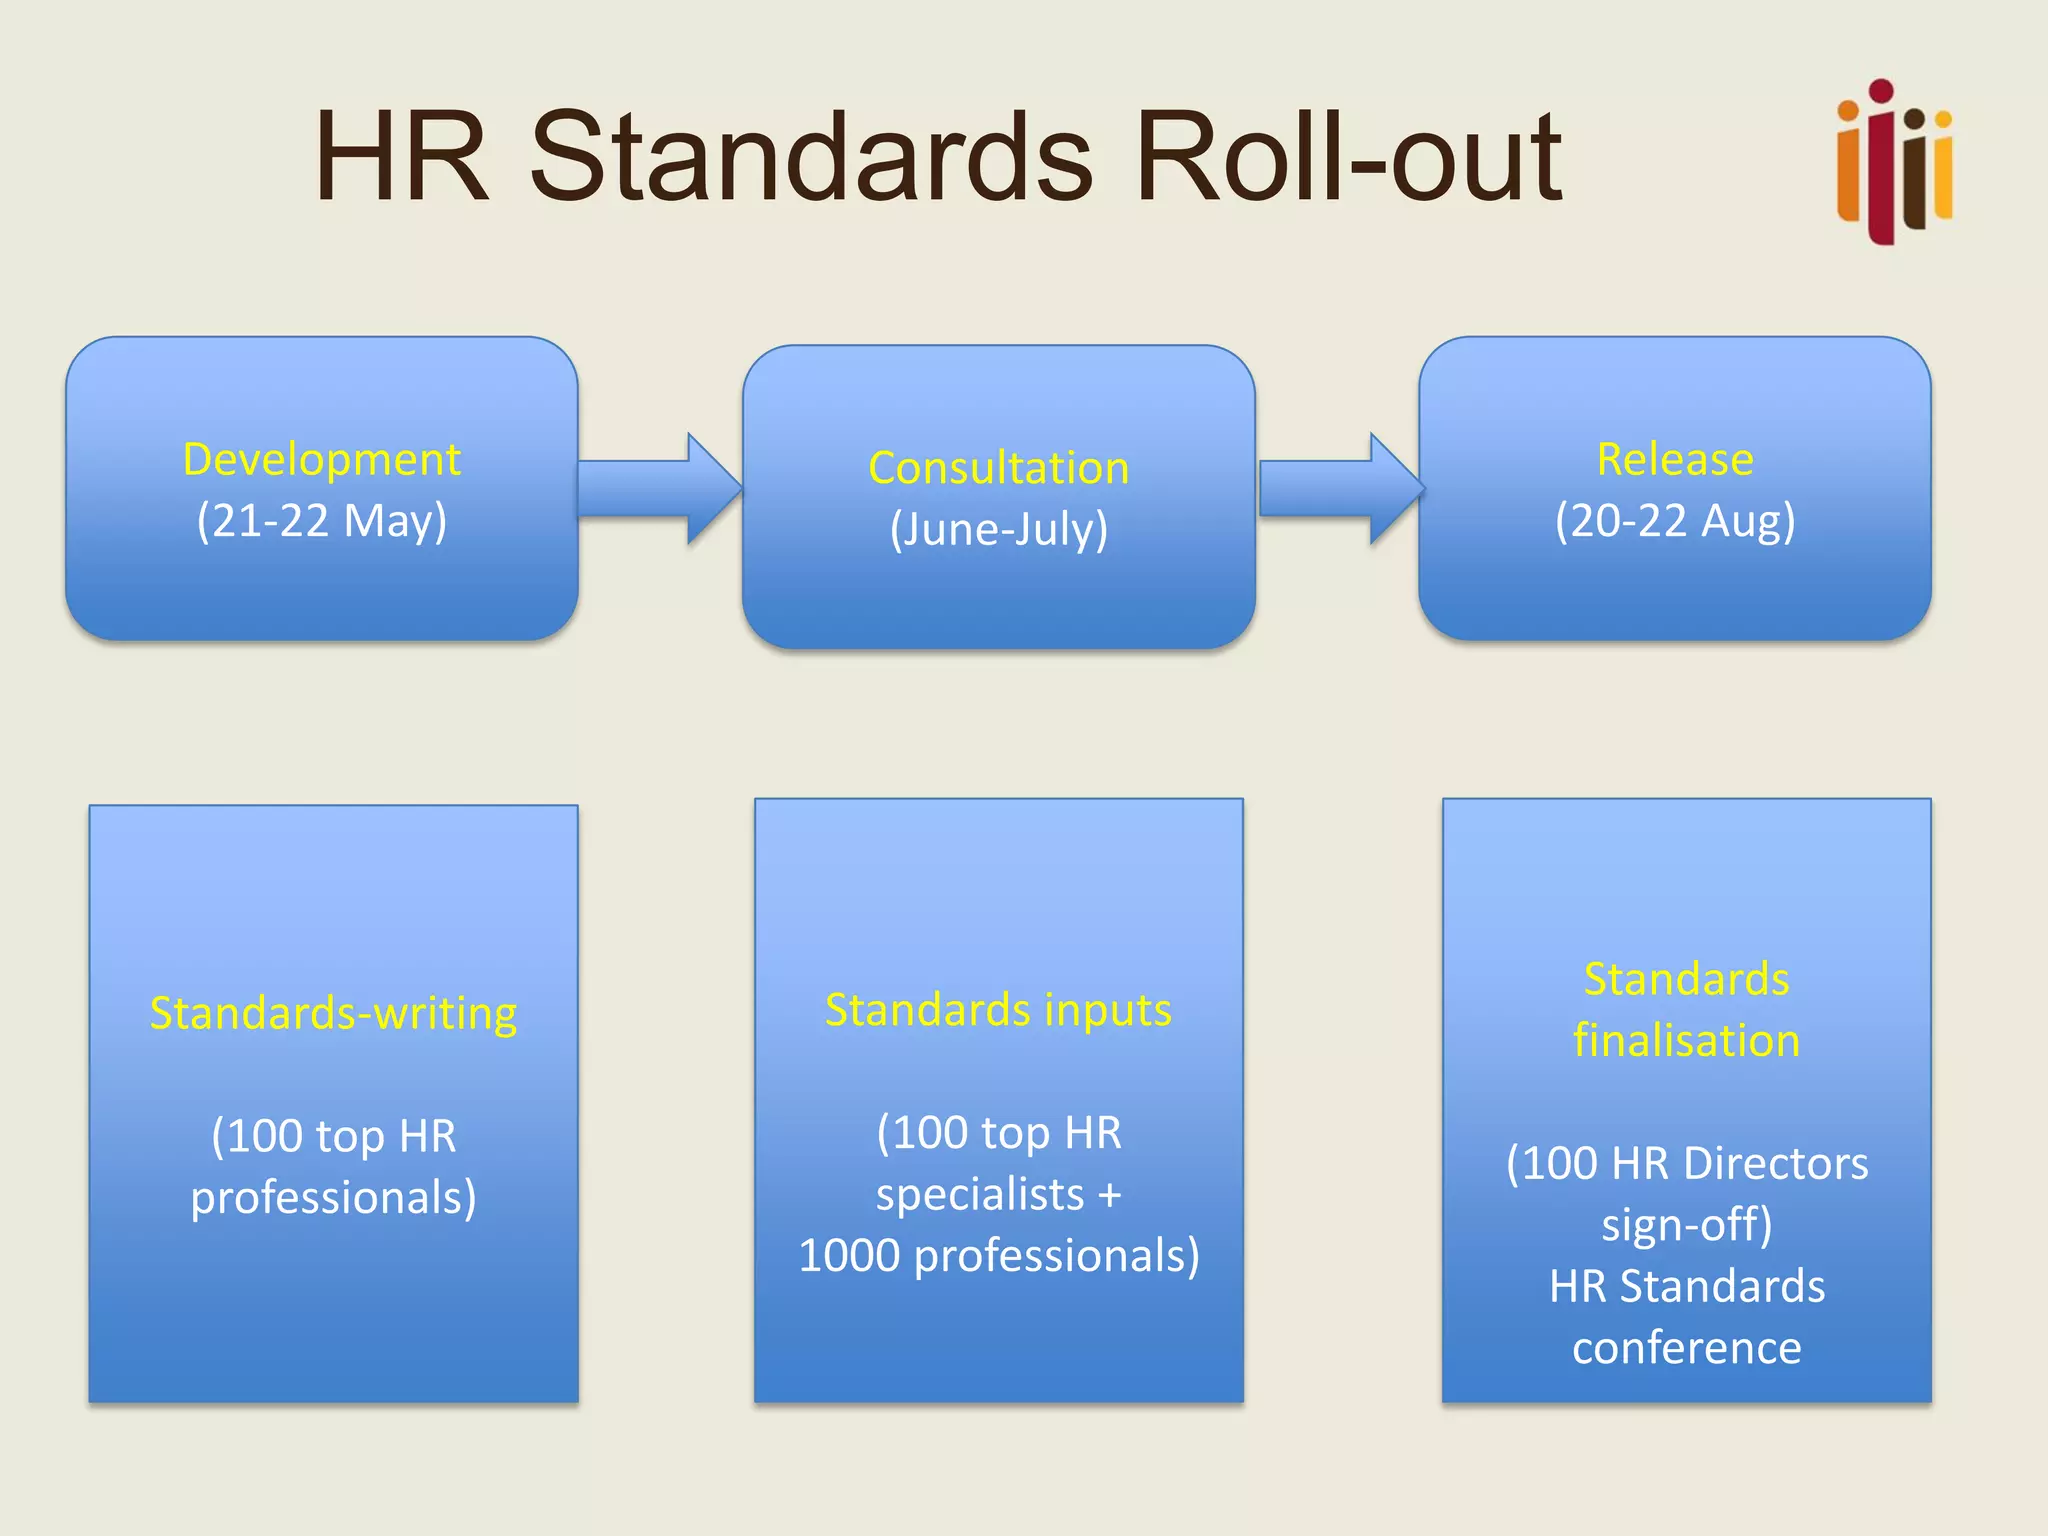


The document provides information on the development of a new South African HR competency model, standards, and metrics. It discusses the methodology used, which included input from various organizations and alignment with global models. The new competency model includes five HR capabilities, four pillars, and five core competencies. Metrics are proposed as essential for investors, including spending on human capital, talent retention rates, leadership depth and quality, employee engagement, and human capital discussion and analysis. The competency model and standards are meant to advance the HR profession in South Africa.


