
Download as PDF, PPTX
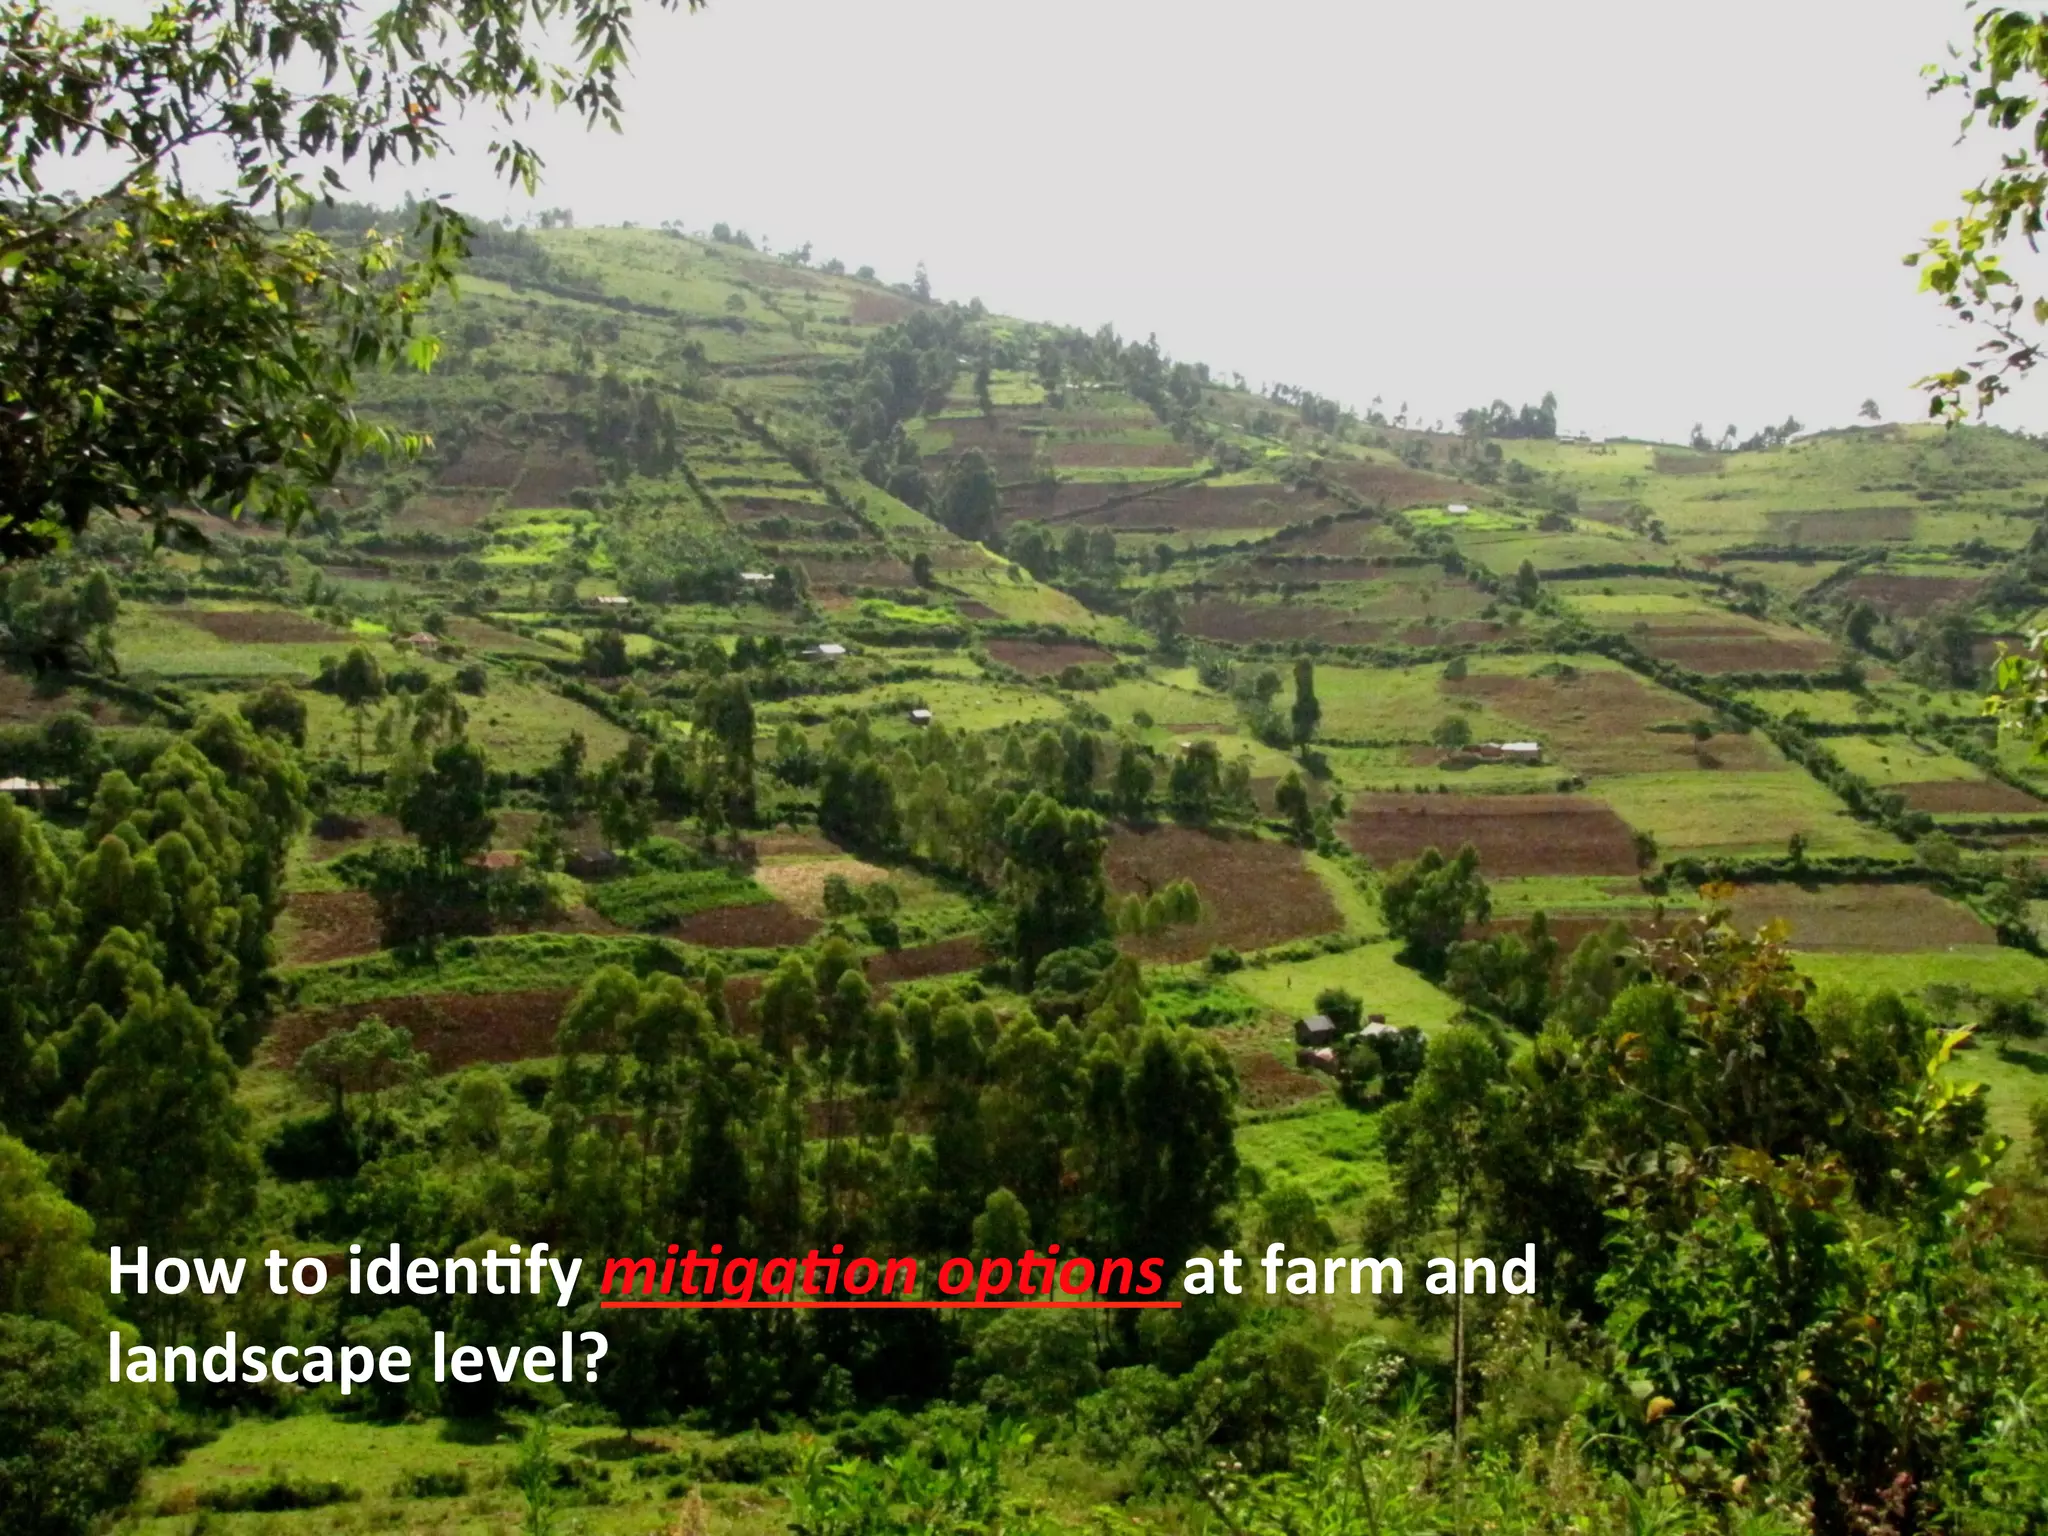
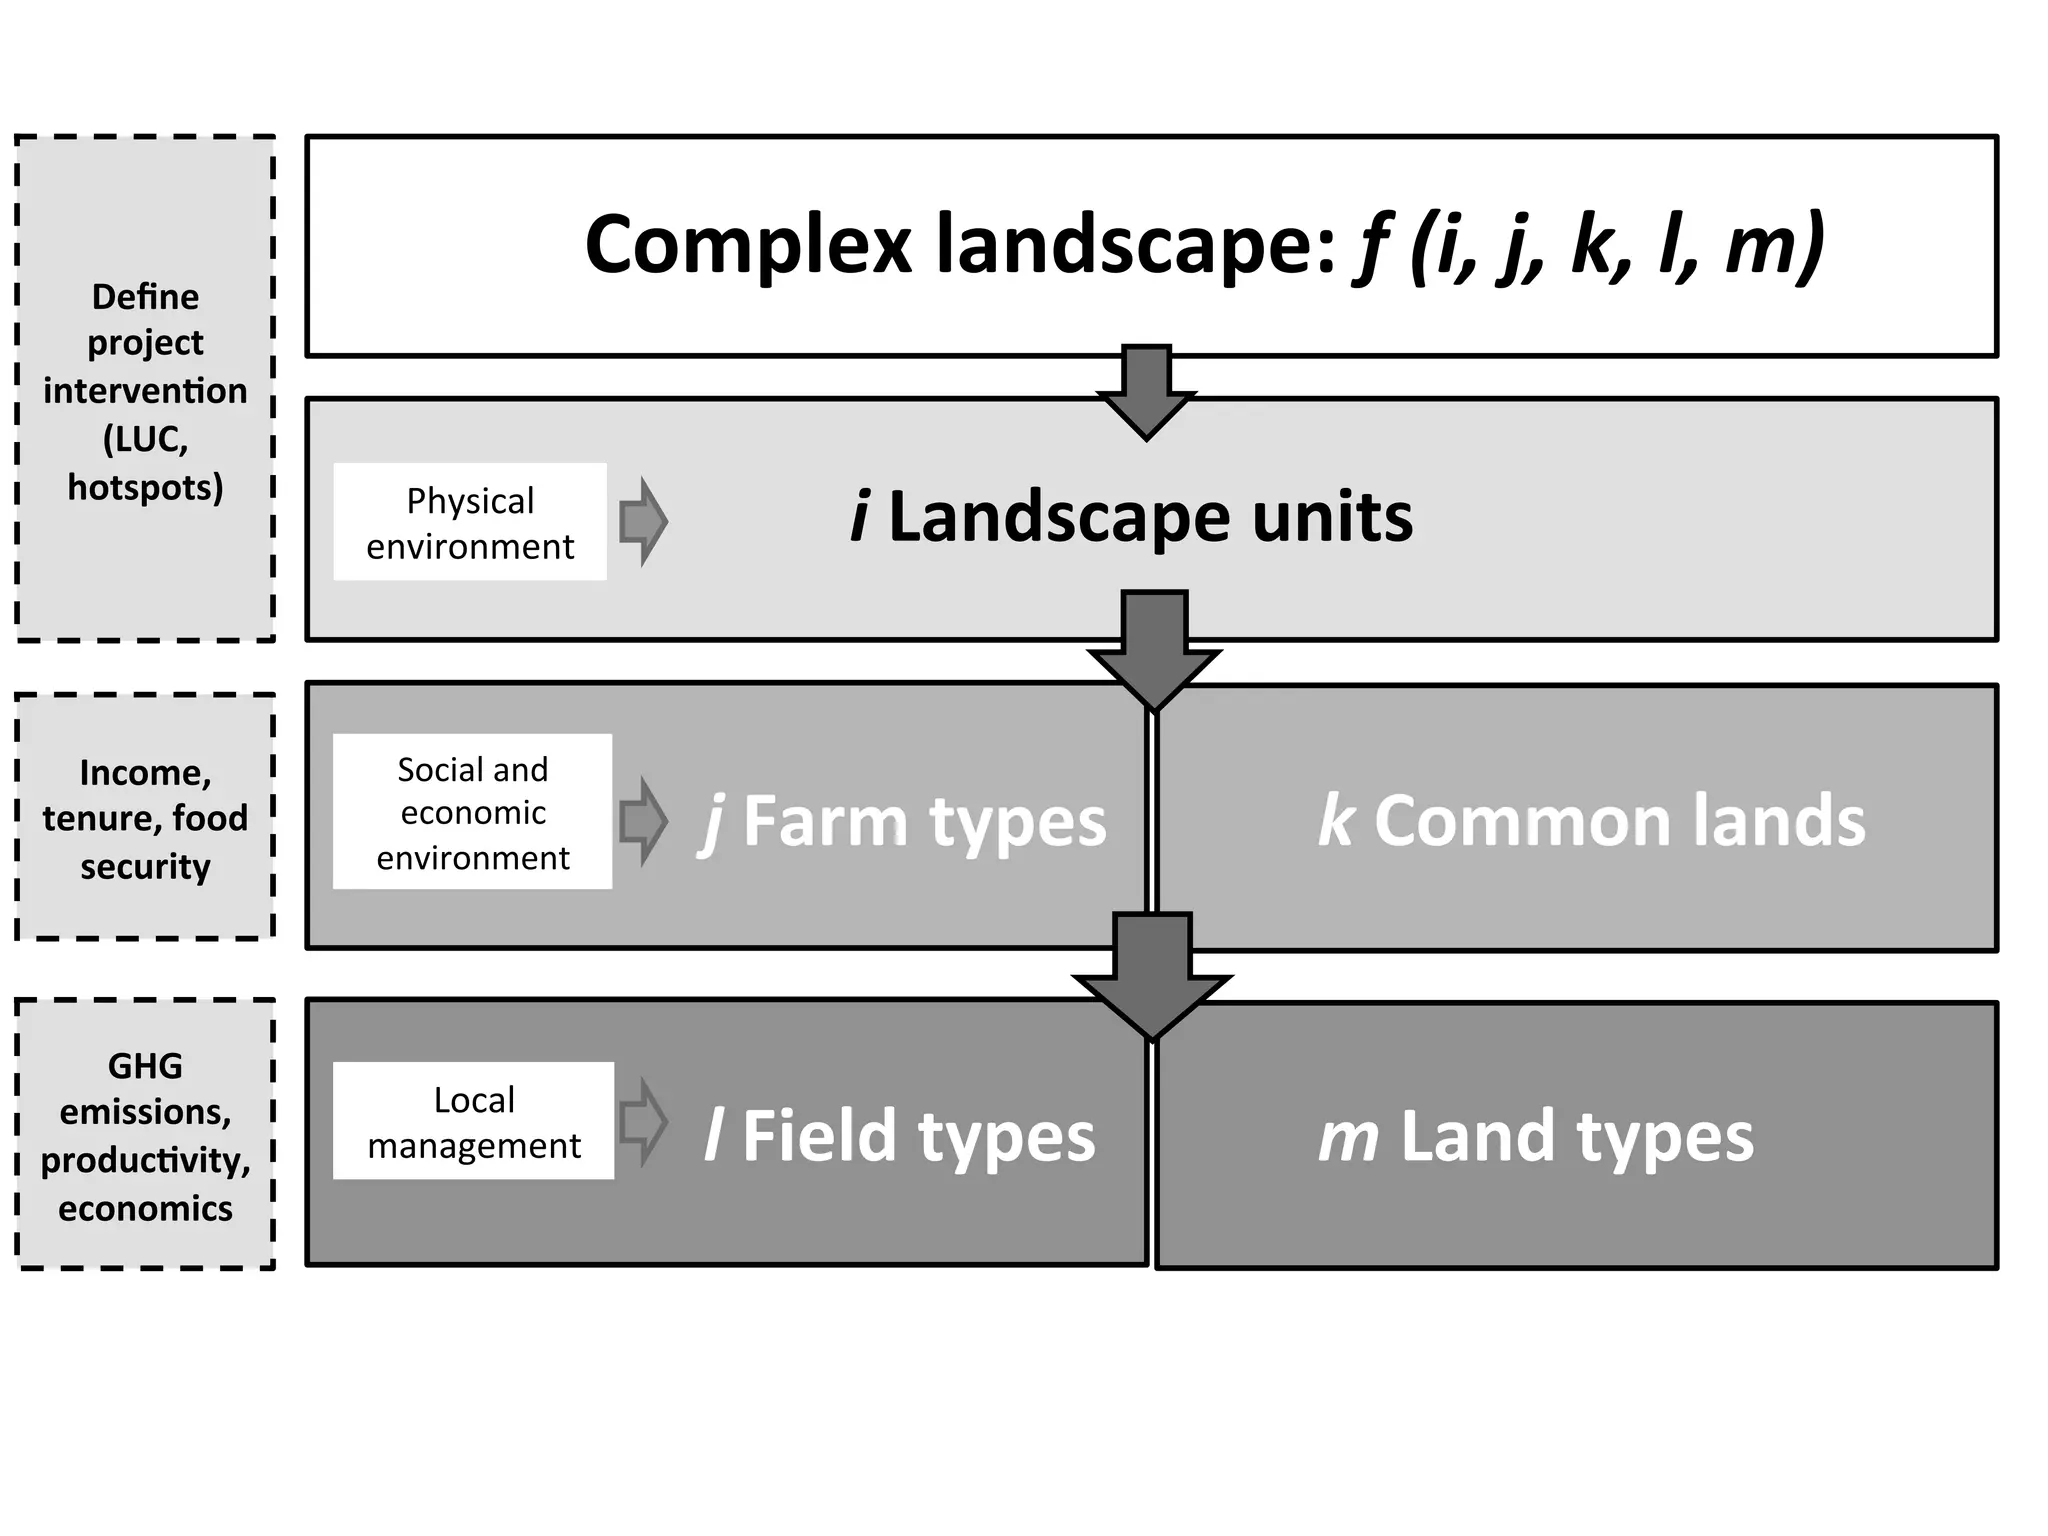
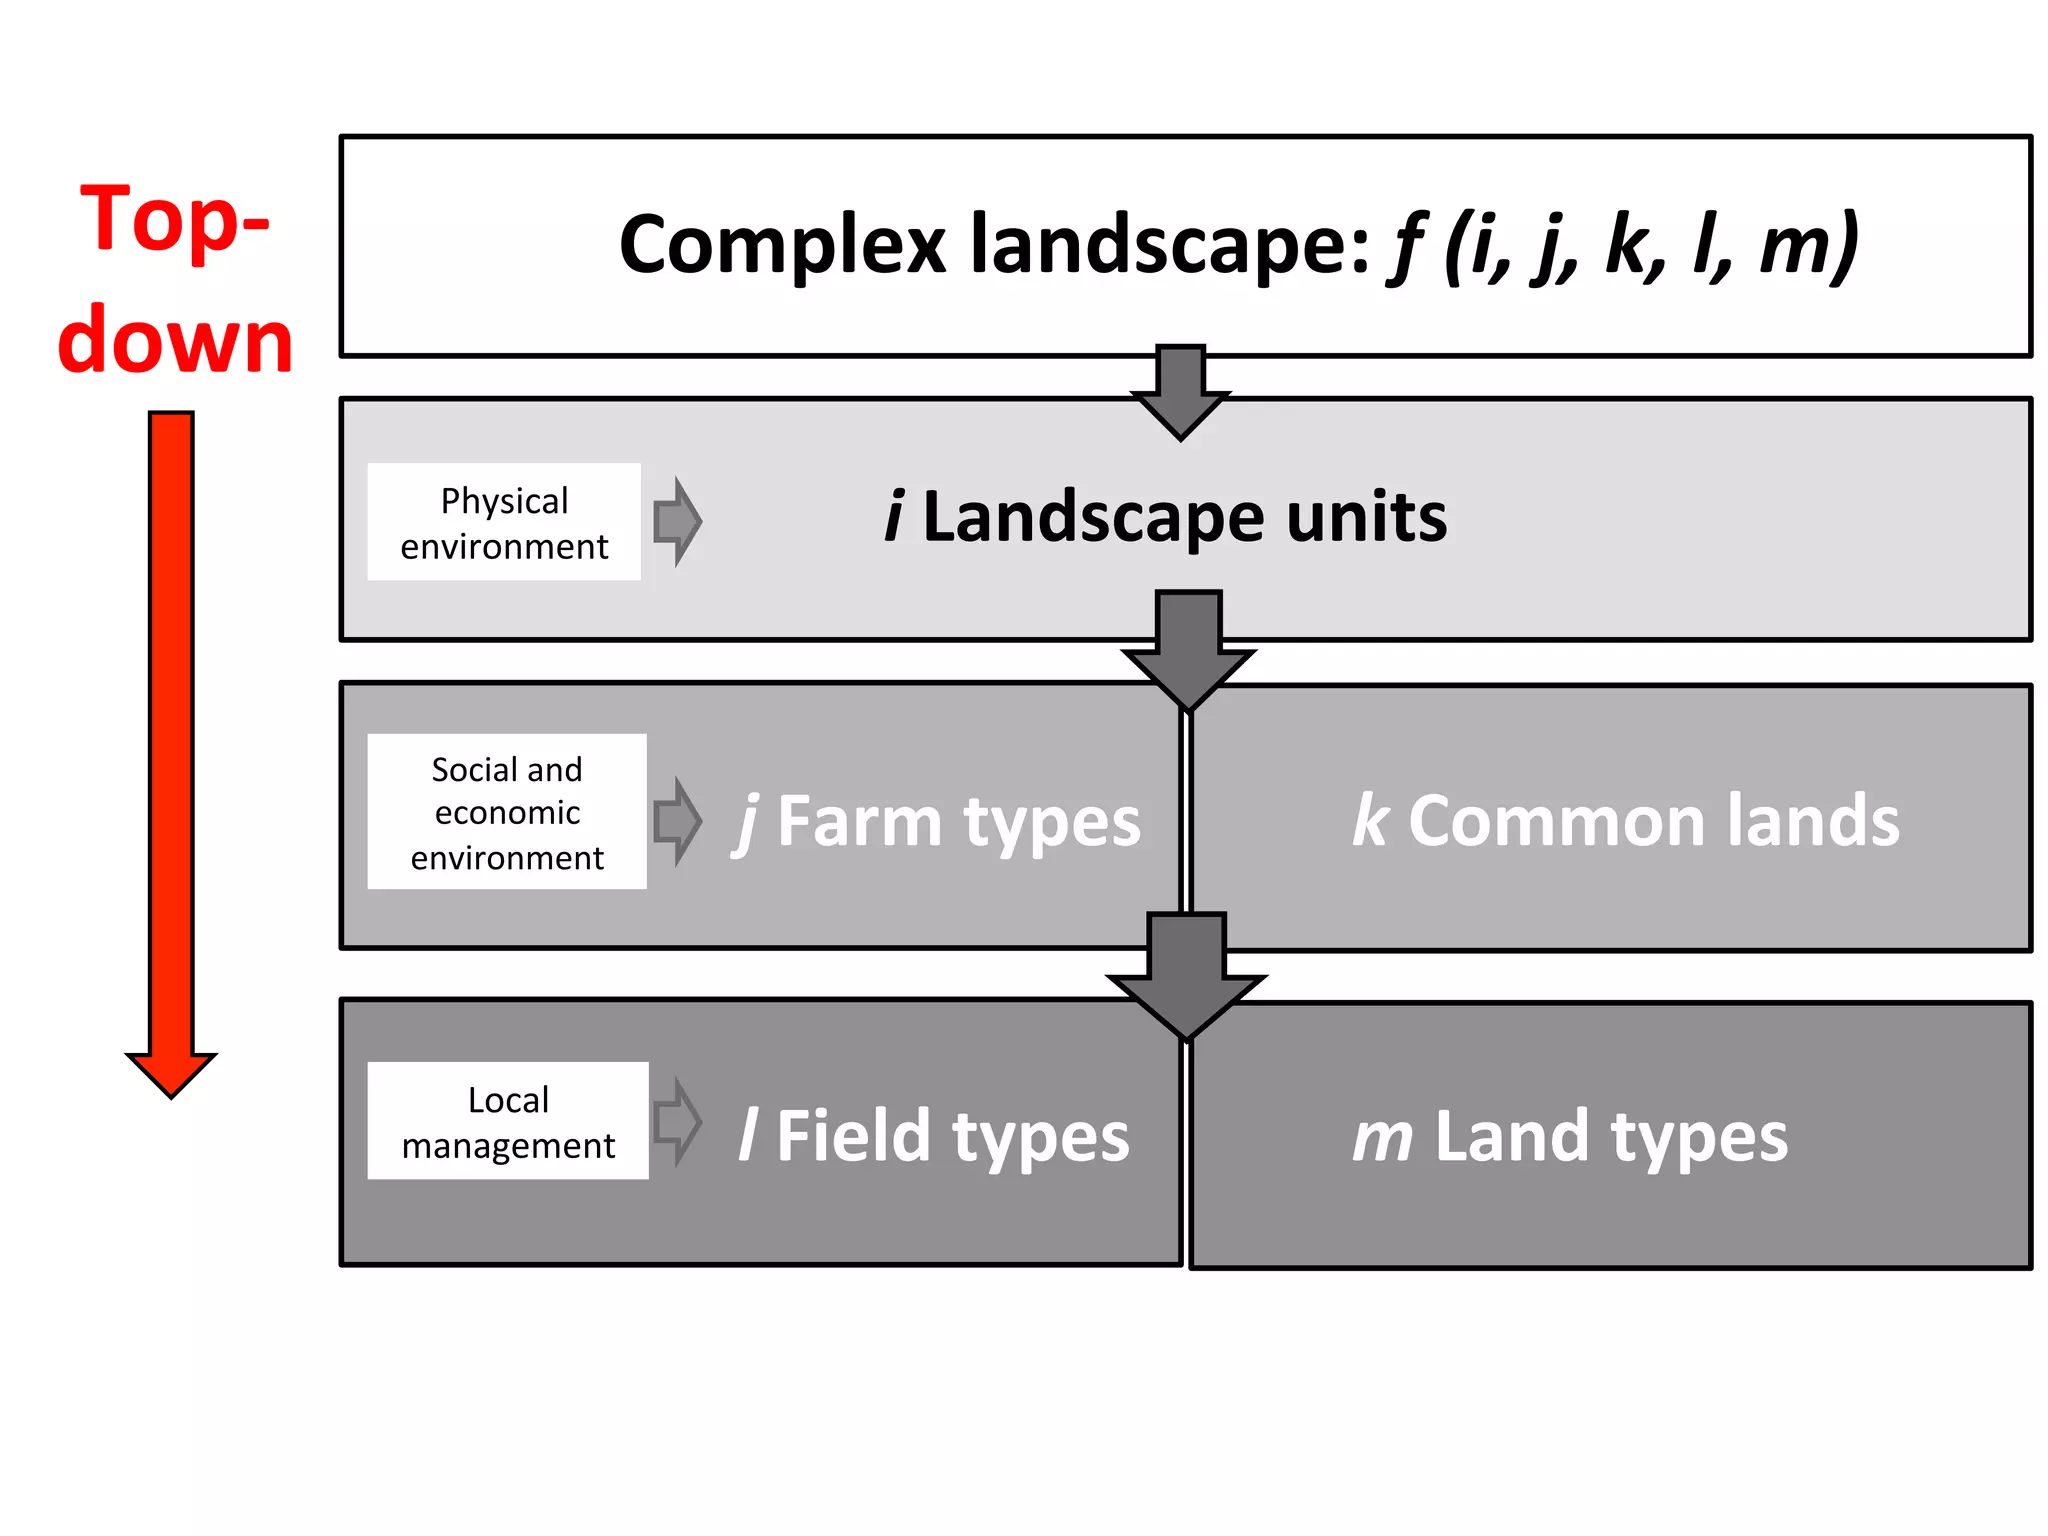
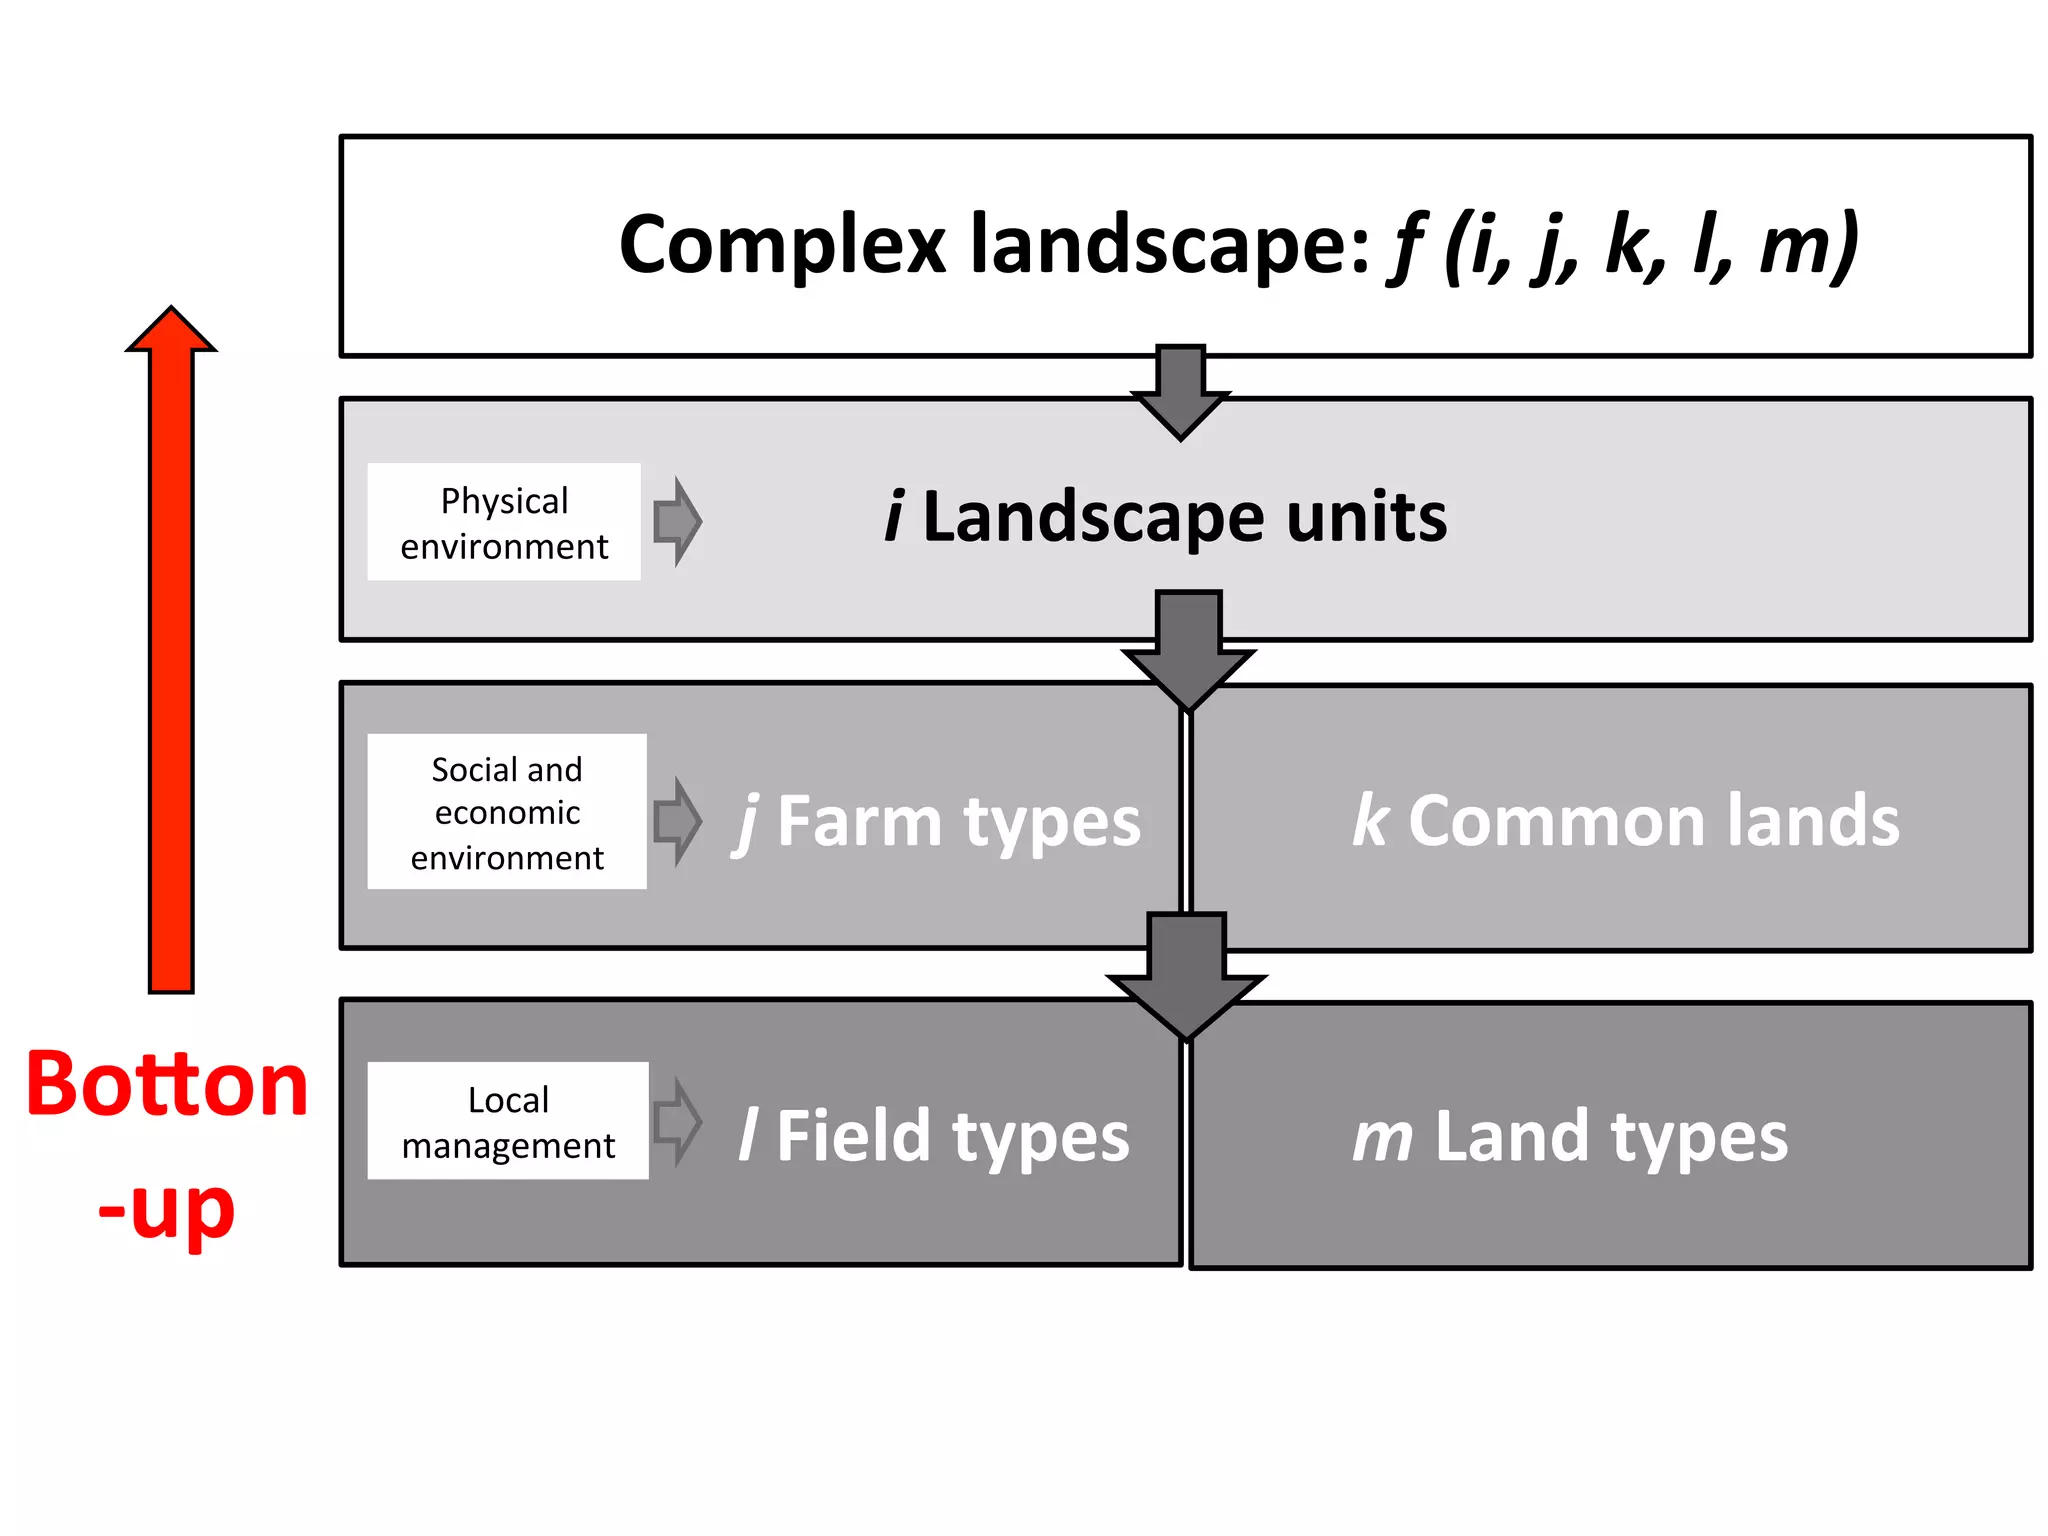

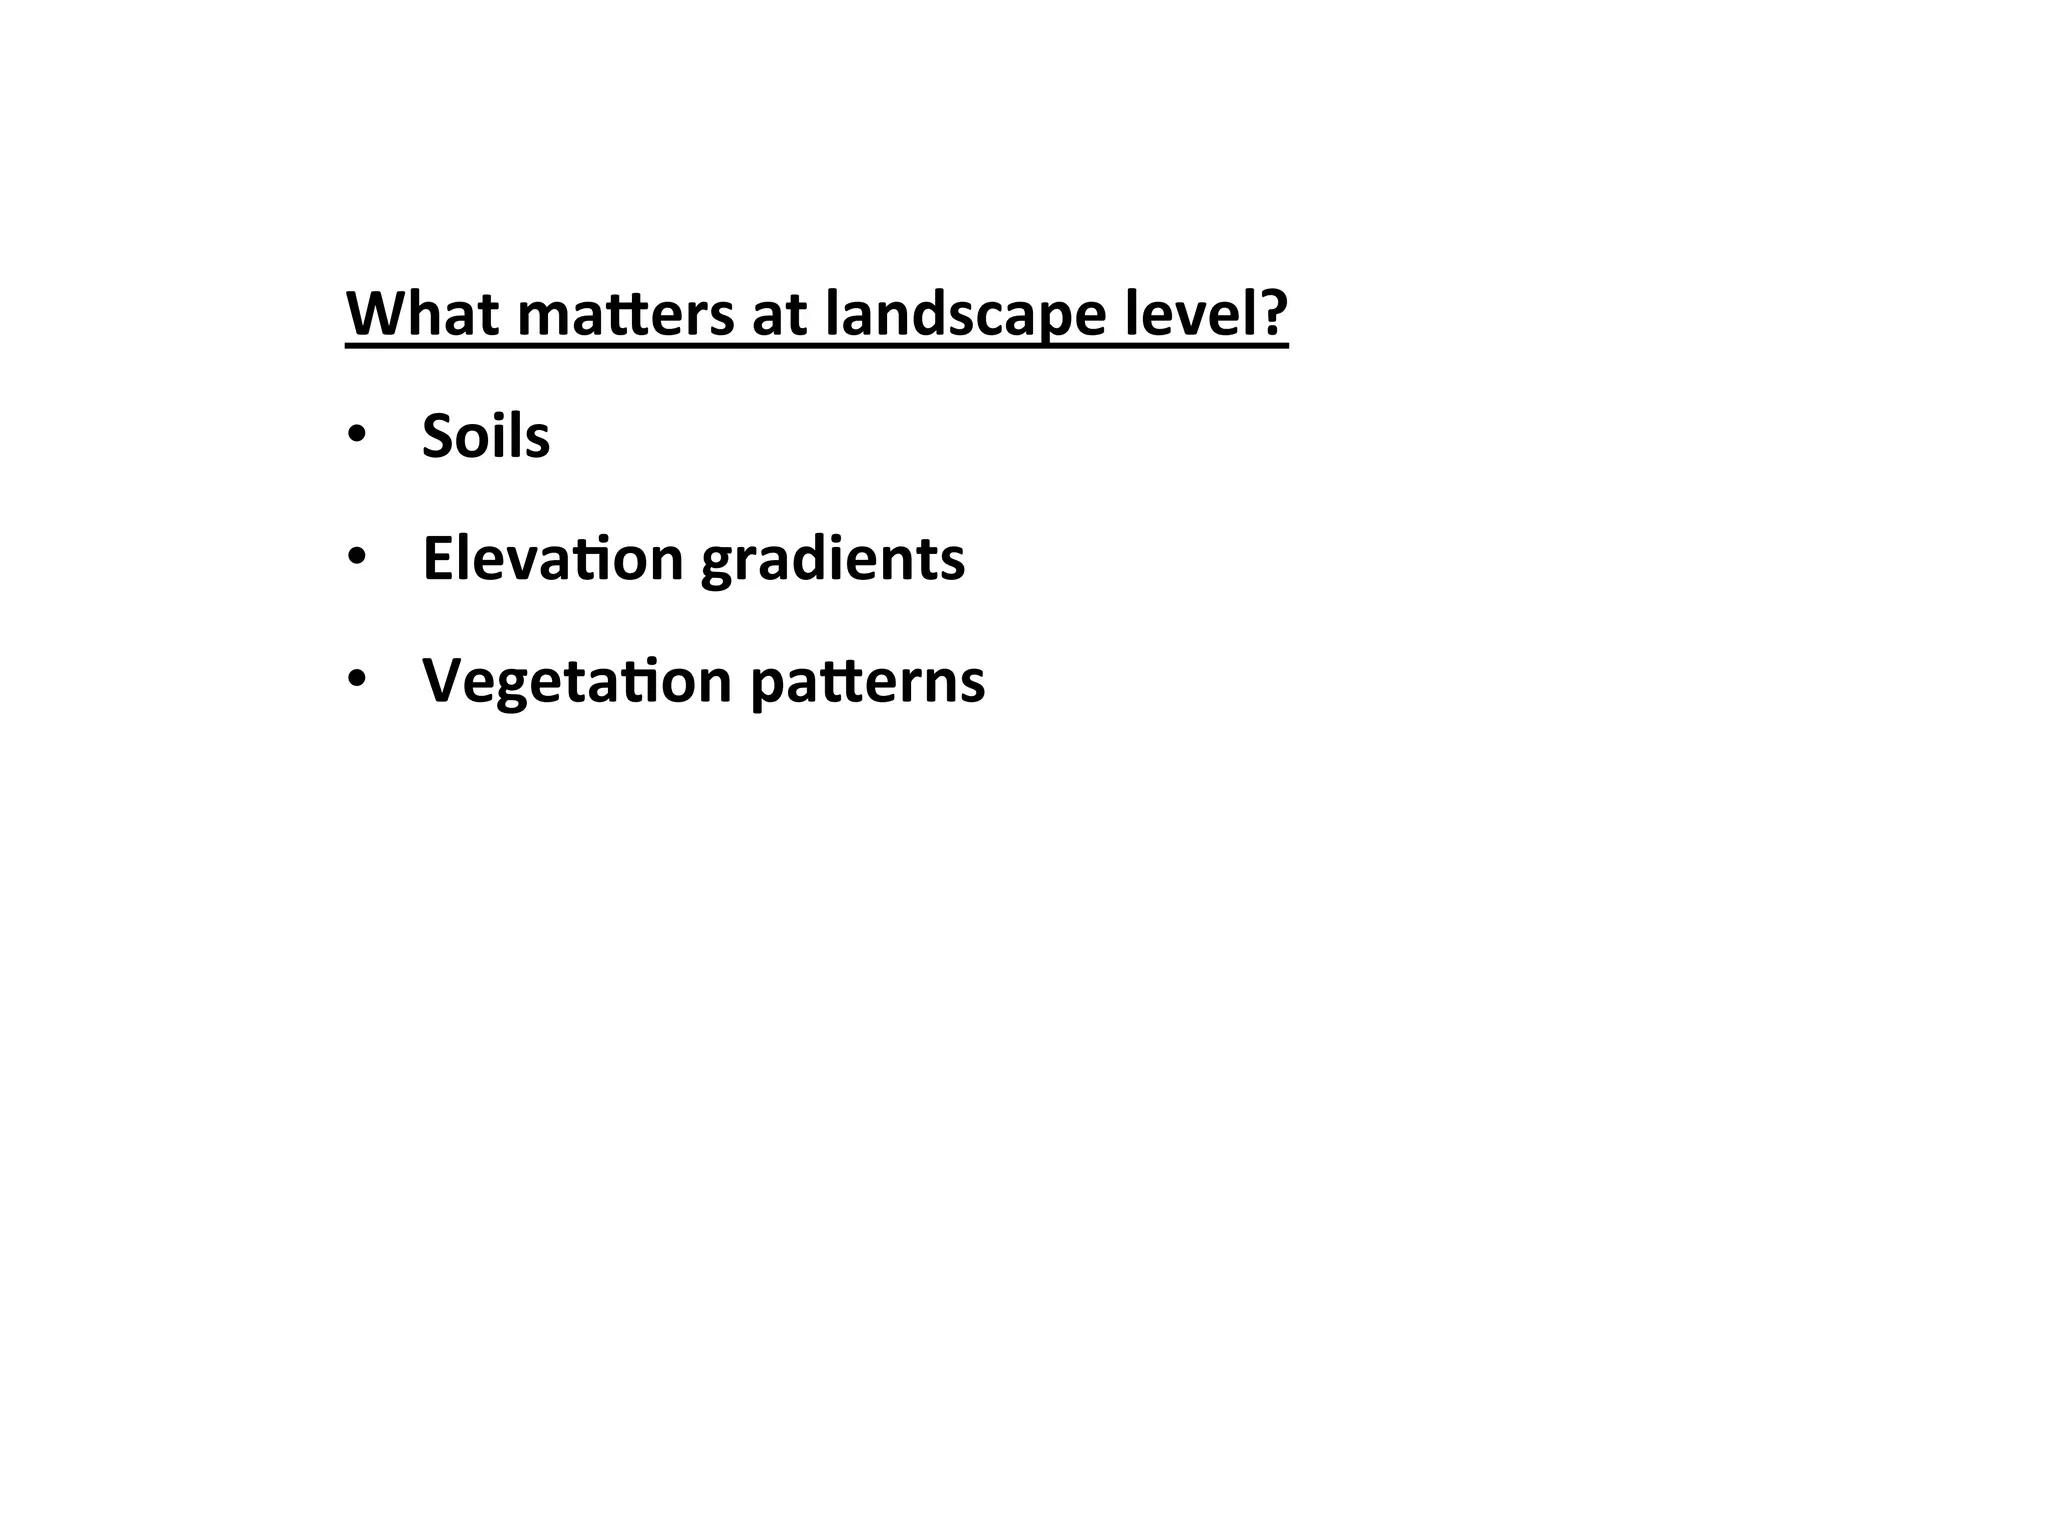
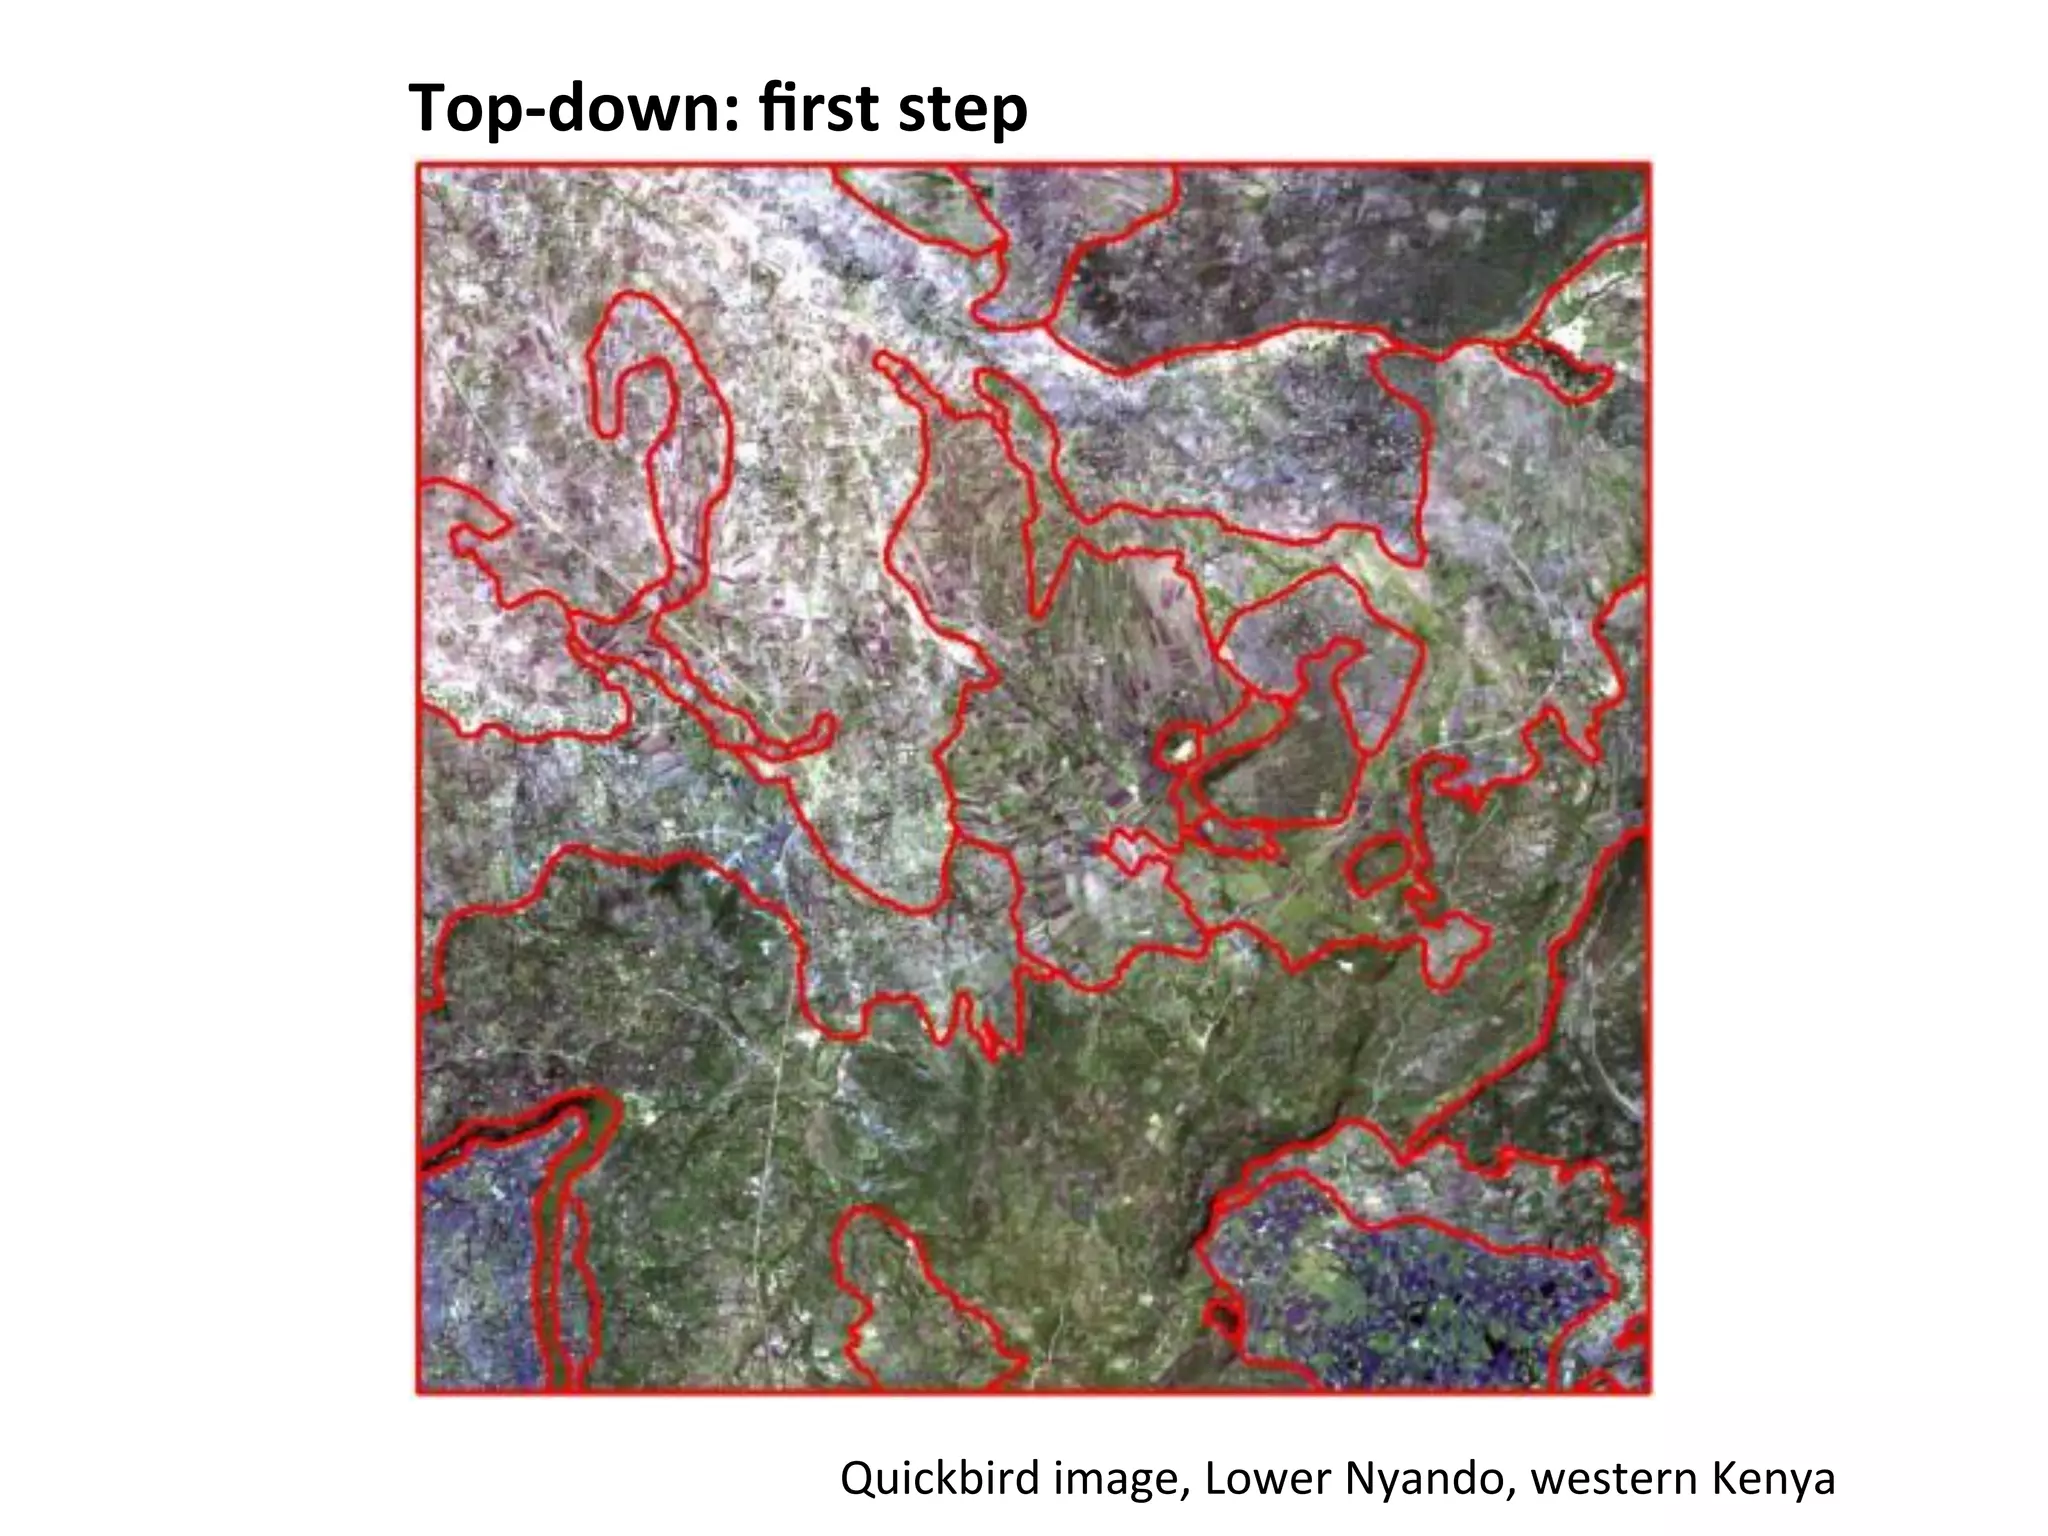
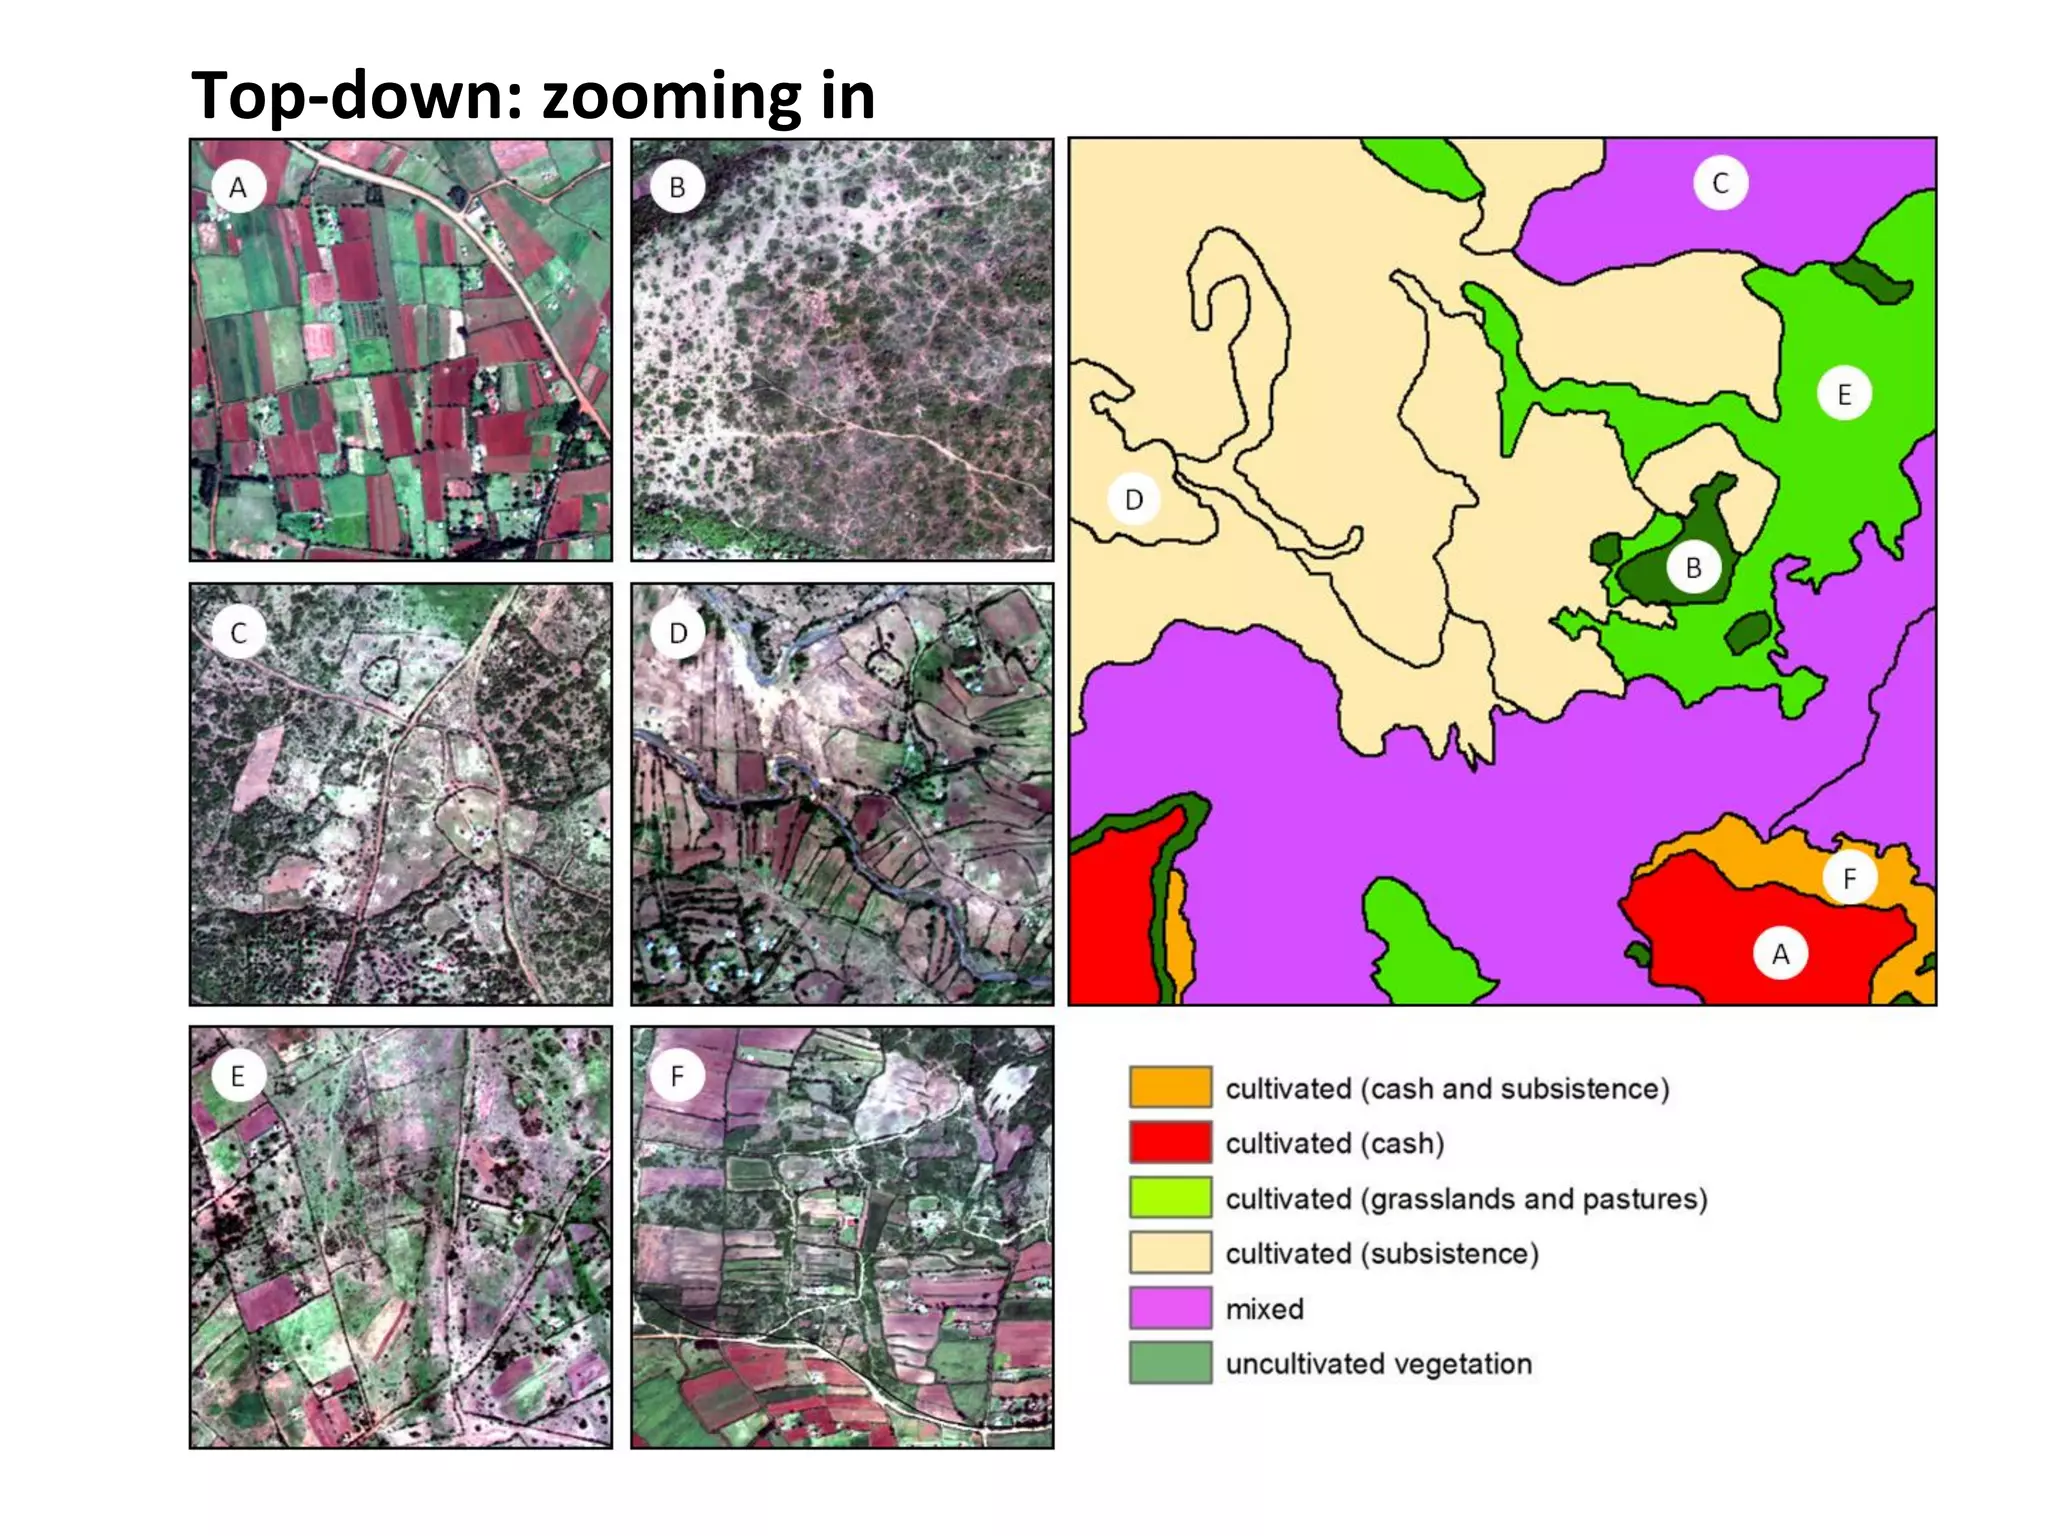
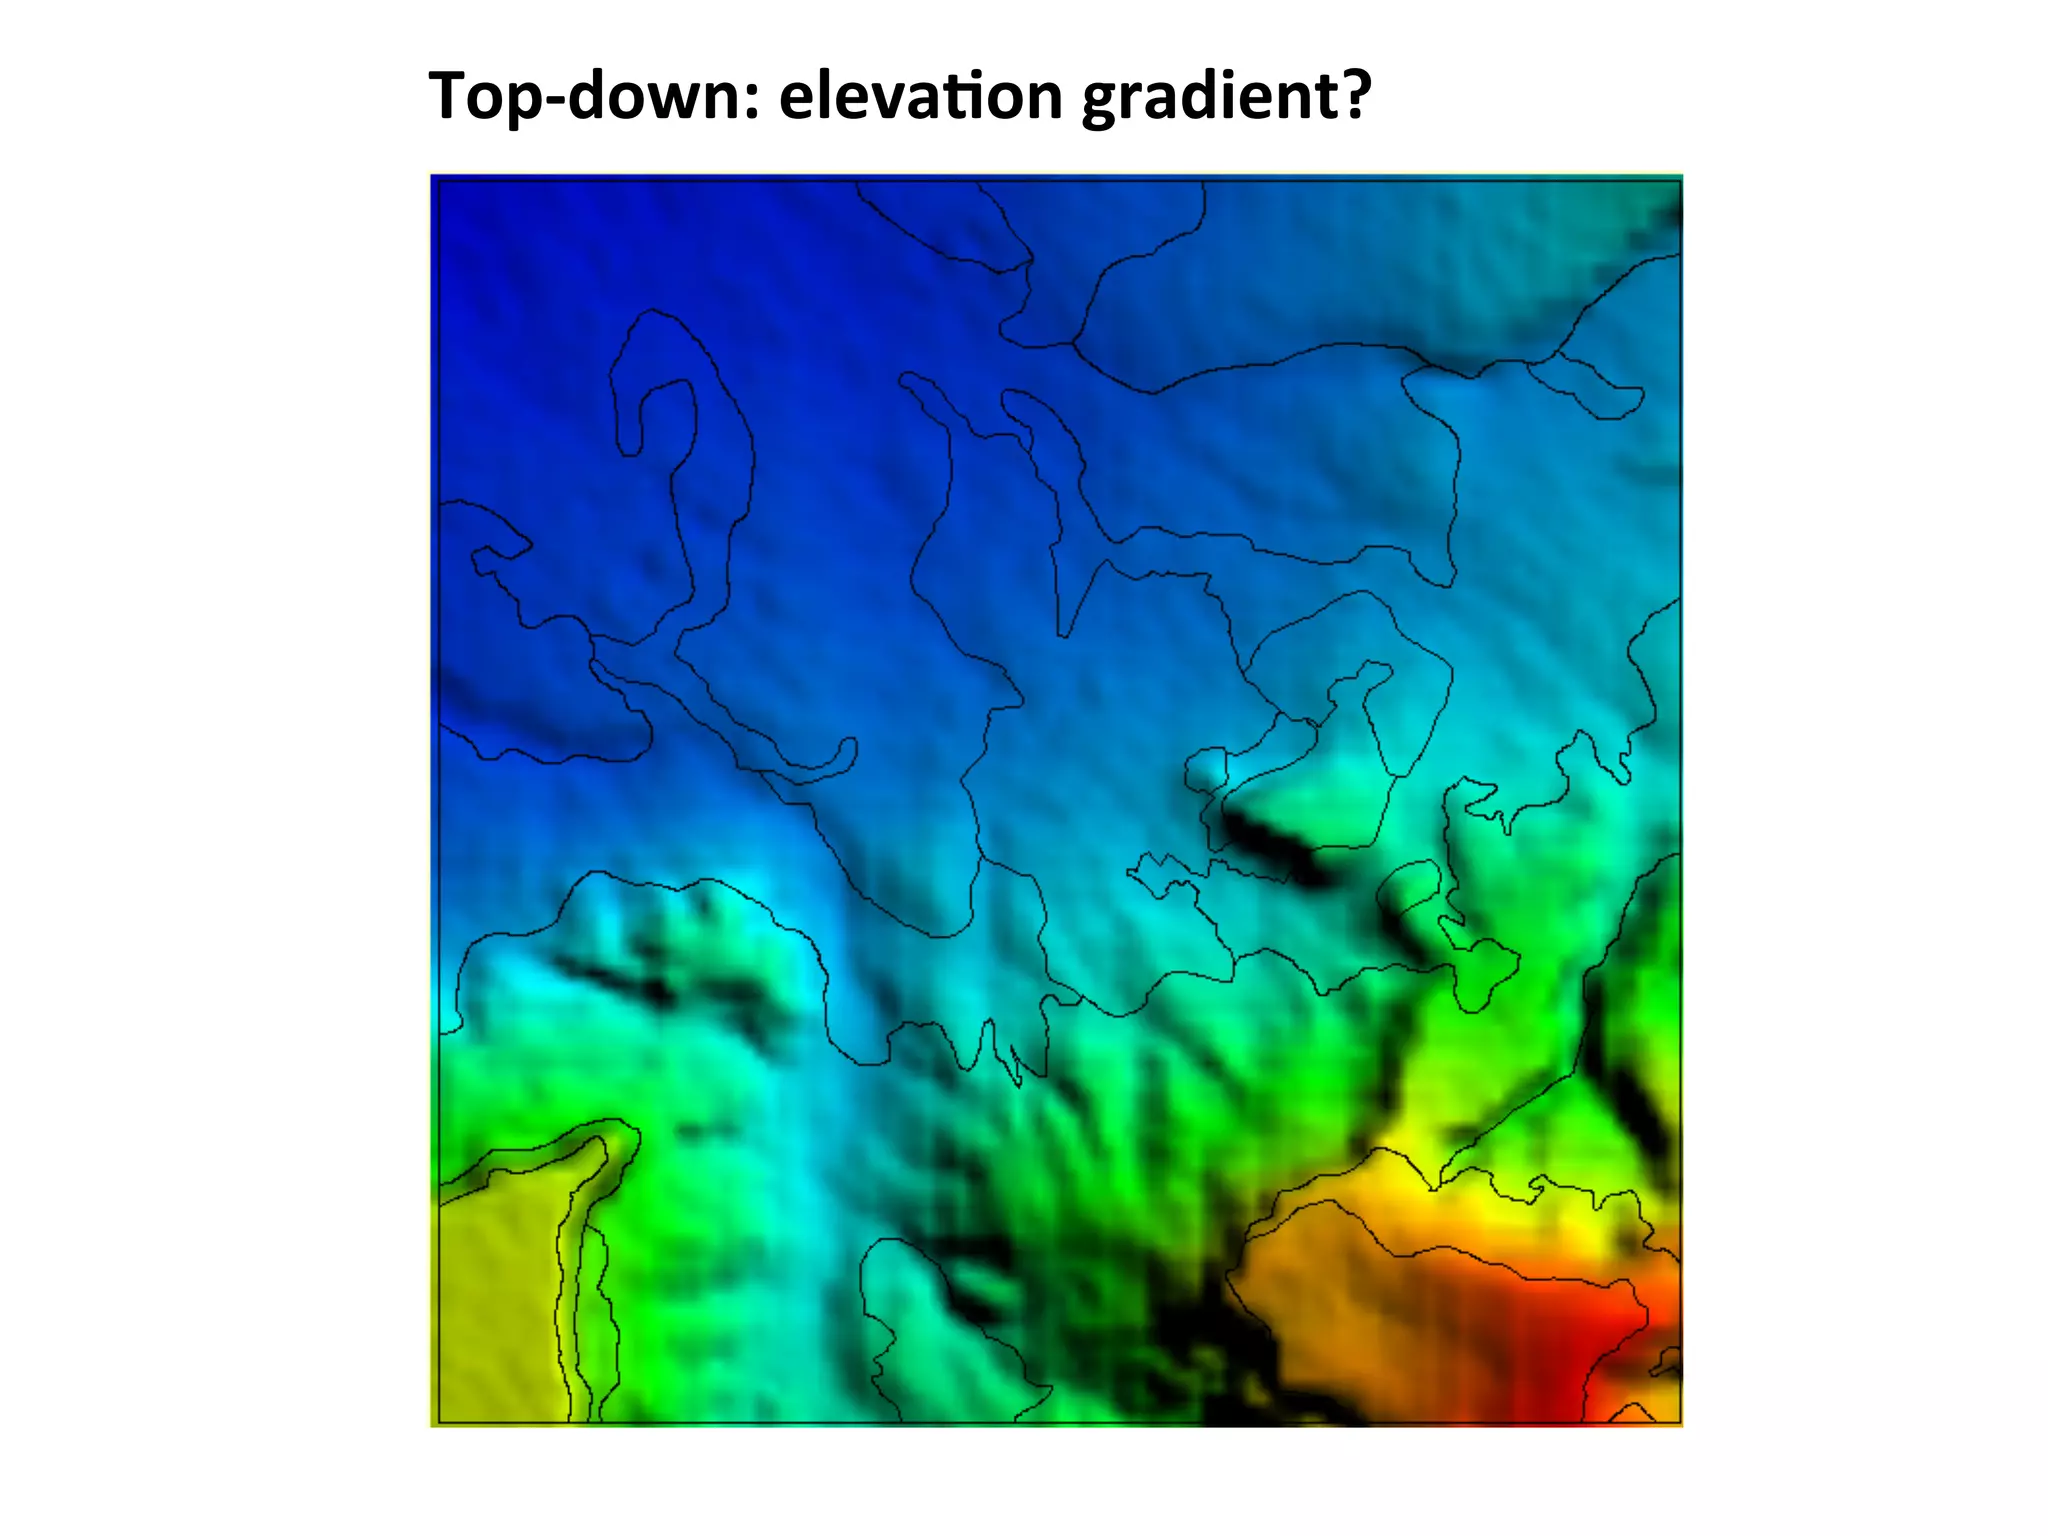
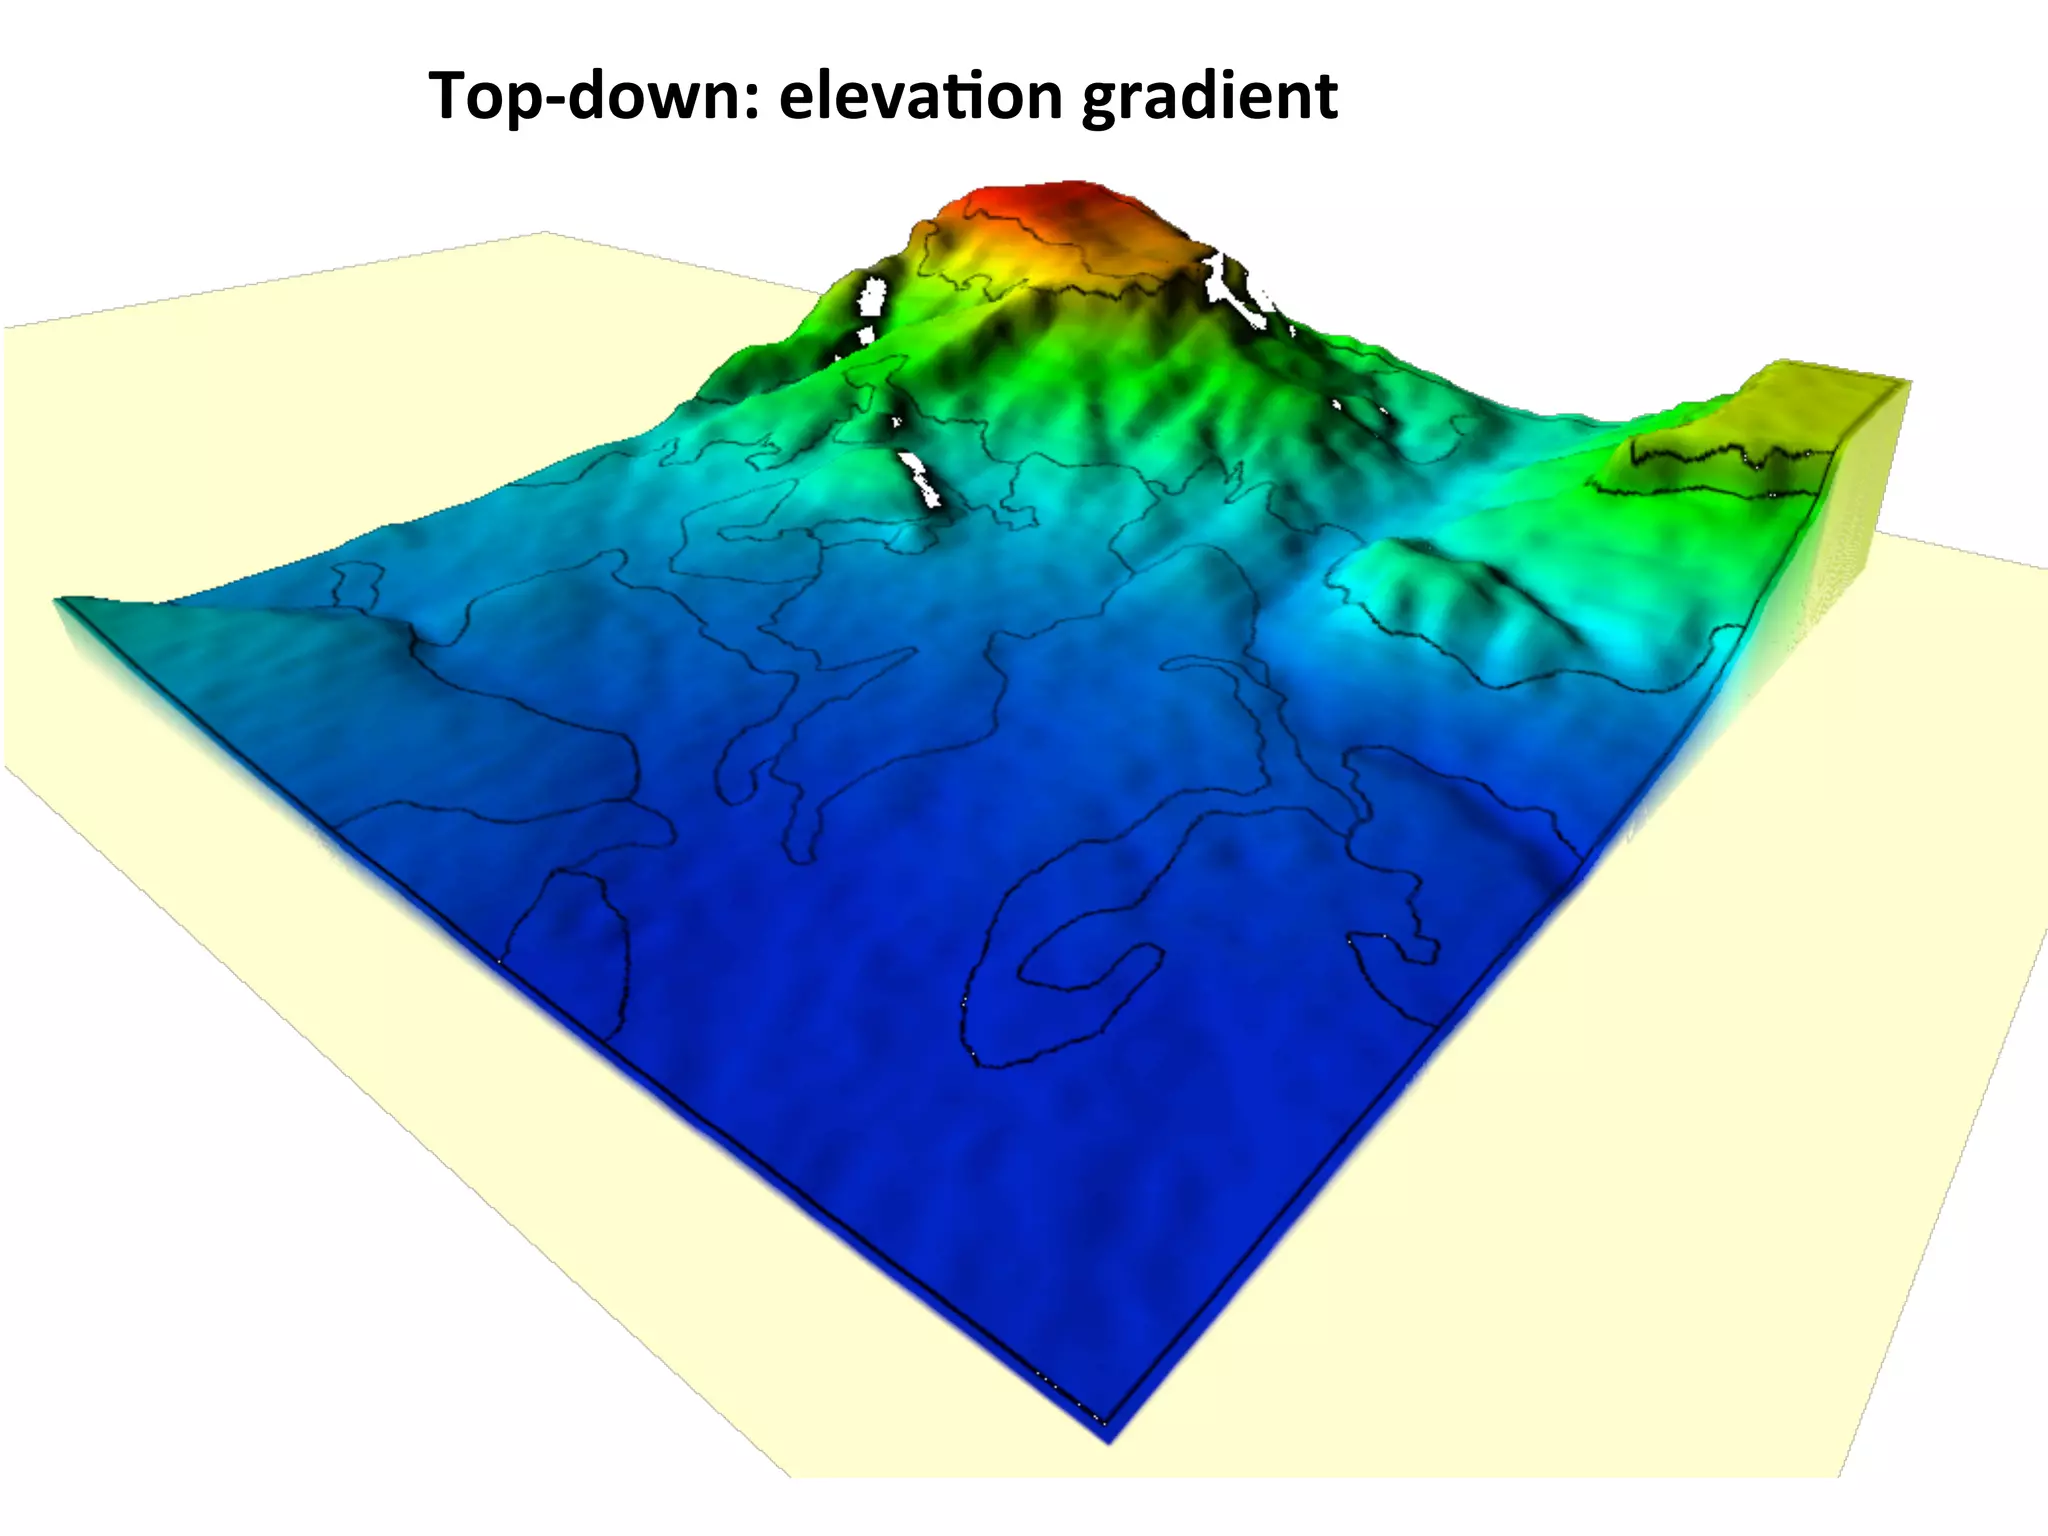

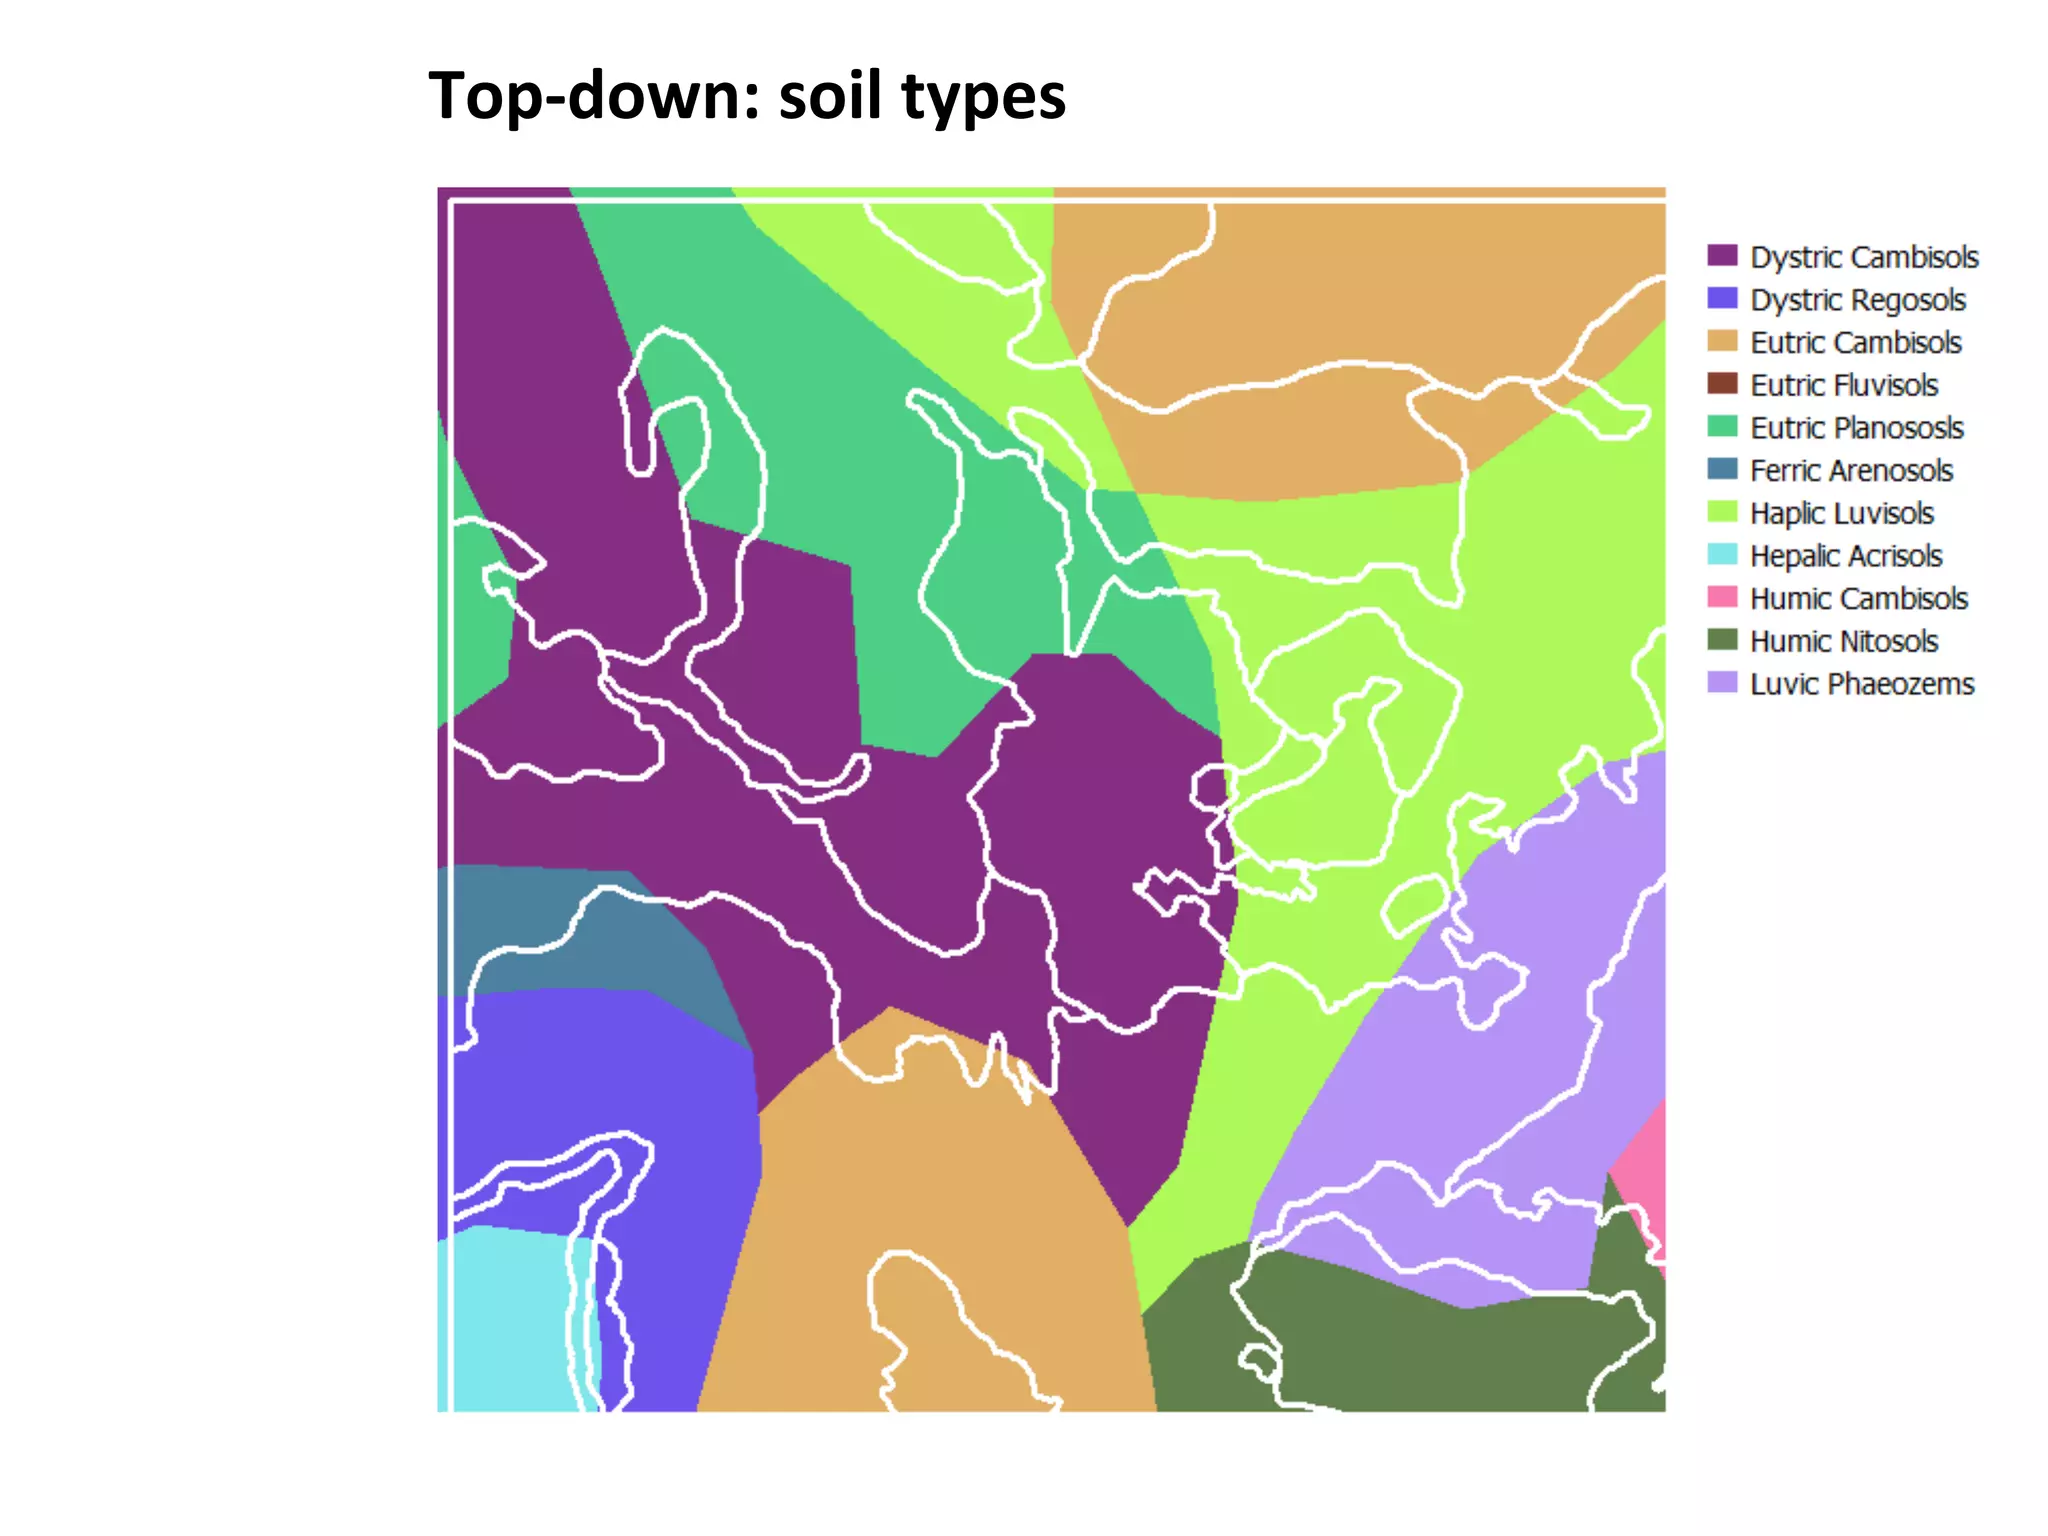
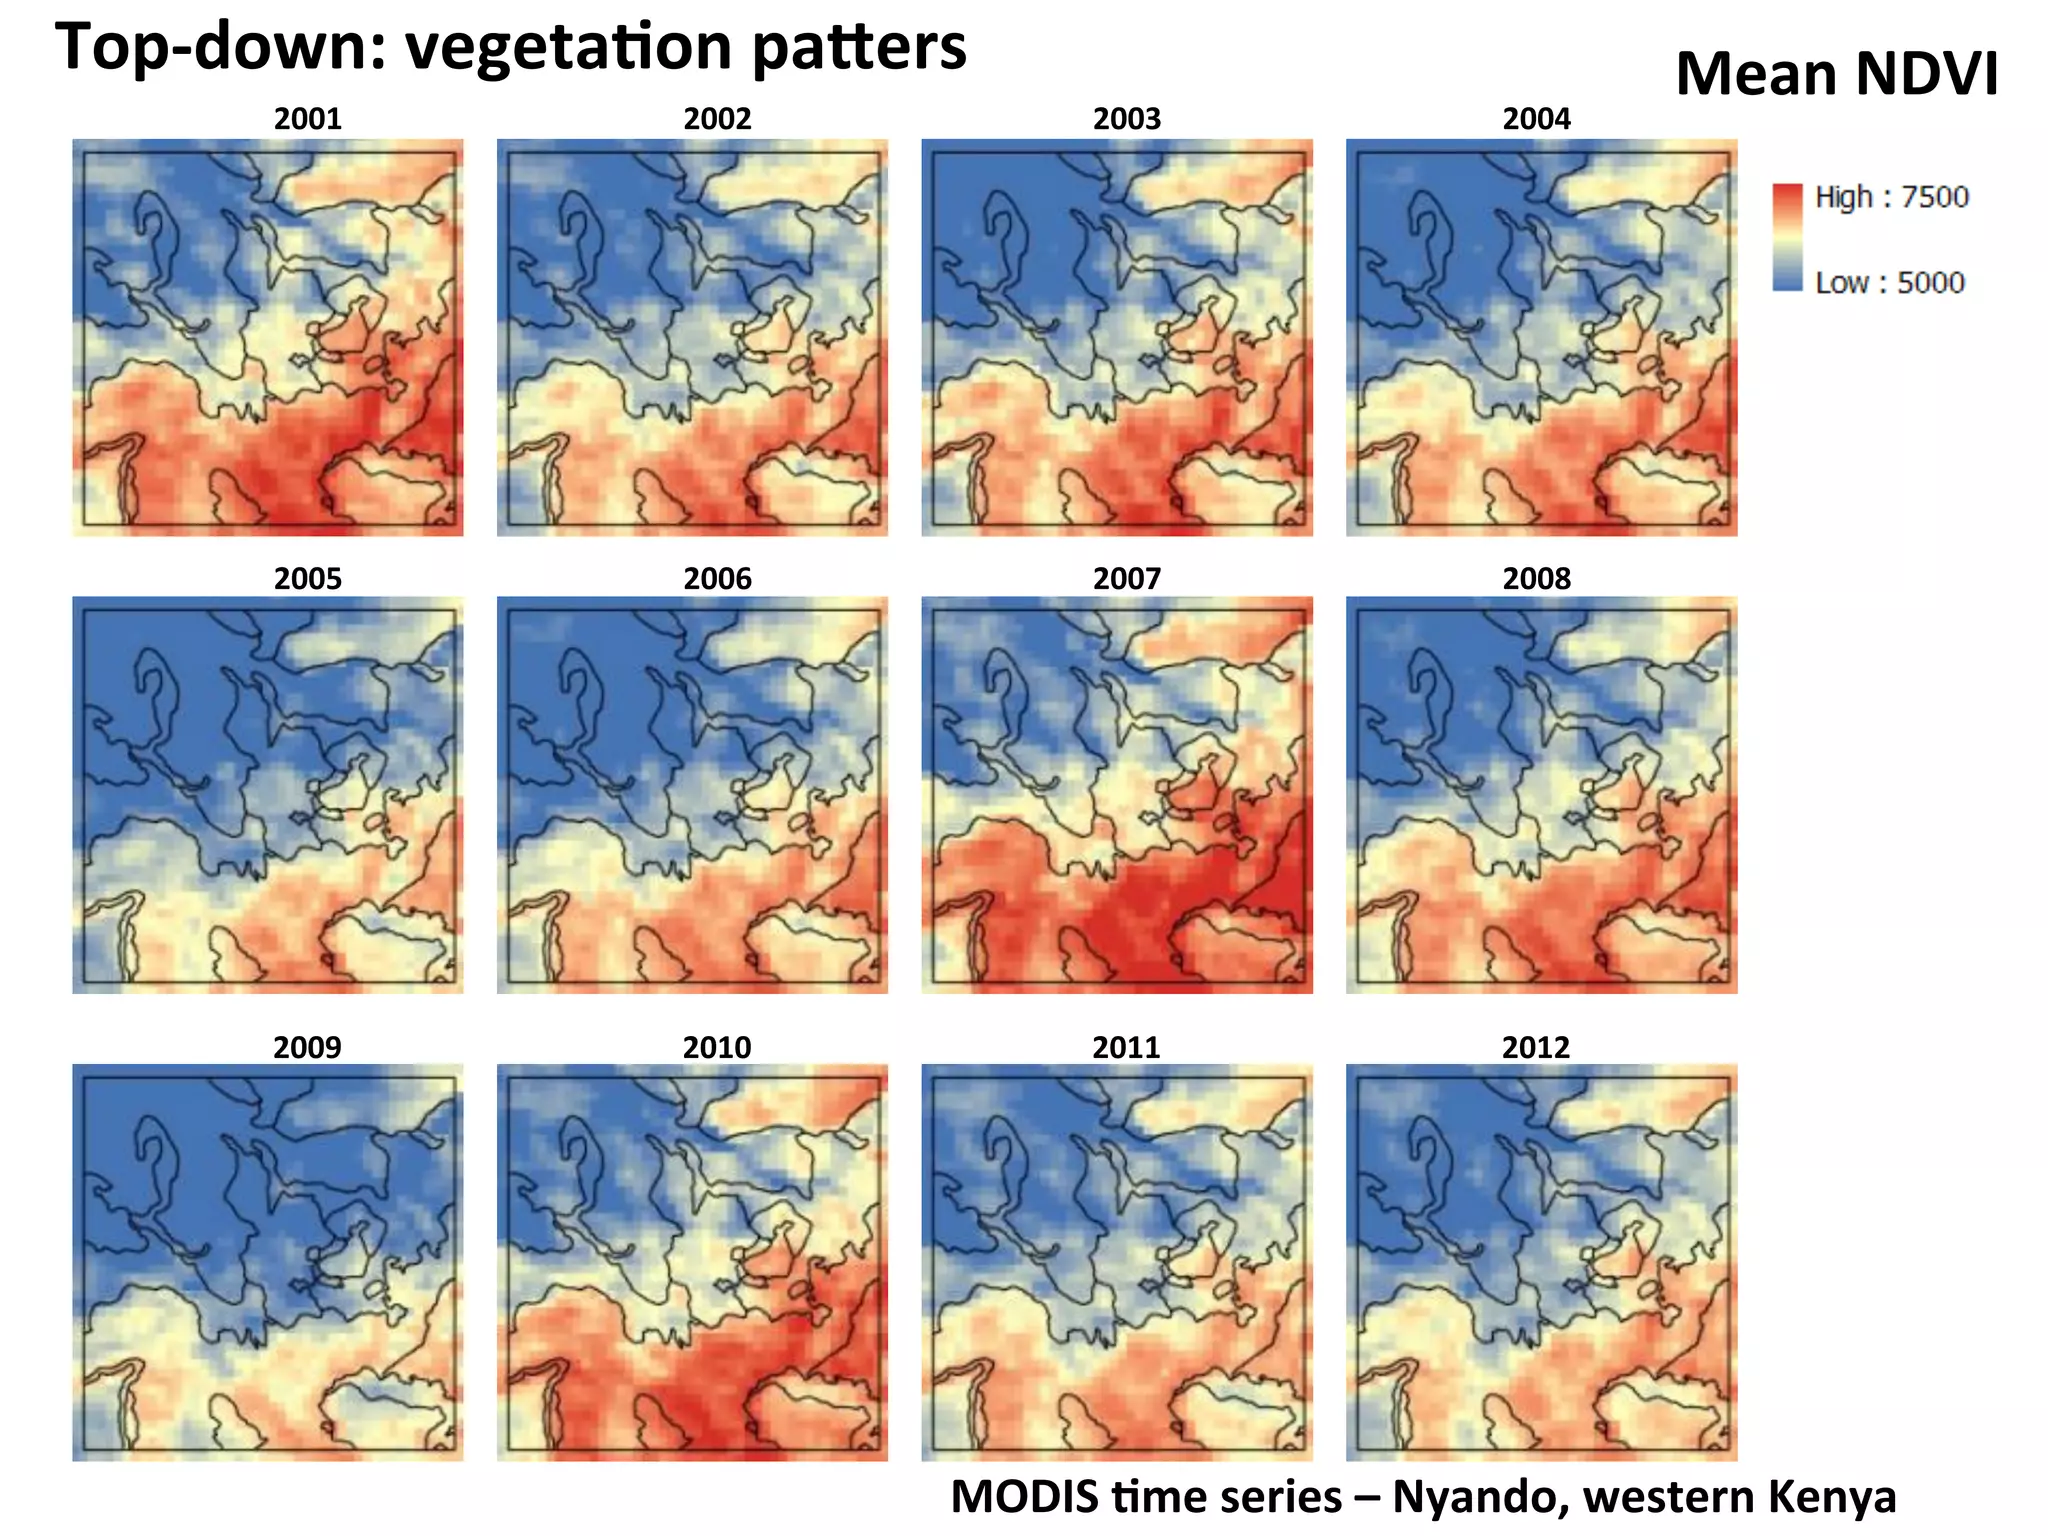
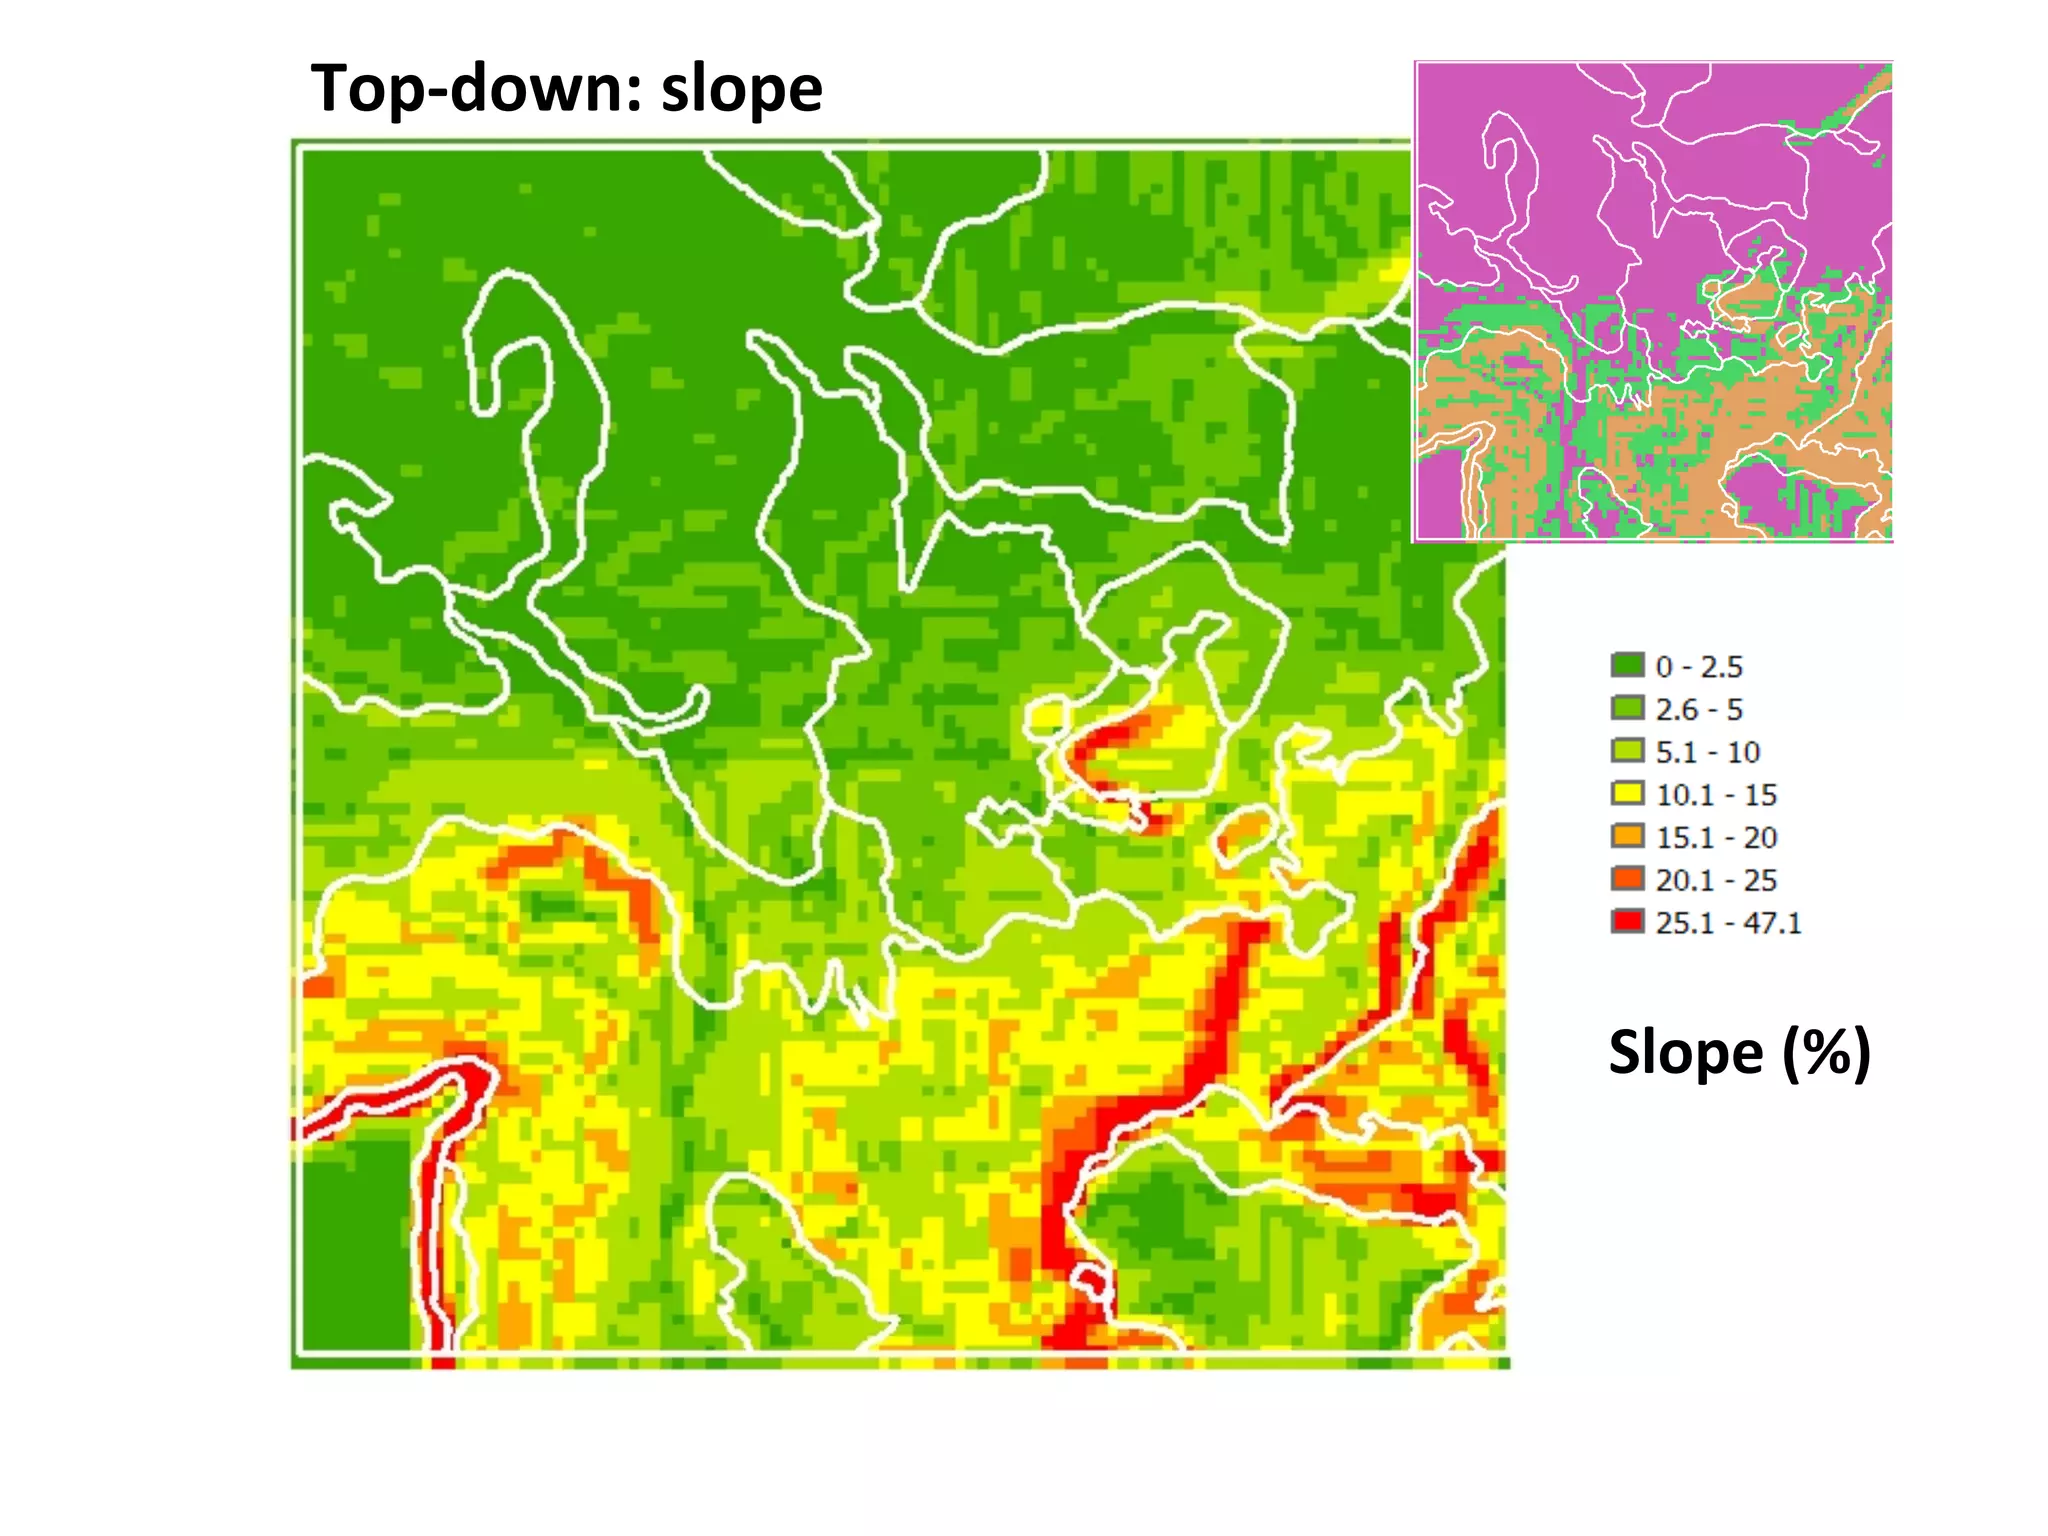
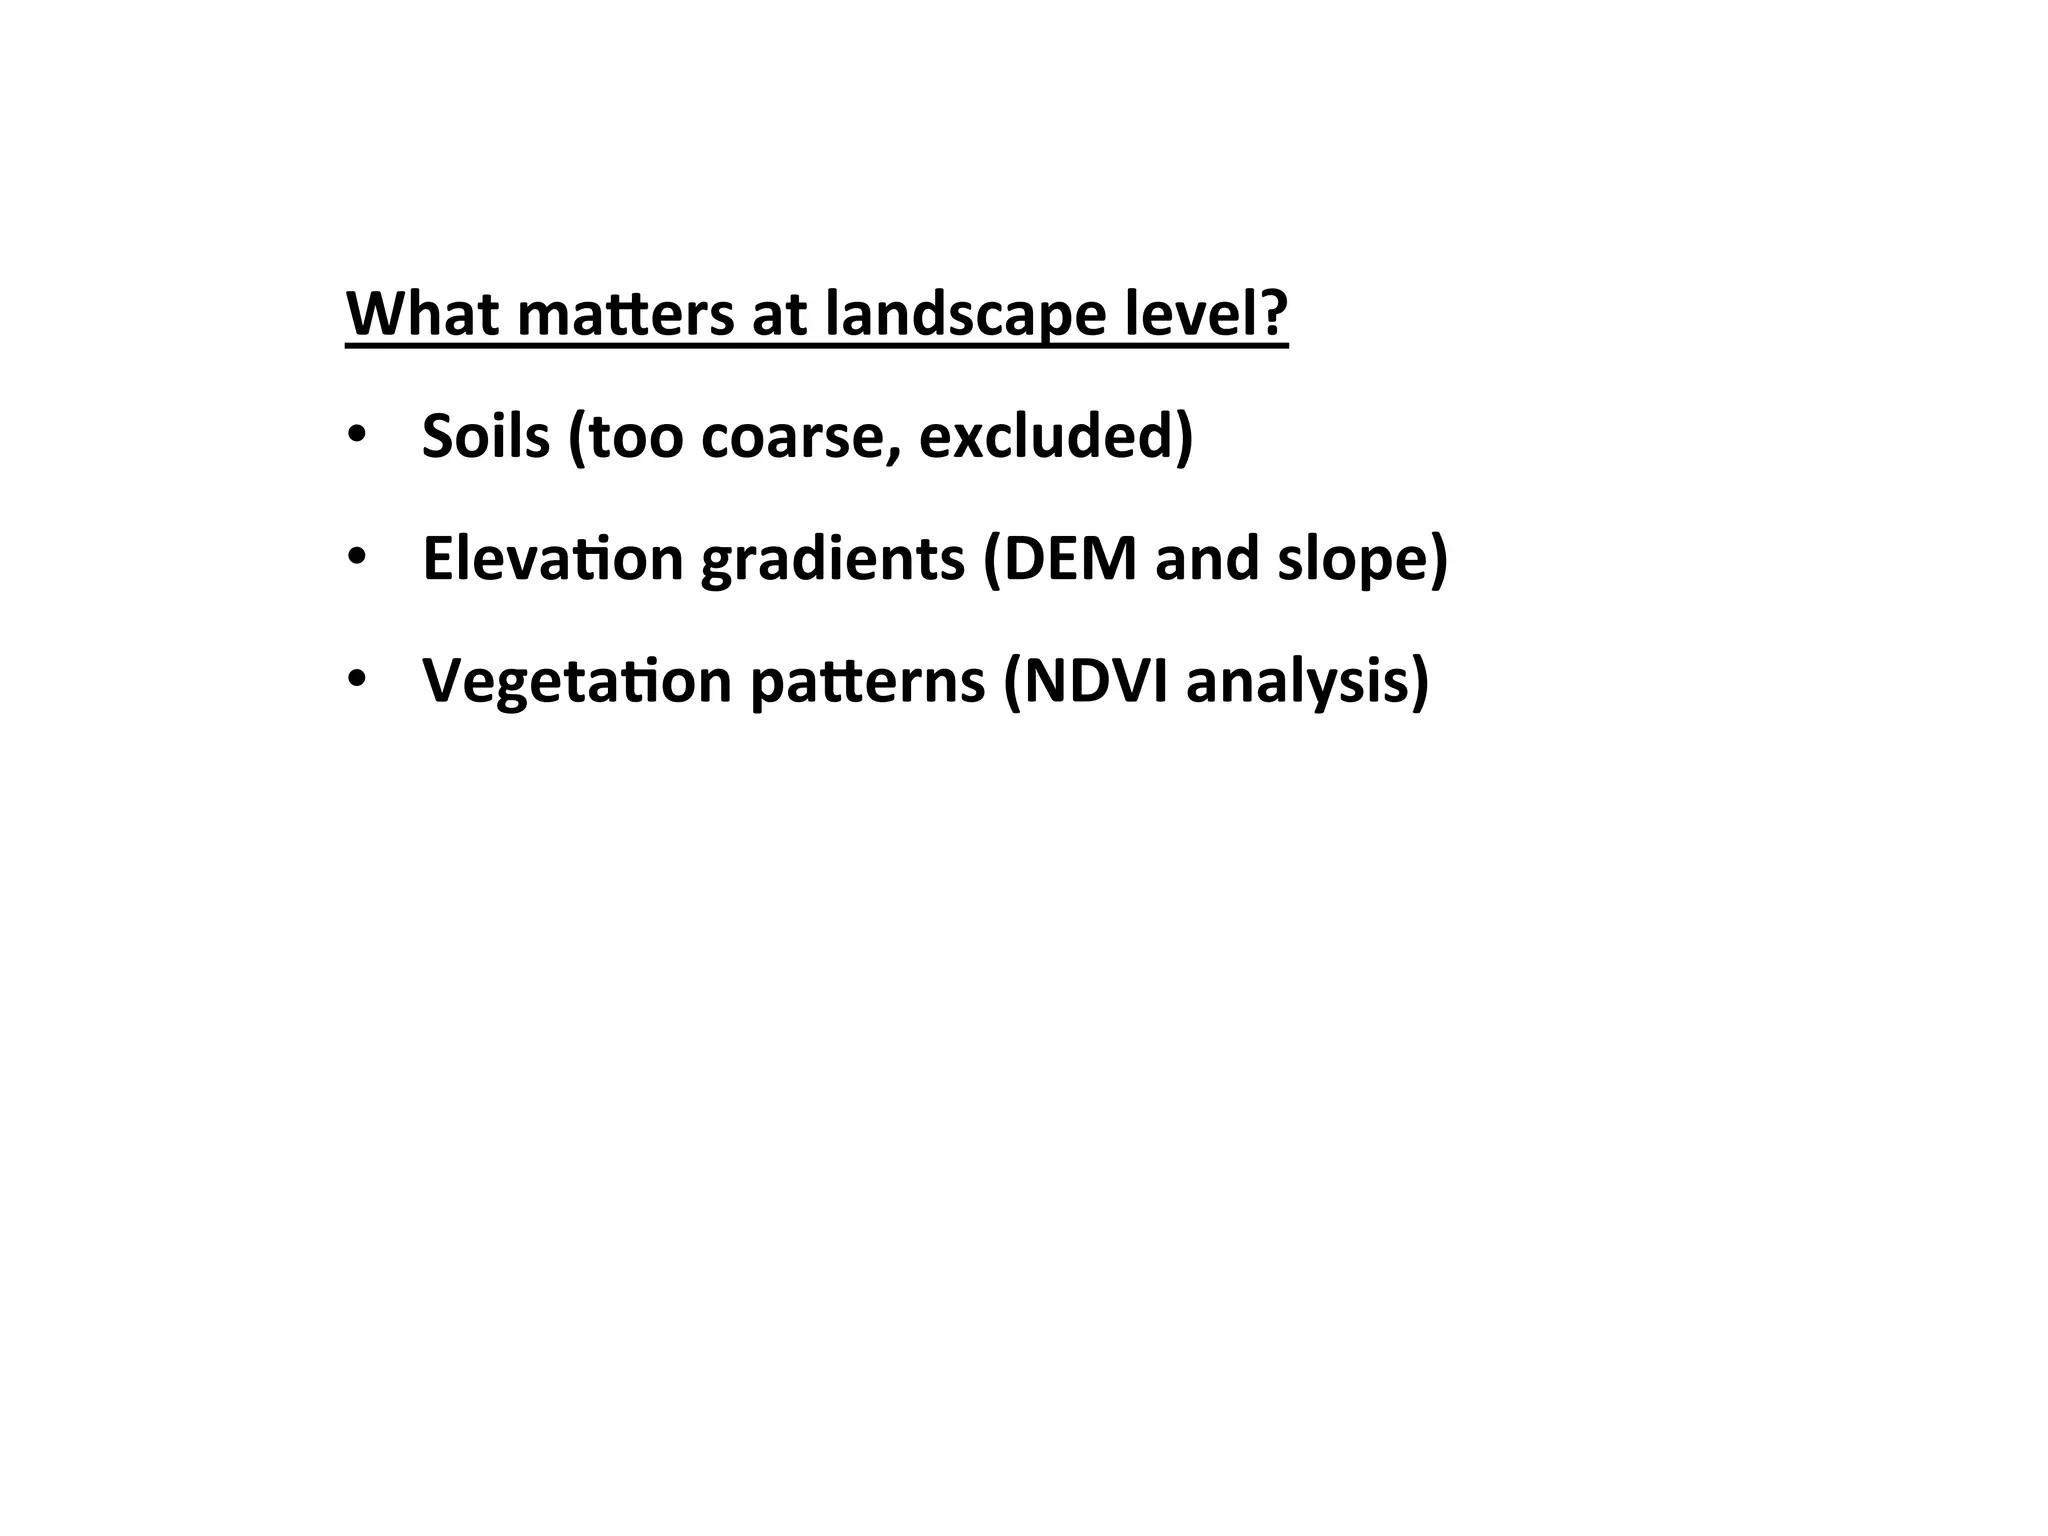

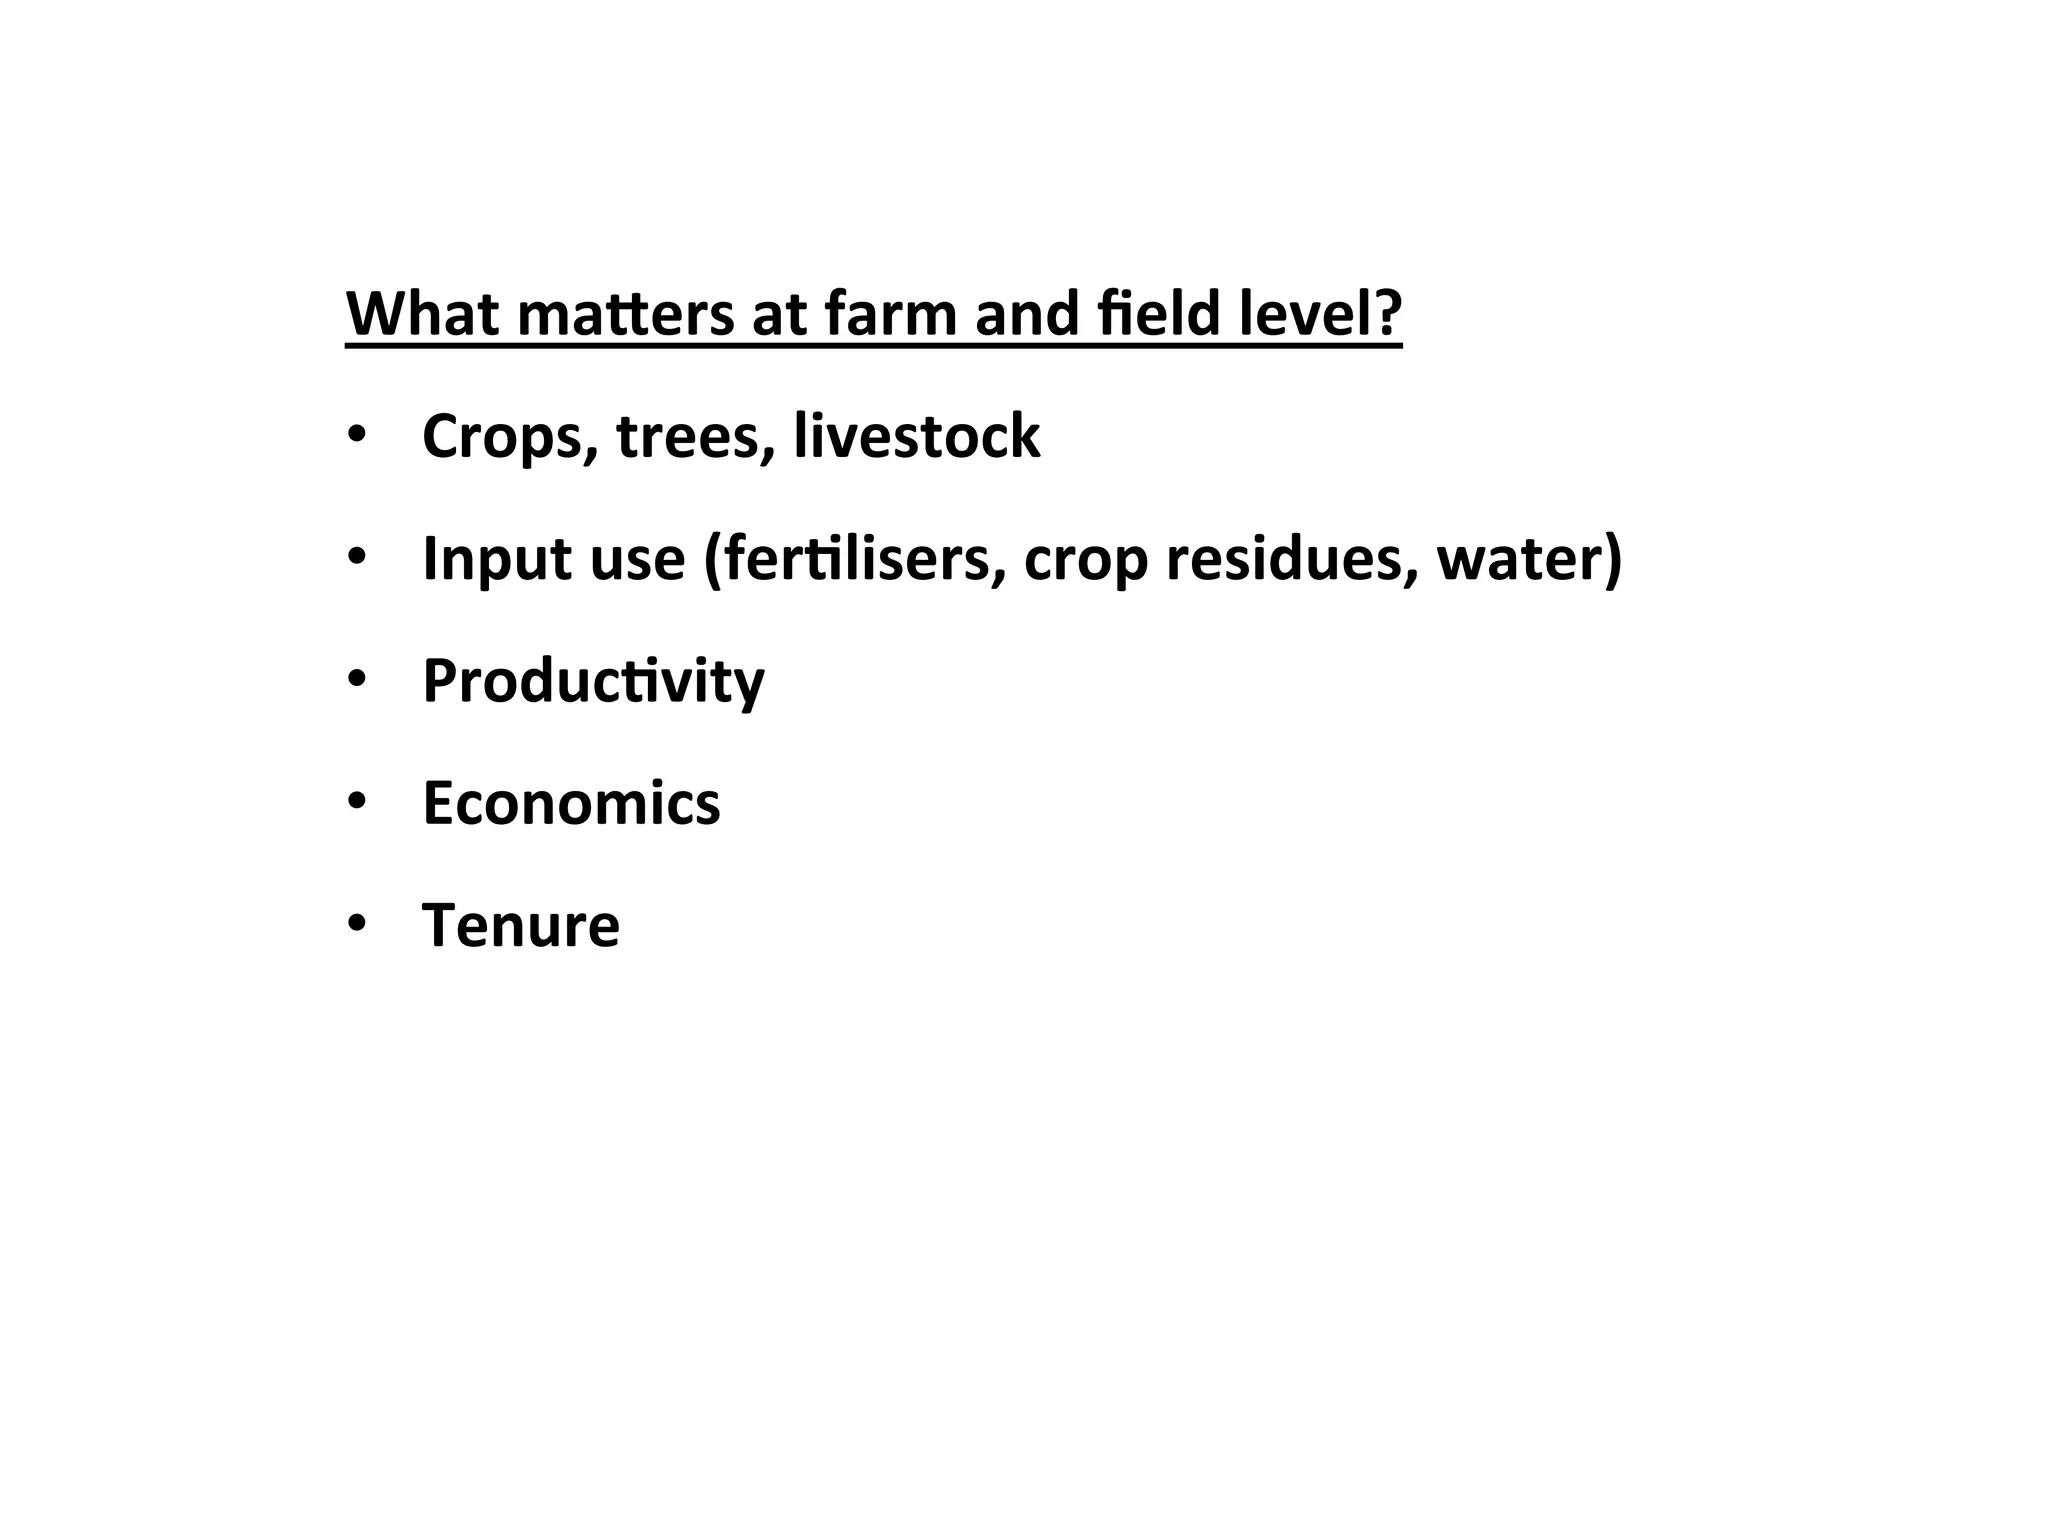

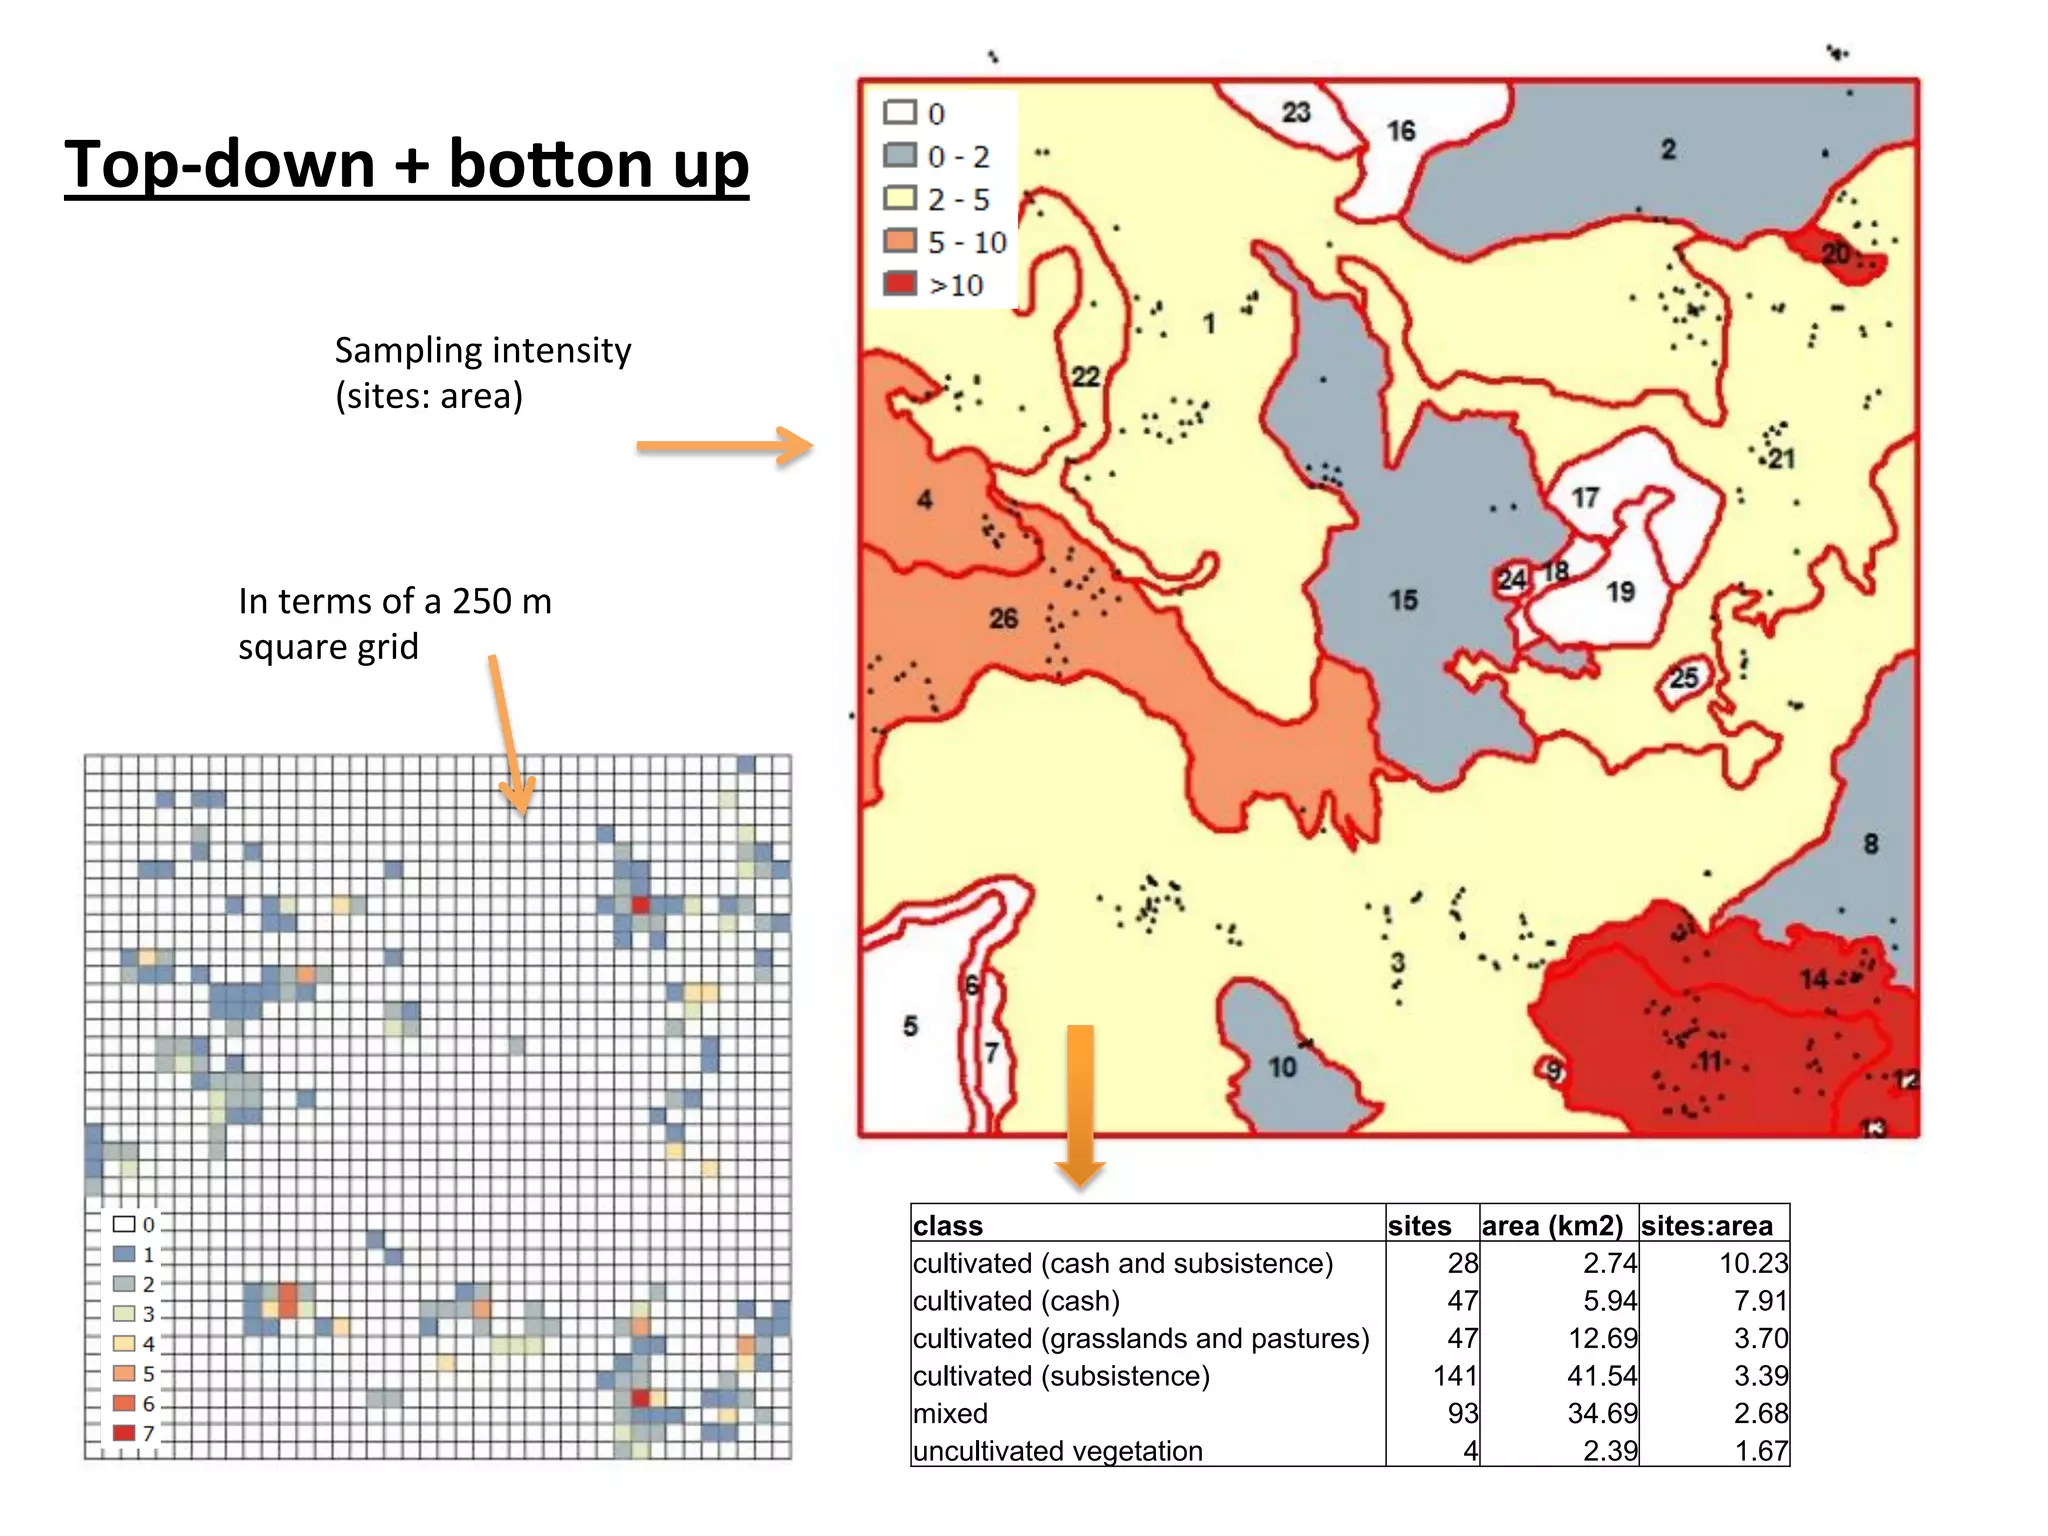
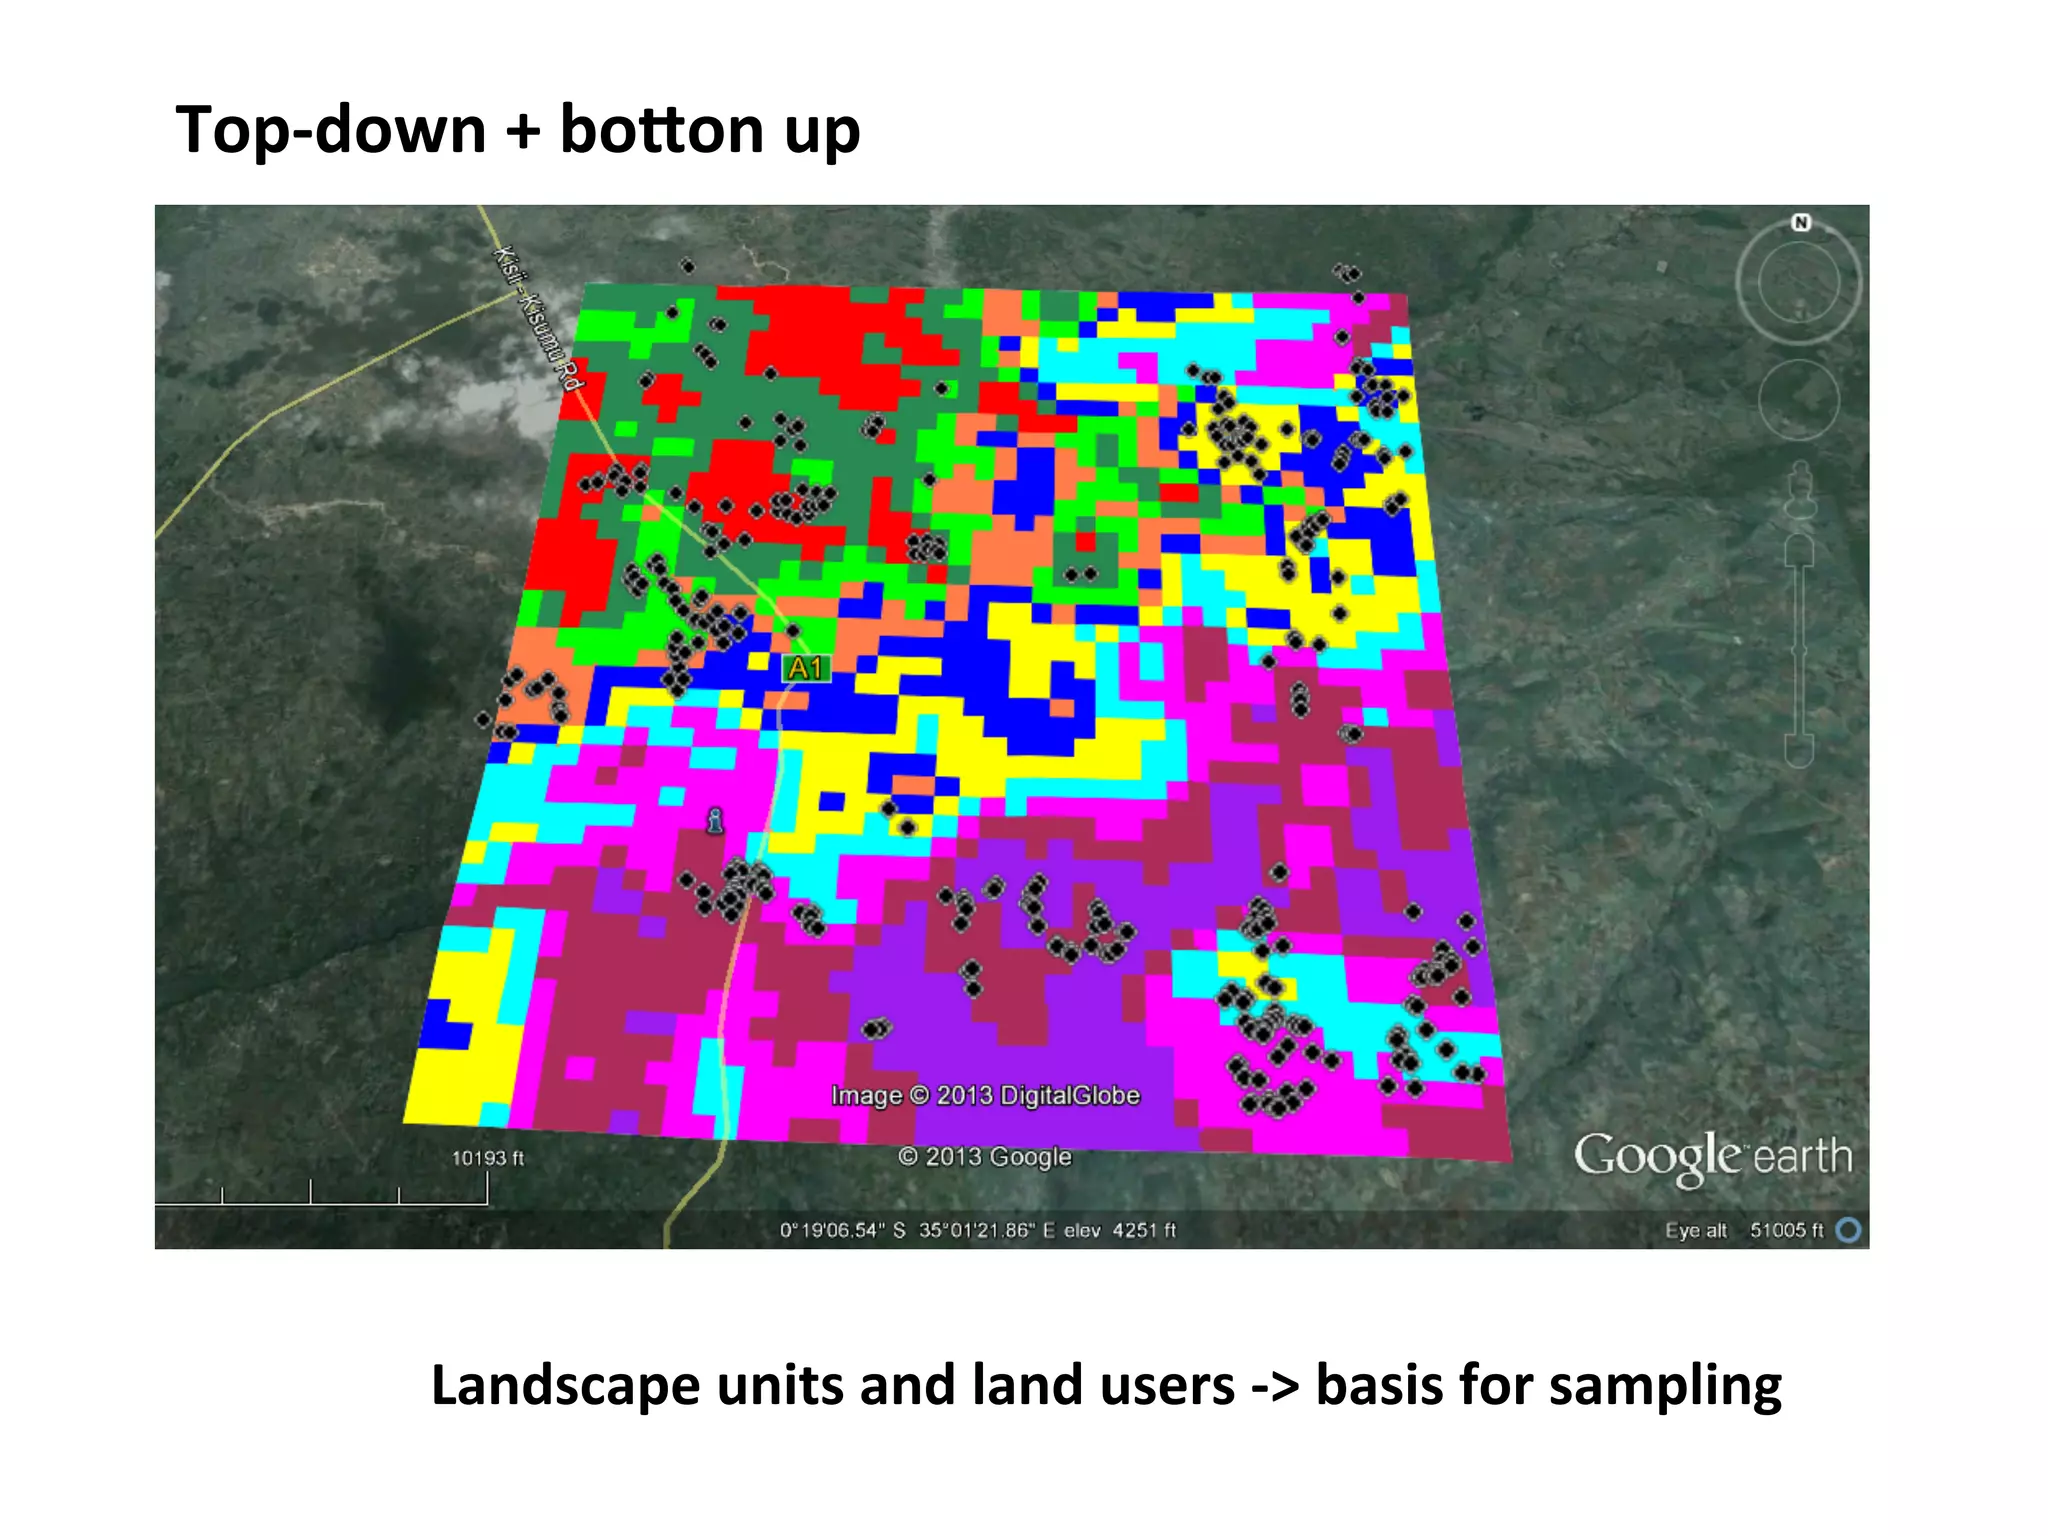

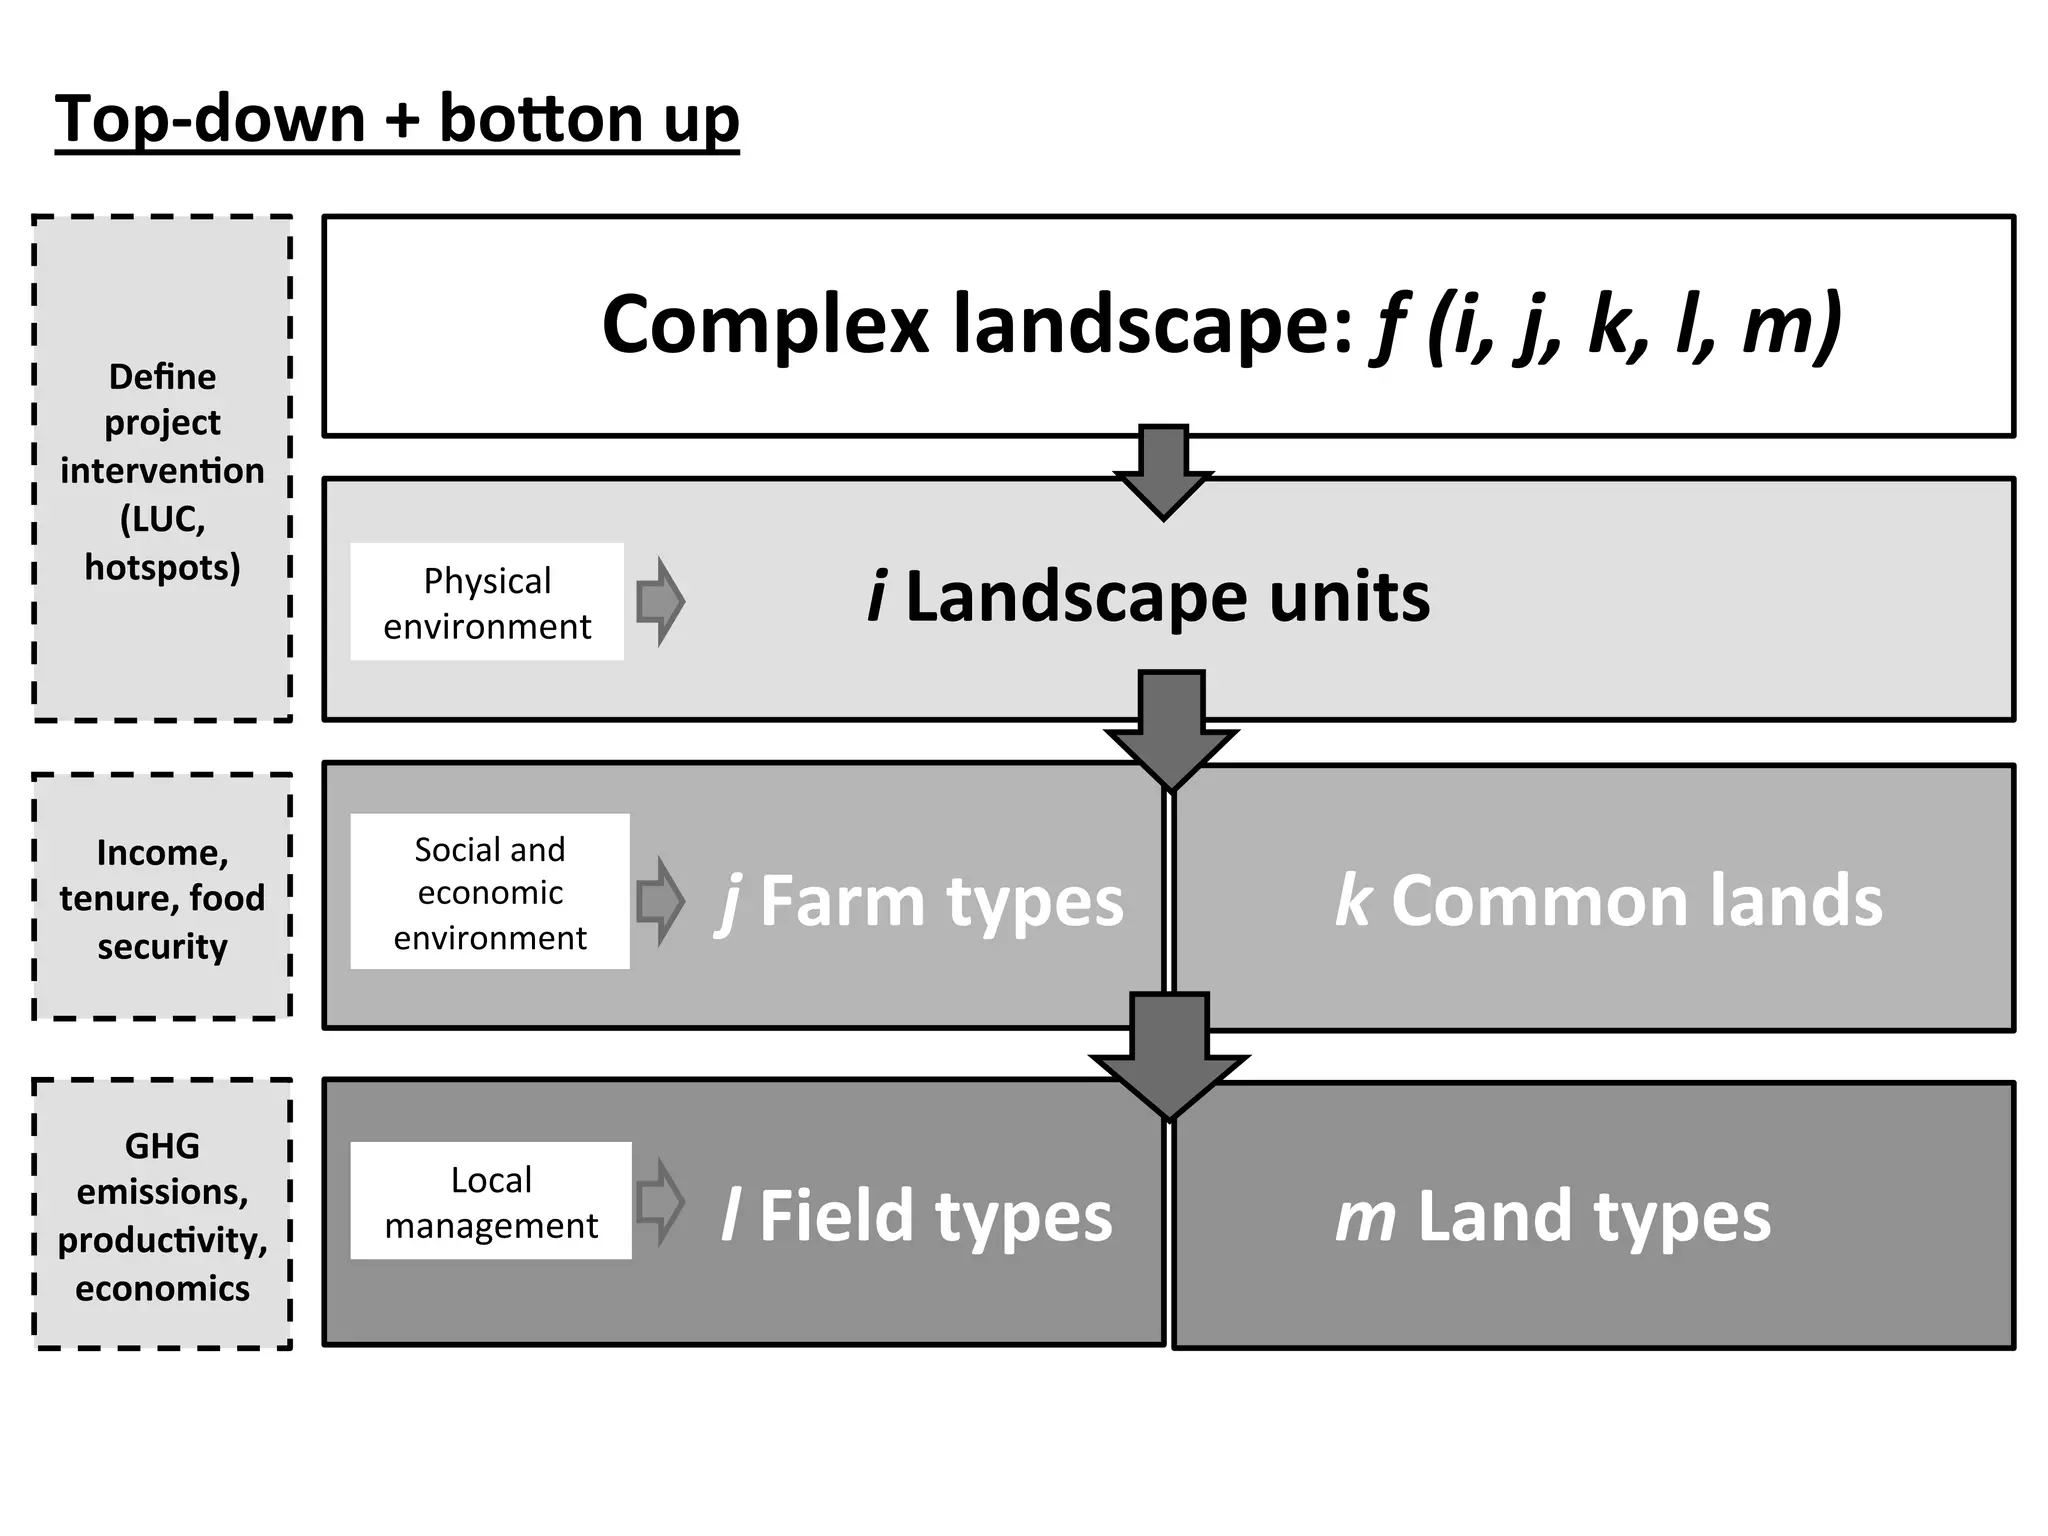
The document discusses the informed sampling methods for assessing mitigation options in smallholder systems, emphasizing the importance of defining scale, boundaries, and addressing heterogeneity in landscapes. It outlines a structured approach to identify mitigation options at both farm and landscape levels, considering various environmental and social factors. Additionally, it highlights the necessity of collecting meaningful and cost-effective data to support these assessments.


