This document summarizes a study that used a contingent valuation method to examine households' willingness to pay for improved solid waste management in Mwanza City, Tanzania. The study collected survey data from 300 randomly selected households. A logit regression model found that seven variables had a significant influence on willingness to pay, including income, education level, environmental knowledge, age, and factors related to household type and legal regulations. The results suggest that individual households are generally willing to pay for improved solid waste management services.
![Journal of Resources Development and Management www.iiste.org
ISSN 2422-8397 An International Peer-reviewed Journal
Vol.4, 2015
61
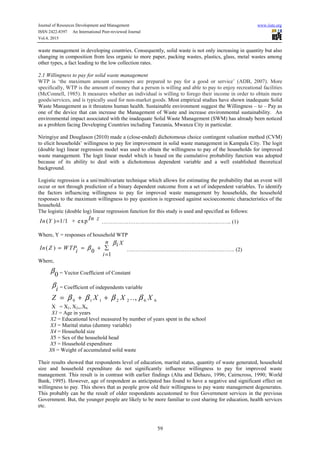
Pr( . )V e V ein in in jn= + +
Pr{ (1, , ) . (0, , )v I A S e v I S e
n n n n n n jn
= − − +
Pr{ (1, , ) (0, , )}e e v I A S v I S
jn in n n n n n
= − = − − ….……………....… (5)
While the probability of an individual n choosing alternative j is defined as:
( ) 1 ( )P j P i
n n
= − …………………………………………………. (6)
Under the assumption that e e e
n jn in
= − is logistically distributed, probability that an individual n will
choose alternative i can be written as
exp 1
( )
( )exp exp 1 exp
vin
P i
n vin vjn vin vij
µ
µ µ µ= =
− −+ +
………..……………………. (7)
This is binary Logit model which is used to determine the willingness to pay of individual/respondents.
4. Empirical Model Specification
4.1 Empirical Model Specification for Willingness to pay
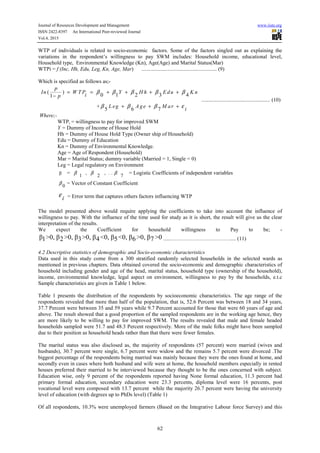
The main objective of the study was to determine factors that influence the households’ willingness to pay and to
allow inclusion of the respondents’ social economic factors into the WTP function. Incorporation of variables
into the WTP helps to gain information on validity and reliability of the results from the empirical analysis (Mc
Connell, 2002). To obtain the willingness to pay of the inter-household for the SWM, the responses of the inter-
household willingness to pay was regressed through the Logistic model. Logistic regression is useful in the
situation where prediction of the presence or absence of an outcome based on values of a set of predicator
variables is needed. The Logistic regression coefficients are used to estimate coefficient for each of independent
variables in the model.
In the analysis the outcome of the response, household Willingness to pay or not does not matter. The major
interest is the Likelihood or Probability of outcome .The binary response in this study is whether the respondents
are willing to pay or not for the Solid Waste Management. If Y is the Random Variable dichotomous, it can then
be assumed that it takes the value of 0 or 1, where 0 denotes the non-occurrence of event in the question and 1
denotes the occurrences (Maddala, 1983). If X’s characteristics are to be related to occurrences of this outcome,
then the logistic model specifies that the conditional probability of event (i.e. that Y = 1) given the value of X1…,
Xp is as follows:
1
( )
[1 exp ( )]
P Y WTPi
Xii iiα β
= =
+ − +∑ ………………………...…………………. (8)
Where:
1 if Household is willing to Pay for SW M
0 If Household is not willing to Pay for SW M
Yi={
α = Constant term
X = Independent Variable (Socio-economic factors)
iiβ = Logistic Coefficients for the independent Variables
iε = Error Term2
2
For more details see logistic models in Maddala, G .S (1983). Limited Dependents and Qualitative Variable in
Econometrics, Cambridge University Press. Cambridge.](https://image.slidesharecdn.com/c61c569d-62de-4341-87ad-9cb8a5216814-150512141751-lva1-app6891/85/RRSizya-5-320.jpg)
![Journal of Resources Development and Management www.iiste.org
ISSN 2422-8397 An International Peer-reviewed Journal
Vol.4, 2015
63
was followed by those engaged in Non- farm business (26 percent). Majority of respondent were wage employee
(employed in private organisations and Government institute) constituted 46 percent, this is the facts that wage
employee were the one found in the week days at their respective housed. Domestic workers constitutes of 6
percents. The others occupation is 11.7 percent this is not surprising as most of the respondents belong to these
groups can not identify themselves to what they actually doing in their daily life and therefore it becomes
difficult to get a job which they specifically doing(Table 1).
To add-on (Table 1), the monthly income received and generated from various occupations, the majority of
respondents (about 38.7 Percent) are having income between Tshs. 50,000 – 100,000 per month in other revenue
generating activities. 17 percent of respondents were having income between Tshs. 101,000 – 250,000 per month,
30.3 percent composed with respondents of income revenue generation per month between Tshs. 251,000 –
400,000, 11.7 percent of respondents is composed with those having income between Tshs. 500,000 – 1,000,000.
The low percentage of 2.3 percentages is composed with the respondents having income of about Tshs.1,
000,001 and above.
However the information they disclosed do not resemble to what they actually say about their income as most
respondents did not disclose the real value of their monthly income. The level of household life styles is
generally high (Researcher Observation). The result also reveals that, the household type of respondents, the
majority of respondents (65 percent) are living in rented house and remaining proportion of 35 percent constitute
about 35 percent.
4.3 Empirical results
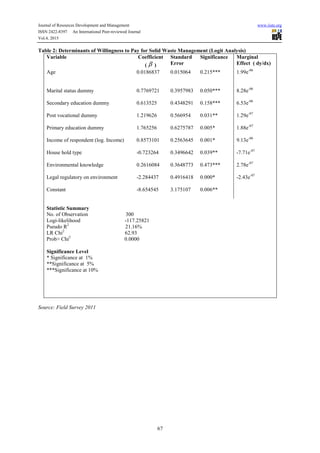
4.3.1 Determinants of Willingness to pay for improved solid waste management
Contingent Valuation Method (CVM) through the Logistic regression analysis was constructed to ascertain
factors that could influence the willingness to pay by some selected respondents and not others in the study area,
based on Closed–Ended Format (dichotomous choice question), simply asks if the respondent is willing to pay a
specified amount of money for the proposed change. This method has the advantage of being familiar with
respondents like in real world markets where buyers face posted prices so it is easier for buyers to answer. But,
this method suffers from a number of shortcomings. One of which is starting value biases. This method gives
limited information on benefits and hence suffers from efficiency. Moreover, large sample is required for
estimation of benefits, because maximum willingness to pay is not obtained directly from this method.
Willingness to pay (whether and individual is willing to pay or not for solid waste management) was regressed
on income, household type, education, environmental knowledge/awareness, legal regulatory, age and marital
status using the maximum – likelihood estimation procedure.
Before the maximum likelihood estimates was run, test was made for the prevalence of multicollinearity since
this problem reduces the precision of estimating the coefficient of variables having this problem.
According to Gujarati 1997, a correlation coefficient of 0.8 is sufficient to indicate the existence of
multicollinearity problem and one solution to solve this problem is to drop one of the variables creating the
problem. Based on this non formal education dummy and Diploma dummy of household are dropped because
they were found to be significantly correlated with each counterpart. One problem that may arise when we drop a
variable is specification problems. We did not check the significant effect of other variable to be included in the
model because the variable dropped are some part of the main variable it’s not a variable as a whole. The
decision to drop these dummy variables was based on the higher relevance of the later variable observed from
regression results.
As discussed in the previous sections maximum likelihood estimates made a Logit Model to identify the socio –
economic factors that affect a household is willing to pay for improved solid waste management.
The maximum likelihood estimates for a household to be willing to pay or not was corrected for potential
heteroscedasticity problem. As shown in table 4.5 the LR chi square which is 62.93% shows the overall
significance of the Logit Model at 5% level of significance, while a Logi-likelihood is -117.25821. Negative log
likelihood shows that a model will be evaluated as fitting the data better if the chi-square for comparison with a
model with a deviance is statistically significant. The pseudo R2
is 21.16%, which implies that percentage of the
variation in the probability of being willing to pay or not is explained by the variables included in the model. We
can not be surprised on the value of R2
because the conventional measure of goodness of fit of it is not
particularly meaningful in binary regressed models (Gujarati, 2007:618). However the marginal effect were
further generated [y = Pr (wtp) (predict)] by using mfx command. The marginal effect is then simply the
gradient of the logistic CDF at this mean value. (Norton, 2004). The marginal effects are nonlinear functions of](https://image.slidesharecdn.com/c61c569d-62de-4341-87ad-9cb8a5216814-150512141751-lva1-app6891/85/RRSizya-7-320.jpg)