Downloaded 16 times
![Special Issue – August 2013 Which direction for India?
25
© India Transport Portal
The recession in India is more due to the negative sentiments
and wrong/unfriendly govt. policies. [A Heavy duty truck
business growth by] 8% by 2020 from my point of view looks
absolutely realistic; would dare to say even pessimistic.”
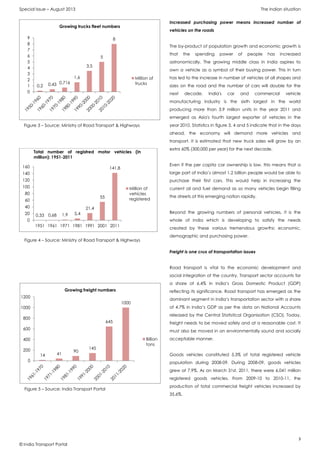
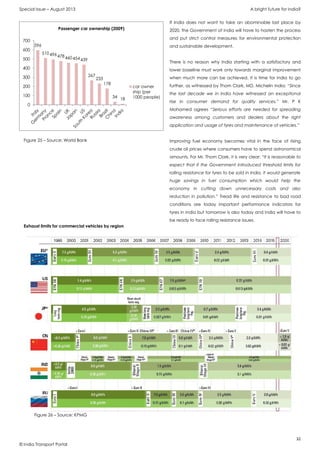
Temporary due to macroeconomic situation, India saw a
decline in the production and sales of heavy trucks but this is
not representative of long terms forecasts. Light trucks are a
common sight in India and were at an all-time high in 2010 as
the economy showed a stupendous growth in many sectors.
The Indian truck market is set to grow, with the construction
sector, infrastructural plans, economy and population on the
rise.
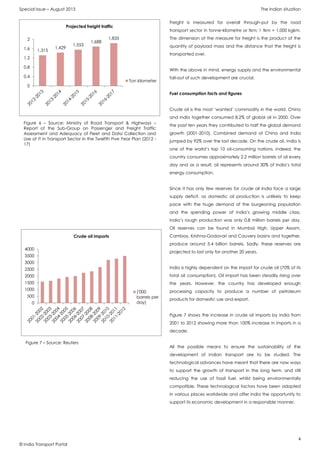
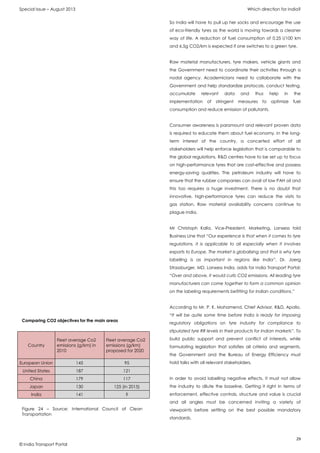
With high levels of growth expected in passenger and freight
traffic in India, CO2 emissions will sky rocket along with the
demand for fuel. Although India has emission standards in
place, it is yet to introduce a holistic energy policy or a
labelling scheme for tyres. With this is mind, India is making
efforts towards harmonizing its regulations with those of the EU.
The Star Rating Cars system lesson
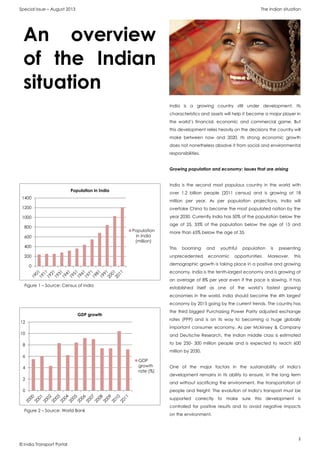
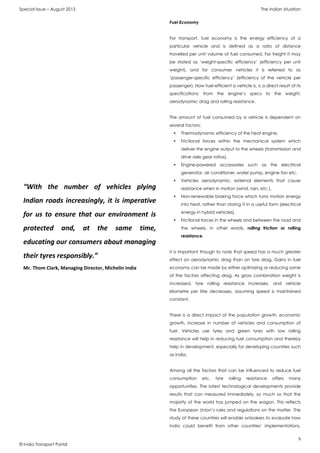
As per a 2009 McKinsey report, if India an improvement in fuel
economy by 15% by 2015 will translate into a savings of 29
million tons of CO2 by the year 2030. That roughly equals 10.3
million Tons of Oil Equivalent which will amount to 7.8 billion
dollars of savings in 2030 at 100 dollars/ barrel. To maintain
status quo in crucial environmental issues, India has to employ
cost-effective, energy-efficient options sooner than later.
About 18% of total CO2 emissions in the country can be
accounted for by India’s vehicle sector. There are no
standards for CO2 emission limits for pollution from vehicles at
present but India, with the Bureau of Energy Efficiency (BEE) is
enforcing a star rating system for cars. Passenger cars have to
declare their fuel efficiency from April 2013 in a star rated
system. Consumers will have a definite idea about the mileage
of the car just by looking at the stars displayed – the more
stars, the higher the mileage the car offers.
An important thing regarding is that the BEE had allowed car
manufacturers to apply the appropriate labels on a voluntary
basis from June 2012 but the auto industry blatantly refused to
agree to the norms proposed by the government citing them
to be too strict and almost impractical to implement within the
timeline.
The Society of Indian Automobile Manufacturers (SIAM)
blames the quality of fuel and Indian road conditions for the
lower-than-expected fuel efficiency of cars in India.
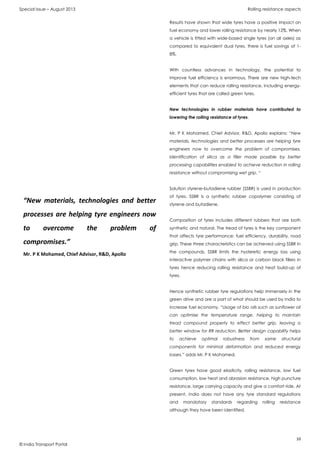
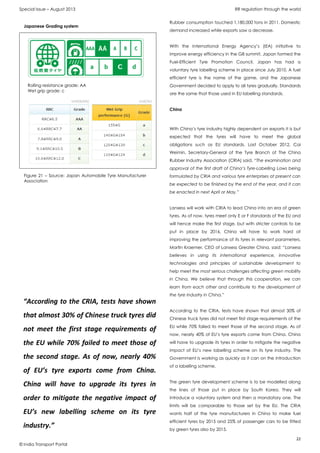
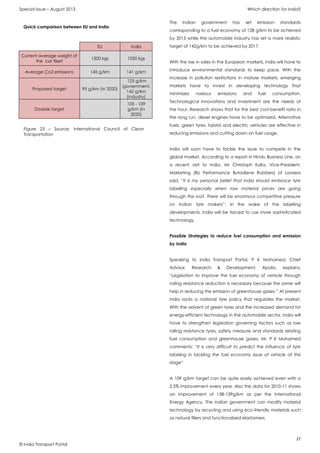
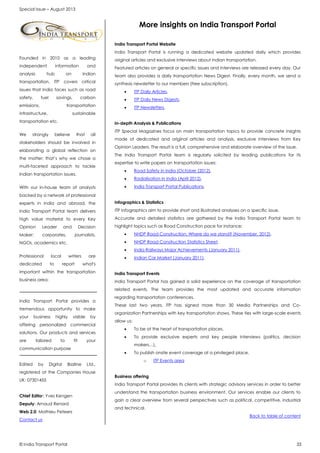
16,6
18,1
20,79
0
5
10
15
20
25
2012 2015 2020
Mileage aspiration / litre
Mileage
aspiration / litre
Figure 22 – Source: Hindustan Times](https://image.slidesharecdn.com/rrthresholds2013-160216160735/85/Rolling-Resistance-Thresholds-26-320.jpg)

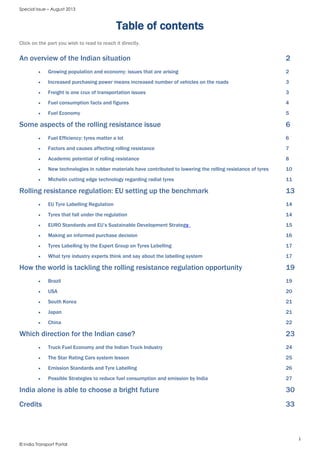
The document discusses the sustainability challenges and opportunities in India's transportation sector, highlighting the impact of a growing population and economy on vehicle ownership, fuel consumption, and freight transport. It emphasizes the importance of rolling resistance in improving fuel efficiency and reducing environmental impact, with technological advancements in tire design playing a crucial role. The document also compares India's situation to global practices and outlines potential strategies for sustainable development in transportation.


