Download to read offline

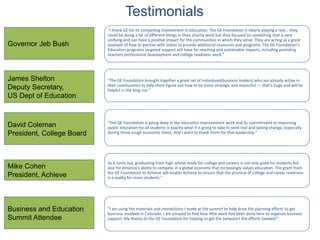
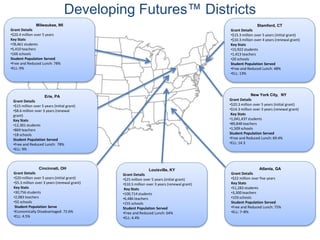
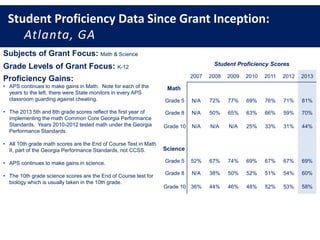
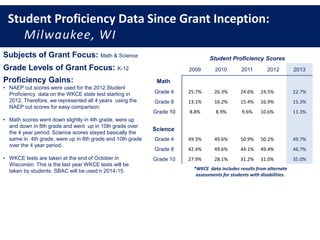
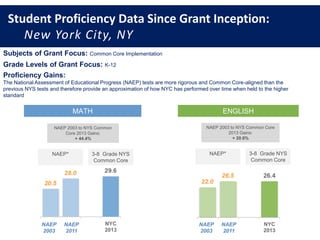
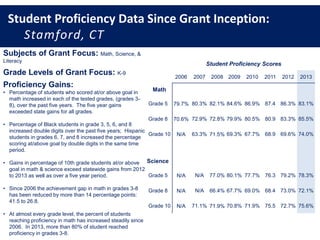

The GE Foundation provides grants to support education programs and initiatives in several large urban school districts. Testimonials from government officials and education leaders praise the GE Foundation for its leadership, focus on improving public education, and strategic partnerships. Data shows proficiency gains in math, science, and other subjects in districts receiving GE Foundation grants, particularly in schools directly involved in Foundation programs. The grants aim to improve student outcomes through initiatives like teacher professional development, college readiness programs, and implementing common state standards.


![Spring 2011 state assessment results_12.13.11[1]](https://cdn.slidesharecdn.com/ss_thumbnails/spring2011stateassessmentresults12-13-111-120116110011-phpapp01-thumbnail.jpg?width=640&height=640&fit=bounds)


