Download to read offline
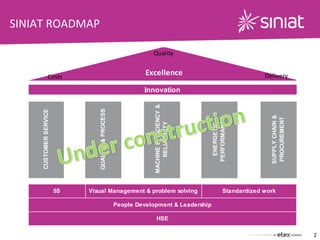
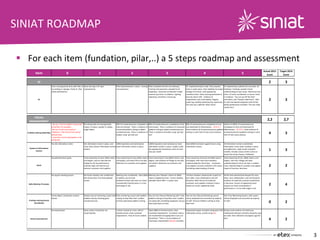
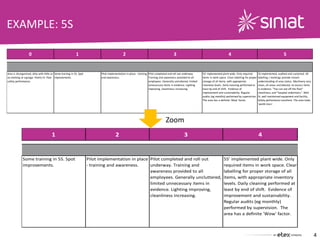
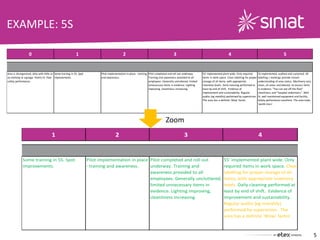
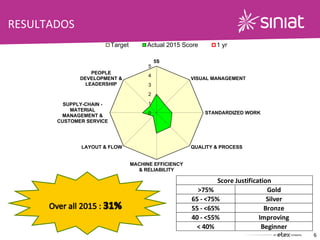
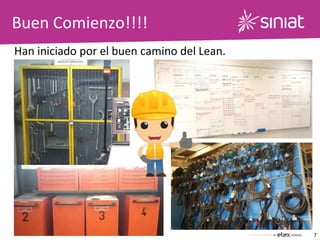
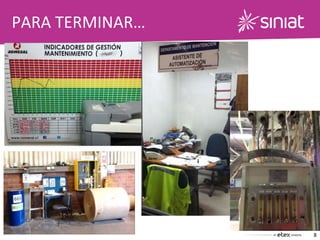
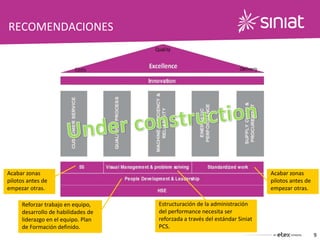

This document outlines Siniat's roadmap for improvement across several key areas including 5S, visual management, standardized work, quality and process, machine efficiency, layout and flow, supply chain and material management, customer service, and people development and leadership. It provides a 5-step assessment scale for each area from beginner to gold level. The roadmap is intended to help sites assess their current status and target scores to aim for over time in order to continuously improve performance. Recommendations include finishing pilot areas before starting new ones, strengthening performance administration, reinforcing teamwork and leadership skills development, and defining a training plan.


