Download to read offline


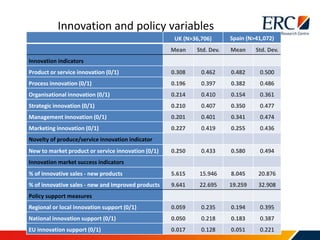


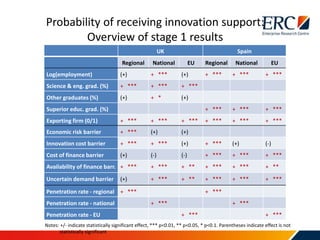
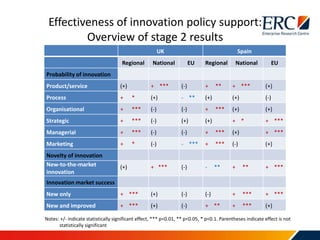


1) The study examines the effects of firms receiving innovation policy support from regional, national, and EU sources in the UK and Spain. 2) Key findings include regional support being most influential for certain innovation types in the UK, while in Spain support from regional, national, and EU levels impacted innovation outcomes. 3) Policy implications suggest centralization of UK innovation policy may increase competitiveness but also the gap between firms, while reduced regional support could weaken broadly based innovation.


