Download to read offline


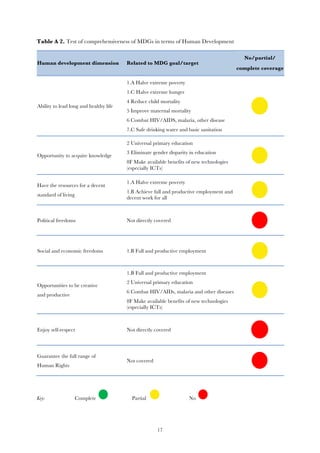

This document analyzes the Millennium Development Goals (MDGs) and whether they represent an effective tool of Global Social Governance. It discusses the emergence of the MDGs, noting they were initially developed by wealthy countries and international organizations without sufficient input from developing nations. This raises questions about ownership and accountability. The document also assesses how comprehensive the MDGs were in reflecting key development concepts like human development. While the MDGs addressed some important aspects like health, education, and living standards, they did not fully cover all dimensions of development like freedom, sustainability, and environmental protection. Overall, the document examines both the strengths and limitations of the MDGs in order to inform discussions on improving global development goals after 2015.


![Fullreport[1]](https://cdn.slidesharecdn.com/ss_thumbnails/fullreport1-120214140553-phpapp01-thumbnail.jpg?width=640&height=640&fit=bounds)


