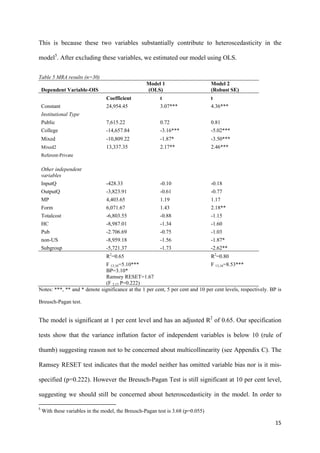
#2014-066 
UNU‐MERIT Working Paper Series 
Size and economies of scale in higher education 
and the implications for mergers 
Nyasha Tirivayi, Henriette Maasen van den Brink and Wim Groot 
Maastricht Economic and social Research institute on Innovation and Technology (UNU‐MERIT) 
email: info@merit.unu.edu | website: http://www.merit.unu.edu 
Maastricht Graduate School of Governance (MGSoG) 
email: info‐governance@maastrichtuniversity.nl | website: http://mgsog.merit.unu.edu 
Keizer Karelplein 19, 6211 TC Maastricht, The Netherlands 
Tel: (31) (43) 388 4400, Fax: (31) (43) 388 4499
UNU-MERIT Working Papers 
ISSN 1871-9872 
Maastricht Economic and social Research Institute on Innovation and Technology, 
UNU-MERIT 
Maastricht Graduate School of Governance 
MGSoG 
UNU-MERIT Working Papers intend to disseminate preliminary results of research 
carried out at UNU-MERIT and MGSoG to stimulate discussion on the issues raised.
1 
Size and Economies of Scale in Higher Education 
and the Implications for Mergers 
Nyasha Tirivayi1*, Henriette Maasen van den Brink2 , Wim Groot3 
August 2014 
Abstract 
This paper carries out a meta regression analysis to estimate the optimal size of higher 
education institutions (HEI) and identify its implications for strategies of mergers in higher 
education. This study finds an optimal institutional size of 24,954 students. We find potential 
opportunities for merging different HEIs relative to their mean sample size: public 
universities by nearly 190 per cent, private universities by 131 per cent, small colleges by 
around 952 per cent, and non-US HEIs by about 118 per cent. However, if we compare with 
actual sizes of top ranked universities we find that in some parts of the world top ranked 
universities seem to be below optimal size, while in others they appear above optimal size. 
We urge caution in the interpretation of the findings due to the limited data. We recommend 
further research and that policymakers around the world refer to their own cost structures to 
determine the optimal size for efficiency. 
JEL Classification: I23, I21, I22 
Keywords: Size, economies of scale, higher education, mergers, optimal size 
1 Corresponding author. UNU-MERIT, Keizer Karelplein 19, 6211 TC, Maastricht. The Netherlands. tirivayi@merit.unu.edu 
2 Top Institute for Evidence Based Education Research (TIER), Maastricht University, Kapoenstraat 2, 6211 KW, 
Maastricht, Netherlands 
3 Top Institute for Evidence Based Education Research (TIER), Maastricht University, Kapoenstraat 2, 6211 KW, 
Maastricht, Netherlands
2 
1. Introduction 
In higher education, universities and colleges make decisions on how to efficiently use 
resources in order to enhance and maintain a sustainable competitive position (Bonaccorsi et 
al. 2007). Consequently, management of higher education institutions (HEIs) have a strong 
interest in cost minimization (Laband and Lentz 2003). Elements affecting decisions on cost 
minimization include quantity and quality of output, whether to specialize or produce 
multiple outputs or whether the institution should be small or large in either student 
enrolment or research (Laband and Lentz 2003). Mergers are often perceived as a means to 
achieve cost savings through increased economies of scale and a means to reduce competition 
in the market. 
It is within this context that the education literature includes many econometric studies that 
analyse economies of scale in HEIs by identifying the optimal size for a HEI or attempt to 
justify the need for mergers of institutions (Patterson 2000). In most of the analyses of 
economies of scale, the focus is to establish if larger institutions incur lower costs than small 
institutions and thus determine at what size a HEI functions at optimum efficiency (Patterson 
2000). Size is usually measured in terms of student enrolment and economies of scale arise 
when the cost of providing education falls as the student enrolment increases (Lloyd et al. 
1993). Student enrolment is the most common measure used for teaching output and an 
essential contributor to institutional costs (Cohn et al. 1989; de Groot et al. 1991). In the 
short-term an HEI can achieve economies of scale by lowering quality and boosting quantity 
(student enrolment), but in the long term the quality of instruction and research output also 
influence the HEI cost structure and are vital determinants of economies of scale in higher 
education (Fu et al. 2008).
Many empirical studies have been carried out to determine if there are economies of scale in 
higher education. The size-cost relationship has been presented in many ways including 
through estimations of cost functions, calculations of the overall and product specific 
economies of scale and illustrations of the shape of the average or marginal cost curves. In 
the USA, a seminal review of studies conducted in the previous 50 years was carried out by 
Brinkman and Leslie (1986). Their review focused on the size-cost relationship in US higher 
education and concluded that economies of scale are most likely to occur at the low end of 
student enrolment range i.e. 1000 full time equivalent (fte) students in two year colleges and 
1500-2000 fte students in four year colleges (Brinkman and Leslie 1986, Patterson 2000). 
However, they also determined that nature and strength of the economies of scale were not 
only influenced by size, but also by type of institution, type of costs (administrative vs 
instructional), input prices like salaries paid and breadth of curriculum (Patterson 2000, 
Brinkman and Leslie 1986). 
A popular strategy for cost minimization and boosting competitiveness in higher education 
has been the merger of HEIs. In Europe, USA, Australia and China, there have been 
comprehensive mergers of HEIs (Lloyd et al. 1993, Mao et al. 2009, Paterson 2000). One of 
the main reasons and arguments for the mergers is the expected increase in size and scope of 
the institution and ultimately economies of scale which would provide an economic benefit 
and could free resources to improve quality of output (Patterson 2000). There is however 
limited empirical literature on the economic benefits of such mergers and whether mergers 
directly result in lower education costs or savings. However, there exist several studies that 
have generally sought to establish the size-cost relationship and prove the existence of 
economies of scale in HEIs (Patterson 2000, Cohn et al. 1989, de Groot et al. 1991). 
3
This paper’s main interest is to derive from the empirical literature a “standard” optimal HEI 
size, show how it varies by characteristics of the HEIs and each study, and to discuss the 
implications on strategies of mergers in higher education. The paper employs a systematic 
review approach in collating the relevant empirical literature. The empirical studies reviewed, 
use a variety of estimation techniques, models and data in determining economies of scale in 
higher education institutions. Hence in order to make the estimates comparable meta 
regression analysis will be used (Stanley and Jarrell 1989). To our knowledge this is the first 
study to utilize meta regression analysis to compute a base estimate of the optimal HEI size. 
We adapt the meta regression analysis guidelines laid out by Stanley and Jarell (1989) and 
the approach utilized by Colegrave and Giles (2008) to compute a “standard” estimate of an 
optimal school size and how independent variables increased or decreased the “standard”. 
The paper is organized as follows, section II details the methodology used in the literature 
search and the meta regression analysis. Section III presents the findings of the meta 
regression analysis. Section IV discusses the results and their strategic implications on 
mergers in higher education. The paper concludes by providing suggestions for further 
research. 
4 
2. Methodology 
2.1 Background on Meta Regression Analysis 
Meta regression analysis (MRA) is an approach used in meta analysis. It is especially useful 
when the control and experimental groups required in a comprehensive meta analysis are not 
available (Stanley and Jarell 1989). MRA’s design allows for the control of biases found in 
non-experimental studies. The steps to conducting an MRA include a) searching and 
documenting all relevant studies, b) choosing the summary statistic for the dependent
variable, c) selecting meta-independent variables pertaining to the study design and conduct, 
d) carrying out the MRA and finally e) conducting specification tests (Stanley 2001). 
2.2 Search for Relevant Studies 
We initially searched for the existing literature and systematic reviews on the subject matter. 
We identified two literature reviews; Patterson (2000) and Brinkman and Leslie (1986). We 
selected keywords based on our reading of these earlier literature reviews. The keywords that 
were chosen are “economies of scale”, “cost structure” and “cost function”. The keywords 
were used in combination with the terms “higher education”, “colleges” and “universities” 
and a requirement that each study contain an exact term “ray economies of scale”. We then 
searched for relevant published empirical articles, books, book chapters and working papers 
during the period October 2011 to April 2014. The following electronic databases and search 
engines were searched: ERIC, PsycINFO, Science Direct, SAGE, JSTOR, Social Science 
Research Network, Economic Papers, Wiley, Taylor and Francis, Springer and Google 
Scholar. 
Our initial search yielded 155 studies with estimates of economies of scale including about 7 
references from Brinkman and Leslie (1986). Relevant studies had to meet the following 
inclusion criteria: 
1) Studies analyse economies of scale by estimating institutional cost functions. The 
general methodology involves estimating total costs as a function of outputs S (e.g. 
student enrolments and research), exogenous inputs and input quality measures, Xi 
(e.g. institutional characteristics, student-faculty ratio), output quality, Qi (e.g. 
5
entrance scores, academic reputation), and input prices, pi (e.g. faculty compensation). 
Hence the total cost of an institution i can be expressed as follows: 
6 
, ܳ௜, ݌௜ሻ (1) 
ܶܥ௜ ൌ ݂ ሺܵ,ܺ௜ 
Functional forms for estimating economies of scale considered in this study include 
the earlier linear cost functions, constant elasticity substitution cost functions, and 
hybrid translog cost functions and the most common, quadratic cost function 
(Longlong et al 2009). The quadratic cost function, another way of presenting 
equation (1) is shown in equation (2): 
ߙ଴ ൅ ෍ ߙ௜ܵ௜ ൅ 
1 
2 
௡ 
෍ ෍ ߚ௜௝ܵ௜௝ 
௝ୀଵ 
൅ 
௡ 
௜ୀଵ 
௡ 
௜ୀଵ 
௡ 
෍ ߛ௜ܺ௜ ൅ ෍ߜ௜ 
ܳ௜ ൅ ߠଵ݌௜ ൅ 
௜ୀଵ 
௡ 
௜ୀଵ 
ߝ௜ 
(2) 
Where TC is the total cost of producing n outputs/products, α଴ is a constant, α୧ 
and β୧୨ are coefficients for the various output variables. Si represents the outputs; 
γ୧, δ୧ and θଵ are the coefficients of inputs/ input quality X୧ , output quality Q୧ and 
input price p୧ . ε୧ is a random error term. 
2) Studies that estimated economies of scale for the whole institution. We excluded 
studies that estimated economies of scale for departments or courses (Lenton 2008, 
Lloyd et al. 1993, Dundar and Lewis 1995). 
3) Studies that used total student enrolment (or graduate and undergraduate student 
enrolments) as a measure of teaching output in the cost functions. Studies that 
estimated economies of scale using measures such as student completion rates or
student credit hours were excluded from the study (Worthington and Higgs 2011, Sav 
2011). 
4) Studies that were published after 1960. Brinkman and Leslie (1986) clearly show that 
most studies published earlier than 1960 were mostly based on smaller samples, 
descriptive statistics and institutions that were on average smaller than contemporary 
higher education institutions today. 
The inclusion criteria confer some uniformity between the reviewed studies, ensuring 
relevance (Colegrave and Giles 2008). After applying our inclusion criteria, we identified 21 
studies. Our literature search was thorough; however it is possible that some studies have 
been excluded due to unavailability in libraries or online. Studies such as Heaton (1996) and 
Heaton and Throsby (1997) were referenced in Patterson (2000), but could not be found 
anywhere online or in libraries. 
2.3 Dependent variable 
In meta analyses, the effect size is the key variable of interest. In our study we looked at 
various articles that employed diverse estimation techniques in determining the economies of 
scale at higher education institutes and the optimal size at which average costs are lowest. 
The studies employed estimation methods such as linear regression, hybrid translog cost 
functions and quadratic multi-product cost functions. Consequently, choosing an effect size 
from the coefficients was problematic as they were difficult to standardize. In this paper we 
use optimal institutional size estimates as the dependent variable of our meta regression 
analysis. These estimates correspond to the institutional student enrolment where the 
minimum ray economies of scale are achieved. This is normally demonstrated on an average 
7
cost curve showing a minimum point after which, costs start rising again. Ray economies of 
scale refer to the reduction in average costs relative to marginal costs when a composition of 
output is assumed to remain fixed while its size is allowed to vary (Dundar and Lewis 1995). 
Hence, ray economies of scale are overall economies of scale over an output set. Ray 
economies of scale often indicate a decline or increase in total education costs as HEIs alter 
the levels of their outputs. 
As mentioned earlier, the most common outputs featured in economies of scale studies are 
student enrolment and research. For purposes of standardization, we selected total student 
enrolment as the main indicator for optimal institutional size4. In instances where the optimal 
size was given as an interval, we calculated the midpoint and used it instead in our analysis. 
After checking for the presence of our parameter of interest, we reduced our tally of studies 
from 21 to 12. We excluded studies that did not have optimal institutional size estimates or 
did not explicitly indicate the minimum ray average costs corresponding to the output mix 
(Lyell 1979, Sav 2011, Koshal et al. 2001, Dougherty 1990, Goudriaan and de Groot 1991, 
Hashimoto and Cohn 1997, Laband and Lentz 2003, Longlong et al. 2009, Worthington and 
Higgs 2011). 
Some of the 12 remaining studies provided more than one set of estimations based on either 
different functional forms (single product vs. multi product cost functions) or different 
subgroups (e.g. public vs. private universities). Multiple estimates of optimal institutional 
size (OIS) were treated as separate observations if they were based on separate models or 
subgroups of HEIs. Hence, the 12 studies on which our analysis is based on, produced 30 
observations of OIS (see appendix A for complete list). 
8 
4 Where enrolment was split into undergraduate (UG) and graduate (G) numbers, we simply added the two 
numbers. Research output was excluded as an indicator as the indicators for the variable were too diverse 
ranging from publications, federal research grant money, general research grant money etc.
9 
2.4 Meta-Independent Variables 
Twelve meta-independent or predictor variables were considered in the MRA. Ten of these 
are binary variables compared to two continuous variables. These variables were selected 
based on key feature variables described in Brinkman and Leslie (1986) and Colegrave and 
Giles (2008). The binary predictor variables describe type of data (non-US data, subgroup 
sample) and they also reflect the presence or absence of the following variables in the studies; 
input quality and price variables (i.e. student–faculty ratio, faculty salaries), an output quality 
variable (i.e. entrance test scores, academic reputation or rankings), exogenous input 
variables (i.e. institutional type e.g. public or private university). The continuous variables are 
sample size and year of data. Table 1 shows the definitions of meta-independent variables. 
Table 1 Meta-Independent Variables 
Code Definition 
A. Institutional Type 
Public =1 if public university 
Private =1 if private university 
College =1if small college/liberal arts/post secondary school 
Mixed =1 if mixed sample HEIs (all institutional types) 
Mixed2 =1 if mixed sample of public and private universities only 
B. Quality Indicators 
InputQ =1 if omitted input quality and price variables e.g. student-faculty ratio, faculty salaries 
OutputQ =1 if omitted output quality variables e.g. entrance test scores, academic reputation 
C. Datasets 
Non-US =1 if based on non-US data 
Subgroup =1 if based on a subsample 
Sample Sample size 
Year Year of data 
D. Model Specification 
MP =1 if study used a multi-product cost function 
Form =1 if study specified a quadratic cost function 
Totalcost =1 if total educational expenditures used as dependent variable in cost function (vs.variable costs) 
HC =1 if study tested for heteroscedasticity 
E. Publication characteristics 
Peer =1 if study published in peer-reviewed outlets 
Table 2 lists the 30 OIS estimates with their corresponding meta-independent variables.
10 
Table 2 OIS and corresponding meta-independent variables 
OIS Public Private College Mixed Mixed2 InputQ OutputQ MP Form Totalcost HC Pub non-US Subgroup Sample Year 
1750 0 0 1 0 0 0 1 0 0 1 0 2 0 0 119 1977.5 
3500 0 0 1 0 0 0 1 0 0 1 0 2 0 0 585 1977.5 
5120 0 0 0 1 0 0 1 0 1 1 0 1 0 0 692 1981.5 
4842 0 0 0 1 0 0 1 1 1 1 0 1 0 0 692 1981.5 
2110 0 0 0 1 0 0 1 0 1 1 0 1 0 0 1195 1981.5 
45000 0 0 0 0 1 1 0 1 0 0 0 1 0 0 86 1982.5 
17000 0 1 0 0 0 1 0 1 0 0 0 1 0 1 61 1982.5 
1600 0 0 1 0 0 0 0 0 1 1 0 1 1 0 65 1991.5 
10481 1 0 0 0 0 0 1 1 0 1 0 1 1 0 13 2000 
18141 0 0 0 0 1 0 1 1 0 1 0 1 1 0 33 2000 
1100 0 0 1 0 0 1 1 0 1 1 0 2 0 1 72 1987.5 
1600 0 0 1 0 0 1 1 0 1 1 0 2 0 0 129 1987.5 
20227 0 1 0 0 0 1 1 0 1 1 0 2 0 0 24 1987.5 
2150 0 0 1 0 0 1 1 0 1 1 0 2 0 0 331 1987.5 
18934 0 1 0 0 0 1 1 0 1 1 0 2 0 1 21 1987.5 
1115 0 0 1 0 0 1 1 0 1 1 0 1 0 1 72 1987.5 
2153 0 0 1 0 0 1 1 0 1 1 0 1 0 0 331 1987.5 
1584 0 0 1 0 0 1 1 0 1 1 0 1 0 0 129 1987.5 
30957 0 0 0 0 1 0 0 0 1 1 1 1 0 1 66 1990.5 
11758 0 0 0 0 1 0 0 0 1 1 1 1 0 1 51 1990.5 
16112 0 0 0 0 1 0 0 0 1 1 1 1 0 1 44 1990.5 
22174 0 0 0 0 1 0 0 0 1 1 1 1 0 1 33 1990.5 
2472 0 0 1 0 0 0 0 1 1 1 1 1 0 0 295 1994.5 
19800 0 0 0 1 0 0 1 1 1 1 0 1 0 0 1450 1995.5 
19800 0 0 0 1 0 0 1 1 1 1 0 1 0 0 1316 1995.5 
5300 0 0 0 1 0 1 1 0 0 1 0 2 0 0 123 1967.5 
13000 1 0 0 0 0 0 1 0 1 1 1 1 1 19 1980 
9800 0 0 0 1 0 0 0 1 1 0 1 2 0 1 730 1994.5 
16000 0 0 0 1 0 0 0 1 1 0 1 2 0 0 820 1994.5 
7720 0 0 0 1 0 0 0 1 1 0 1 2 0 1 384 1994.5 
Notes. Year was calculated as a midpoint for data obtained between two years e.g. 1987/1988 becomes 1987.5
Table 3 presents the descriptive statistics. The mean OIS across the literature is around 
11,110 students. Mean OIS refers to the average of the OIS estimates. The average 
institutional sizes from the study samples are presented in appendix B. However a closer look 
at OIS by institutional type indicates that estimates based on public and private university 
samples have a higher mean OIS of 11,740 and 18,720 students respectively, while for 
college samples the OIS is very low at 1,902, possibly pulling down the OIS into the mid-range 
OIS for all literature. Nearly 37 per cent of the estimates omitted input quality and 
price variables (e.g. student-faculty ratio, faculty salaries), compared to 63 per cent who 
omitted output quality variables (e.g. entrance test scores, academic reputation, rankings). 
About 63 per cent of the estimates were in peer-reviewed articles, 13 per cent are based on 
non-US data and 37 per cent of are based on multi-product cost functions, while only 30 per 
cent tested for heteroscedasticity. 
11 
Table 3 Descriptive Statistics (n=30) 
Mean Std. Dev. 
Optimal Institutional Size 
Full sample 11,110 10,427.36 
Public (n=3) 11,740.5 1,781.20 
Private (n=3) 18,720.33 1,624.08 
College (n=10) 1,902.4 712.758 
Mixed (n=9) 10,054.67 6,782.82 
Mixed2 (n=5) 24,023.67 12,158.5 
Rest of variables 
Public 0.067 0.254 
Private 0.100 0.305 
College 0.333 0.479 
Mixed 0.300 0.466 
Mixed2 0.200 0.407 
InputQ 0.367 0.490 
OutputQ 0.633 0.490 
MP 0.367 0.490 
Form 0.767 0.430 
Totalcost 0.833 0.379 
HC 0.300 0.466 
Pub 0.633 0.490 
Non-US 0.133 0.346 
Subgroup 0.345 0.484
Sample 332.700 415.288 
Year 1987.817 7.191 
Table 4 presents the correlation matrix of the OIS estimates and predictor variables. 
As seen from Table 4, a number of correlations are significant at the 1 per cent and 5 per cent 
levels. Notable high positive correlations are “non-US data” and public universities at about 
0.68, studies based on mixed public and private universities and OIS at around 0.63, and 
“total costs (use of total costs in estimations)” and studies that omitted output quality 
variables at 0.58. Negative correlations include “total costs (use of total costs in estimations)” 
and studies that used multi-product cost functions at around 0.59, “small colleges” and OIS at 
around 0.64. Interestingly studies that tested for heteroscedasticity are positively correlated 
with “mixed samples of public and private universities” at 0.4, but negatively correlated with 
studies that omitted input quality and price variables in their estimations at around 0.5 and 
studies that omitted output quality variables in their estimates at around 0.71. Year of data is 
positively correlated with studies that used multiple product cost functions at around 0.48, an 
indication that these cost functions have become commonplace or more popular in recent 
years. 
12
13 
Table 4 Correlation Matrix 
OIS Public Private College Mixed Mixed2 InputQ OutputQ MP Form Totalcost HC Pub non-US Subgroup sample Year 
OIS 1 
Public 0.016 1 
Private 0.247 -0.089 1 
College -0.635*** -0.189 -0.236 1 
Mixed -0.067 -0.175 -0.218 -0.463** 1 
Mixed2 0.630** -0.134 -0.167 -0.354 -0.327 1 
InputQ -0.041 -0.203 0.438** 0.342 -0.347 -0.208 1 
OutputQ -0.393** 0.203 0.023 0.245 0.045 -0.484*** 0.292 1 
MP 0.33 0.074 -0.023 -0.391** 0.408** -0.035 -0.292 -0.282 1 
Form -0.18 -0.169 -0.079 0.056 0.189 -0.118 -0.071 -0.093 -0.234 1 
Totalcosts -0.349 0.120 -0.149 0.316 -0.293 -0.00001 -0.031 0.588*** -0.588*** 0.176 1 
HC 0.213 0.117 -0.218 -0.309 0.048 0.400** -0.498*** -0.709*** 0.106 0.361** -0.293 1 
Pub -0.23 -0.203 0.208 0.196 0.106 -0.380** 0.282 0.148 -0.148 -0.071 -0.217 -0.045 1 
non-US -0.012 0.681*** -0.131 -0.069 -0.257 0.049 -0.298 0.095 0.109 -0.247 0.175 -0.043 -0.298 1 
Subgroup 0.176 -0.189 0.236 -0.200 -0.154 0.354 0.049 -0.489*** -0.098 0.223 -0.253 0.463** 0.049 -0.277 1 
sample -0.055 -0.207 -0.243 -0.208 0.785*** -0.344 -0.386** 0.174 0.376** 0.253 -0.092 -0.098 -0.055 -0.288 -0.311 1 
Year 0.199 0.083 -0.094 -0.122 -0.040 0.207 -0.327 -0.299 0.484*** 0.303 -0.119 0.305 -0.22 0.281 0.178 0.117 1 
Notes: *** and ** denote significance at the 1 per cent and 5 per cent levels, respectively.
2.5 Meta regression model 
We estimated a MRA model based on the guidelines suggested by Stanley and Jarrell (1989) 
and the application by Colegrave and Giles (2008) to finding optimal school size. The MRA 
model is expressed in equation 3. 
14 
௠ 
OIS௜ൌ α൅ ෍ ߙ௠ 
௠ୀଵ 
ܼ௜௠ ൅ ߝ௜ 
for i =1, 2,...,n (3) 
OIS denotes the dependent variable optimal institutional size for the ith study in n studies. 
However n refers to the 30 estimations produced since some of the 12 studies computed more 
than one OIS estimate. Z୧୩ represents the meta-independent variables described earlier in 
table 1 The constant term, α denotes the mean OIS predicted by the MRA model if all other 
predictor variables Z୧୩ are zero. Hence this is used in this study as the base estimate or 
predicted “standard” OIS (Colegrave and Giles 2008). α୫ denotes the mean deviation from 
the constant term and standard OIS, α. ε୧ is a random error term. 
We are concerned about heteroscedasticity especially since the estimates are based on 
different sample sizes. To ensure that our MRA estimates are BLUE, we carry out tests for 
heteroscedasticity (Breusch-Pagan test) and multicollinearity (Variance Inflation Factor-VIF), 
and if necessary use robust standard errors to counter heteroscedasticity. We also check for 
omitted variable bias and misspecification using the Ramsey RESET test. 
3. Results 
Table 5 presents the results of our MRA model (equation 3, n=30). OIS represents our 
dependent variable and parameter of interest for the study. From the original 15 meta-independent 
variables, we only include 13 variables, excluding sample size and year of data.
This is because these two variables substantially contribute to heteroscedasticity in the 
model5. After excluding these variables, we estimated our model using OLS. 
15 
Table 5 MRA results (n=30) 
Dependent Variable-OIS 
Model 1 
(OLS) 
Model 2 
(Robust SE) 
Coefficient t t 
Constant 24,954.45 3.07*** 4.36*** 
Institutional Type 
Public 7,615.22 0.72 0.81 
College -14,657.84 -3.16*** -5.02*** 
Mixed -10,809.22 -1.87* -3.50*** 
Mixed2 13,337.35 2.17** 2.46*** 
Referent-Private 
Other independent 
variables 
InputQ -428.33 -0.10 -0.18 
OutputQ -3,823.91 -0.61 -0.77 
MP 4,403.65 1.19 1.17 
Form 6,071.67 1.43 2.18** 
Totalcost -6,803.55 -0.88 -1.15 
HC -8,987.01 -1.34 -1.60 
Pub -2.706.69 -0.75 -1.03 
non-US -8,959.18 -1.56 -1.87* 
Subgroup -5,721.37 -1.73 -2.62** 
R2=0.65 R2=0.80 
F 13,16=5.10*** F 13,16=8.53*** 
BP=3.10* 
Ramsey RESET=1.67 
(F 3,13 P=0.222) 
Notes: ***, ** and * denote significance at the 1 per cent, 5 per cent and 10 per cent levels, respectively. BP is 
Breusch-Pagan test. 
The model is significant at 1 per cent level and has an adjusted R2 of 0.65. Our specification 
tests show that the variance inflation factor of independent variables is below 10 (rule of 
thumb) suggesting reason not to be concerned about multicollinearity (see Appendix C). The 
Ramsey RESET test indicates that the model neither has omitted variable bias nor is it mis-specified 
(p=0.222). However the Breusch-Pagan Test is still significant at 10 per cent level, 
suggesting we should still be concerned about heteroscedasticity in the model. In order to 
5 With these variables in the model, the Breusch-Pagan test is 3.68 (p=0.055)
counter this, a second estimation of the model was done with robust standard errors (model 
2). Since the coefficients of the meta-independent variables do not change, we report only 
the t-values from the second estimation with robust standard errors. The model with robust 
standard errors has an R2 of 0.80. Our interpretation of results is based on the second model. 
The results show that the intercept (our standard model estimate of OIS) is 24,954 full time 
equivalent student enrolment (p<0.01). This is the base model when all the meta-independent 
variables are all equal to zero. The reference category for institutional type is the private 
university variable, which corresponds to the standard model estimate of 24,954 students. 
The public university variable is not significant, an indication that estimates based on public 
universities samples, on average are not significantly different from the intercept (which is 
also our reference variable private university). Several meta-independent variables 
significantly affect our OIS estimate. Studies which based their estimates on small colleges 
on average reduce the standard model estimate by 14,657 students (p<0.01) while studies 
which based their estimates on mixed samples of HEIs, on average reduce the standard model 
estimate by 10,809 students. Studies which based their estimates on mixed samples of public 
and private universities increase the standard model estimate by 13, 337 students (p<0.01). 
Other significant variables concern the type of data and sample used and the functional form 
of model used. Studies based on subgroups, on average reduce the standard model estimate 
by 5,721 students, while studies based on non-US data6, on average reduce the standard 
model estimate by 8,959 students. Studies that used quadratic cost functions, on average 
increase the standard model estimate by 6,071 students. Omitting input quality, price 
variables or output quality variables in a study does not significantly affect our standard 
16 
6 Non-US data is based on four estimates from three studies from Australia, Turkey and Taiwan.
model estimate; neither does publishing in peer reviewed outlets nor testing for 
heteroscedasticity. Studies that used multi-product cost functions (vs. single product) or 
studies that used total costs as their dependent variable (vs. variable costs) also do not 
significantly change our standard model estimate. 
17 
4. Discussion 
4.1 Policy implications 
The standard estimate of OIS and how meta-independent variables affect it have possible 
implications on strategies for HEI mergers. For interpretation, we add the coefficients of 
significant institutional type variables to the standard model estimate to get the predicted OIS 
for each type of institution. 
In our analysis, public universities are predicted to have an OIS which is the same as the 
standard model estimate of 24,954 students. Average institutional size for public university 
samples in the reviewed literature is about 8,608 students. This probably indicates or justifies 
an argument for mergers. Hence, public universities of average sample size can increase 
student enrolment by about 190 per cent as they experience declining average costs until they 
reach 24,954 students, the optimal point. Our analysis predicts the OIS for private 
universities to be equivalent to the standard model OIS of 24,954 students. The average size 
for private universities in our sample is 10,784 students. Hence, there is room or justification 
for increasing private university size by 131 per cent of the sample mean to reach the optimal 
point. However, there are caveats to these findings. Since the average institutional size and 
predicted OIS are based on two non-US studies (Australia and Taiwan), where public 
universities could be smaller than US public universities), the implied expansion path is
likely more applicable to non-US countries than the US. Moreover, in the US, the cost-size 
relationship of public universities is influenced or obscured by the financing structure, where 
funding is dependent on enrolments (Laband and Lentz 2004, Getz and Siegfried 1991). The 
small sample of public university estimates also warrants caution in our interpretation. In 
addition, private university estimates in our sample are all based on US studies and might be 
less applicable to non-US contexts where private universities could be much smaller in size 
and may be less common. 
A cursory comparative analysis of our predicted optimum with actual sizes of top three 
universities based on Times Higher Education World University Rankings7 from each region 
shows varying opportunities for expansion (see appendix D). The top three universities in 
North America are all private universities with sizes in the range of 2,012 to 21,000 total 
students, indicating room for expansion in the range of 19 per cent to 1140 per cent. The top 
public university in North America is larger than the predicted optimum, and hence would 
need to contract by 31 per cent. In Europe the top three universities are all public with sizes 
ranging from 13,964 to 21,872 students, indicating expansions in the range of 14 per cent - 79 
per cent. In Asia, the top three universities are public institutions, with sizes ranging from 22, 
260 to 37, 304 students. However, based on our optimum, only one university has room for 
expansion (12 per cent) while the other two would face contraction in the range of 14 per cent 
and 33 per cent respectively. In Oceania, the top three universities are all Australian and 
publicly controlled with sizes ranging from 16,719 to 49,020 students. This would indicate 
room for expansion for one university by around 49 per cent, while the other two universities 
would need to contract by about 32 per cent and 49 per cent respectively. In South America, 
two of the top institutions are public universities and the third ranked institution is a private 
18 
7 http://www.timeshighereducation.co.uk/world-university-rankings/
university. They have sizes in the range of 22,848 (private) to 88,962 students. Comparing 
with our optimum, the two public universities would need to contract by 44 per cent and 72 
per cent respectively, while the private university can expand by 9 per cent. In Africa, the top 
three universities are public institutions with sizes ranging from 25,532 to 28,442 students. 
This would indicate that these institutions are slightly larger than our predicted optimum and 
would face contraction in the range of 2 per cent-12 per cent. 
The variable “colleges” is predicted to have a lower OIS than the standard estimate, about 
10,296 students. Considering that average “college” size in the reviewed literature is about 
979 students, this finding suggests room for average size colleges to expand by around 952 
per cent. This variable is based on studies that used samples of community colleges, liberal 
arts colleges and vocational schools. Predicted OIS for non-US HEIs is about 15,995 
students. Average non-US HEI size in the reviewed literature is 7,338 students. This would 
suggest expansion in size of non-US HEIs by about 118 per cent of the sample mean. 
However only four studies looked at non-US institutions suggesting a heavy bias in the 
literature towards US institutions. This bias maybe due to the ease of data availability or data 
reliability of HEI costs in the US. Hence caution is warranted in interpreting non-US data. 
While omitting input quality and output quality variables does not seem to influence study’s 
OIS estimate, what this study cannot dismiss is the potential effect of the input price on 
potential mergers. Our study faces shortcomings, one of them being that our sample size for 
the MRA is quite small. Previous studies have indicated that student-faculty ratio and the 
complexity of curriculum accounted for greater variation in institutional costs than enrolment 
size (Brinkman and Leslie 1986; McLaughlin et al. 1980). Hence, expanding institutional 
19
size, as mergers do, could also increase costs especially from higher faculty salaries or 
increased curricula potentially negating any economies of scale (Brinkman and Leslie 1986). 
Our analytical findings seem to suggest a justification for the potential expansion or merging 
of HEIs. Yet, there are several reasons to be cautious. First, institutional characteristics and 
location of HEIs appear to influence the cost –size relationship. Second, our preliminary 
comparisons with actual sizes of top ranked institutions show a varied picture on expansion 
or contraction. Third, there are shortcomings of our data, in particular the limited sample. 
Hence, we recommend policymakers in US or non-US locations to refer to their own cost 
structures to determine the optimal size for efficiency (Colegrave and Giles 2008). 
20 
4.2 Research implications 
Our findings also have implications on current and future research in this area. Our analysis 
produced several important insights on how empirical methodology influences OIS estimates. 
The type of functional form used in cost functions seems to matter. For instance, estimates 
based on quadratic cost functions increase the standard model OIS by about 6,071 students. 
The use of quadratic or cubic cost functions in estimating economies of scale for HEIs 
became the norm starting in the mid-1980s in articles by Throsby (1986) and Cohn et al. 
(1989), unlike earlier studies where linear functional forms where commonplace. Hence, one 
may argue that functional form acts as an indirect indicator of a time trend in the 
methodology and may influence estimates.
However as expected and earlier illustrated, our limited sample size is a major shortcoming. 
This makes it difficult for us to draw firm conclusions on our findings. Furthermore, our 
sample distribution is skewed towards smaller colleges (10 estimates) or estimates from 
mixed HEIs (9 estimates), for a total of 19 out of 30 estimates. Thus, studies determining the 
cost-size relationship of small colleges or estimating economies of scale based on mixed 
samples of universities and colleges (which have different sizes and costs) currently dominate 
the literature. While, our efforts in searching for the relevant studies were rigorous, there is a 
small possibility that we missed unpublished articles which might have increased our sample 
size. In addition, we identified many other studies that estimated economies of scale but did 
not specifically reveal the optimal institutional size in their estimates. We hope that this MRA 
will encourage future researchers to produce OIS estimates when estimating cost functions. 
21 
5. Conclusion 
This paper used the meta-regression analysis method to determine a standard OIS in higher 
education. Our findings indicate a standard OIS of 24,954 students. The meta-regression 
analysis shows that the predicted standard OIS is negatively influenced by; studies based on 
small college samples and samples of mixed HEIs, the use of subsamples, studies based on 
non-US data. The standard OIS is positively influenced by studies based on samples of mixed 
public and private universities and the use of quadratic or cubic cost functions. The OIS for 
public universities is not significantly different from the standard OIS estimate (also private 
university estimate). We find a potential for HEIs to expand their size by different 
magnitudes; public universities by about 190 per cent of the sample mean size, private 
universities by 131 per cent of the sample mean size, small colleges by around 952 per cent 
of the sample mean size, and non-US HEIs by about 118 per cent of the sample mean. 
However, if we compare optimum sizes with actual sizes of top ranked universities in the
Times Higher Education World University Rankings a more mixed impression emerges: in 
some parts of the world top ranked universities seem to be below optimal size, while in others 
they appear above optimal size. However, we urge caution in the interpretation of the 
findings due to the still limited sample of studies producing optimal institutional size 
estimates and the dominance of optimal institutional size estimates of small colleges in the 
literature. We therefore recommend further research in this area. We also recommend 
policymakers in US or non-US locations to refer to their own cost structures to determine the 
optimal size for efficiency. 
22 
Acknowledgements 
We are grateful to Sabrina Wollmann for her assistance during the search for literature.
23 
References 
Brinkman, P. T. (1981). Marginal costs of instruction in public higher education. Ph.D. 
dissertation, University of Arizona. 
Brinkman, P. T. & Leslie, L. L. (1986). Economies of scale in higher education: sixty years 
of Research, Review of Higher Education, 10, 1- 28. 
Cohn, E., Rhine, S. L. W. & Santos, M. C. (1989) Institutions of higher education as 
multiproduct firms: economies of scale and scope, Review of Economics and Statistics, 71, 
284-290. 
Colegrave, A. D., & Giles, M. J. (2008). School Cost Functions: A Meta-Regression 
Analysis. Economics of Education Review, 27(6), 688–696. 
de Groot, H., McMahon, W. W. & Volkwein, J. F. (1991) The cost structure of American 
research universities, Review of Economics and Statistics, 73, 424-431. 
Dougherty, C. (1990). Unit costs and economies of scale in vocational and technical 
education: evidence from the People’s Republic of China. Economics of Education Review, 
9(4), 389-394 
Dundar, H. & Lewis, D. R. (1995). Departmental productivity in American universities: 
economies of scale and scope, Economics of Education Review, 14, 199-244. 
Fu, T.T., Huang, C. J. & Tien, F. F. (2008). University Cost Structure in Taiwan. 
Contemporary Economic Policy, 26,651–662. 
Getz, M. & J.J. Siegfried. 1991. Costs and Enrollment. In C. T. Clotfelter, R.G. Ehrenberg, 
R. Getz and J. J. Siegfried (Ed.), Economic Challenges in Higher Education (p. 332 - 356). 
Chicago: University of Chicago Press. 
Getz, M., Siegfried, J. J., & Zhang, H. (1991). Estimating economies of scale in higher 
education. Economic Letters, 37, 203–208. 
Goudriaan, R., and de Groot, H. (1993). State regulation and university behaviour. Journal of 
Economic Behavior and Organization 20,309-318.
Hashimoto, K. & Cohn, E. (1997). Economies of scale and scope in Japanese private 
universities. Education Economics, 5,107-116. 
Heaton, C. & Throsby, D. (1997). Cost Functions for Australian Universities: A Survey of 
Results with Implications for Policy. Paper 2, Discussion Paper 360. Canberra: Centre for 
Economic Policy Research, ANU, 11–20. 
Koshal, R. K. & Koshal M. (1995). Quality and economies of scale in higher education, 
Applied Economics, 22, 3- 8. 
Koshal, R. K. & Koshal M .(2000). “Do Liberal Arts Colleges Exhibit Economies of Scale 
and Scope?”, Education Economics, 8 (3), 209-220. 
Koshal, R. K., Koshal, M. & Gupta, A. (2001). Multi-Product Total Cost Function for Higher 
Education: A Case of Bible Colleges. Economics of Education Review, 20, 297-303. 
Lenton, P. (2008). The cost structure of higher education in further education colleges in 
England. Eonomomics of Education Review, 27, 471–482. 
Lewis, D., & H. Dundar. (1995). Economies of Scale and Scope in Turkish Universities. 
Educational Economics, 3, 133–158. 
Lloyd, P. J., Morgan, M. H. & Williams, R. A. (1993). Amalgamation of universities: are 
there economies of scale or scope? Applied Economics, 25, 1081-1092. 
Longlong, H., Fengliang, L. & Weifang, M. (2009). Multi-product total cost functions for 
higher education: The case of Chinese research universities. Economics of Education Review, 
28(4), 505-511. 
Lyell, E. H. The Cost Structure of Higher Education: Implications for Governmental Policy 
in Steady State. Paper presented at the Annual Meeting of the American Educational 
Research Association, San Francisco, April, 1979. 
Maynard, J. (1971). Some microeconomics of higher education. Lincoln, University of 
Nebraska Press. 
24
Sav, G. T. (2011). Panel Data Estimates of Public Higher Education Scale and Scope 
Economies. Atlantic Economic Journal 39 (2), 143–153. 
Stanley, T.D., & Jarrell, S.B. (1989). Meta-regression Analysis; A Quantitative method of 
Literature Surveys. Journal of Economic Surveys, 3(2), 161–170. 
Stanley, T.D. (2001). Wheat from Chaff: Meta Analysis as a Quantitative Literature Review. 
Journal of Economic Perspectives, 15(3), 131–150. 
25 
Throsby, C.D. (1986). Cost Functions for Australian Universities, Australian Economic 
Papers 25, 175–192. 
Varadi, B. (2001). Multiproduct Cost Function Estimation for American Higher Education: 
Economies of Scale and Scope. Discussion Papers MT–DP. 2001/11, Institute of Economics, 
Hungarian Academy of Sciences 
Worthington, A.C, & Higgs, H. (2011): Economies of scale and scope in Australian higher 
education. Higher Education, 61, 387-414.
26 
Appendix A 
Studies included in the MRA 
Author Country Pub Yr OIS Public Private College Mixed Mixed2 
Brinkman USA 1981 1750 0 0 1 0 0 
Brinkman USA 1981 3500 0 0 1 0 0 
Cohn et al USA 1989 5120 0 0 0 1 0 
Cohn et al USA 1989 4842 0 0 0 1 0 
Cohn et al USA 1989 2110 0 0 0 1 0 
DeGroot et al USA 1991 45000 0 0 0 0 1 
DeGroot et al USA 1991 17000 0 1 0 0 0 
Lewis & Dundar Turkey 1995 1600 0 0 1 0 0 
Fu et al Taiwan 2008 10481 1 0 0 0 0 
Fu et al Taiwan 2008 18141 0 0 0 0 1 
Getz and Siegfried USA 1991 1100 0 0 1 0 0 
Getz and Siegfried USA 1991 1600 0 0 1 0 0 
Getz and Siegfried USA 1991 20227 0 1 0 0 0 
Getz and Siegfried USA 1991 2150 0 0 1 0 0 
Getz and Siegfried USA 1991 18934 0 1 0 0 0 
Getz et al USA 1991 1115 0 0 1 0 0 
Getz et al USA 1991 2153 0 0 1 0 0 
Getz et al USA 1991 1584 0 0 1 0 0 
Koshal and Koshal USA 1995 30957 0 0 0 0 1 
Koshal and Koshal USA 1995 11758 0 0 0 0 1 
Koshal and Koshal USA 1995 16112 0 0 0 0 1 
Koshal and Koshal USA 1995 22174 0 0 0 0 1 
Koshal and Koshal USA 2000 2472 0 0 1 0 0 
Laband and Lentz USA 2004 19800 0 0 0 1 0 
Maynard USA 1971 5300 0 0 0 1 0 
Throsby Aus 1986 13000 1 0 0 0 0 
Varadi USA 2001 9800 0 0 0 1 0 
Varadi USA 2001 16000 0 0 0 1 0 
Varadi USA 2001 7720 0 0 0 1 0
27 
Appendix B 
Average Institutional Size, n=22 
Mean Std. Dev. 
Full sample 8,013.23 5,840.35 
Public (n=3) 8,608.5 1,501.19 
Private (n=3) 10,784 807.14 
College (n=3) 979.39 355.80 
Mixed (n=8) 4,343.1 2,217.44 
Mixed2 (n=5) 14,839.83 4,868.98
28 
Appendix C 
Test for Multicollinearity 
Variable VIF 1/VIF 
HC 7.39 0.135 
OutputQ 7.21 0.139 
Mixed 5.51 0.182 
Public 5.39 0.185 
Totalcost 5.19 0.193 
Mixed2 4.71 0.212 
College 3.74 0.268 
InputQ 3.47 0.288 
Non-US 2.99 0.335 
Form 2.52 0.397 
MP 2.5 0.400 
Pub 2.34 0.428 
Subgroup 1.91 0.524 
Mean VIF 4.22 
Notes: VIF denotes variance inflation factor
29 
Appendix D 
Actual Sizes of Top-Ranked Universities from World Regions 
Institution Size Public Private Country 
Expansion 
(Contraction) 
North America 
California Institute of Technology 2,231 √ USA 1119% 
Harvard University 21,000 √ USA 119% 
Stanford University 19,945 √ USA 125% 
University of California Berkeley 36,142 √ USA (31%) 
Europe 
University of Oxford 21,872 √ UK 114% 
University of Cambridge 18,306 √ UK 136% 
Imperial College of London 13,964 √ UK 179% 
Oceania 
University of Melbourne 36,626 √ Australia (32%) 
Australia National University 16,719 √ Australia 149% 
University of Sydney 49,020 √ Australia (49%) 
Asia 
University of Tokyo 28,978 √ Japan (14%) 
University of Hong Kong 22,260 √ Hong Kong 112% 
National University of Singapore 37,304 √ Singapore (33%) 
South America 
University of Sao Paulo 88,962 √ Brazil (72%) 
State University of Campinas 44,519 √ Brazil (44%) 
Pontifical Catholic University of Chile 22,848 √ Chile 109% 
Africa 
University of Cape Town 25,352 √ South Africa (2%) 
Stellenbosch University 28,193 √ South Africa (11%) 
University of Witwatersrand 28,442 √ South Africa (12%) 
Notes: Rankings based on Times Higher Education World University Rankings. Actual institutional sizes are 
from each university’s website. Magnitude of expansion or contraction is relative to the optimum of 24,954 
students. Expansion is by multiplication and contraction by subtraction.
The UNU‐MERIT WORKING Paper Series 
2014-01 The medium‐term effect of R&D on firm growth by Marco Capasso, Tania Treibich 
and Bart Verspagen 
2014-02 Diverse and uneven pathways towards transition to low carbon development: The 
case of diffusion of solar PV technology in ChinaMichiko Iizuka 
2014-03 User innovators and their influence on innovation activities of firms in Finland by 
JariKuusisto, MerviNiemi and Fred Gault 
2014-04 Migration, remittances and household welfare in Ethiopia by Lisa Andersson 
2014-05 Path‐breaking directions of nanotechnology‐based chemotherapy and molecular 
cancer therapy by Mario Coccia and Lili Wang 
2014-06 Poor trends ‐ The pace of poverty reduction after the Millennium Development 
AgendaRichard Bluhm, Denis de Crombrugghe, Adam Szirmai 
2014-07 Firms' adoption of international standards: Evidence from the Ethiopian floriculture 
sector by MuluGebreeyesu 
2014-08 School choice, segregation, and forced school closureby Cheng Boon Ong 
andKristof De Witte 
2014-09 Gender difference in support for democracy in Sub‐Saharan Africa: Do social 
institutions matter?by MatyKonte 
2014-10 Why are women less democratic than men? Evidence from Sub‐Saharan African 
countries by Cecilia García‐Peñalosa and MatyKonte 
2014-11 Tipping points? Ethnic composition change in Dutch big city neighbourhoods by 
Cheng Boon Ong 
2014-12 Technology life cycle and specialization patterns of latecomer countries. The case 
of the semiconductor industry by Giorgio Triulzi 
2014-13 Patents as quality signals? The implications for financing constraints on R&D by 
Dirk Czarnitzki, Bronwyn H. Hall and Hanna Hottenrott 
2014-14 Assessment of effectiveness of Chinese aid in competence building and financing 
development in Sudan by SamiaSatti Osman Mohamed Nour 
2014-15 Education, training and skill development policies in Arab Gulf countries: Macro‐micro 
overview by SamiaSatti Osman Mohamed Nour 
2014-16 Structure of labour market and unemployment in Sudan by SamiaSatti Osman 
Mohamed Nour 
2014-17 Overview of knowledge transfer in MENA countries ‐ The case of Egypt by 
SamiaSatti Osman Mohamed Nour 
2014-18 The impact of ICT in public and private universities in Sudanby SamiaSatti Osman 
Mohamed Nour 
2014-19 End‐user collaboration for process innovation in services: The role of internal 
resources by Mona Ashok, Rajneesh Narula and Andrea Martinez‐Noya 
2014-20 Public investment and regional politics: The case of Turkey by Mehmet Guney 
Celbis, Denis de Crombrugghe and Joan Muysken 
2014-21 Infrastructure and the international export performance of Turkish regions by 
Mehmet Guney Celbis, Peter Nijkamp and Jacques Poot 
2014-22 Discovering and explaining work‐family strategies of parents in Luxembourg by 
Nevena Zhelyazkova 
2014-23 Parental leave take up and return to work of mothers in Luxembourg: An 
application of the model of nested dichotomies by Nevena Zhelyazkova
2014-24 Millennium Development Goals: Tool or token of global social governance? by 
Mueid Al Raee, Elvis Amoateng, Elvis Korku Avenyo, Youssef Beshay, Mira 
Bierbaum, Charlotte Keijser and Rashmi Sinha 
2014-25 One Europe or several? Causes and consequences of the European stagnation by 
Jan Fagerberg and Bart Verspagen 
2014-26 The harmony of programs package: Quasi‐experimental evidence on deworming 
and canteen interventions in rural Senegal by Théophile Azomahou, Fatoumata 
Diallo and Wladimir Raymond 
2014-27 Country Terms of Trade 1960‐2012: Trends, unit roots, over‐differencing, 
endogeneity, time dummies, and heterogeneity by Thomas Ziesemer 
2014-28 The structure and comparative advantages of China's scientific research ‐ 
Quantitative and qualitative perspectives by Lili Wang 
2014-29 Transition to knowledge‐based economy in Saudi Arabia by Samia Satti Osman 
Mohamed Nour 
2014-30 Challenges and opportunities for transition to knowledge‐based economy in Arab 
Gulf countries by Samia Satti Osman Mohamed Nour 
2014-31 Migration of international students and mobilizing skills in the MENA Region by 
Samia Satti Osman Mohamed Nour 
2014-32 Beyond product innovation; improving innovation policy support for SMEs in 
traditional industries by René Wintjes, David Douglas, Jon Fairburn, Hugo 
Hollanders and Geoffrey Pugh 
2014-33 The impact of innovation support programmes on SME innovation in traditional 
manufacturing industries: an evaluation for seven EU regions by Dragana Radicic, 
Geoffrey Pugh, Hugo Hollanders and René Wintjes 
2014-34 Beliefs dynamics in communication networks by Théophile T. Azomahou and Daniel 
C. Opolot 
2014-35 Stability and strategic diffusion in networks by Théophile T. Azomahou and Daniel 
C. Opolot 
2014-36 Epsilon‐stability and the speed of learning in network games by Théophile T. 
Azomahou and Daniel C. Opolot 
2014-37 Afghan unaccompanied minors in the Netherlands: Far away from home and 
protected? by Carla Buil and Melissa Siegel 
2014-38 Multinational production and trade in an endogenous growth model with 
heterogeneous firms by Hibret B. Maemir and Thomas Ziesemer 
2014-39 The political economy of research and innovation in organic photovoltaics (OPV) in 
different world regions by Serdar Türkeli and René Kemp 
2014-40 Towards the societal system of innovation: The case of metropolitan areas in 
Europe by Serdar Türkeli and René Wintjes 
2014-41 To return permanently or to return temporarily? Explaining migrants' intentions by 
Özge Bilgili and Melissa Siegel 
2014-42 Catching up and lagging behind in a balance‐of‐payments‐constrained dual 
economy by Alejandro Lavopa 
2014-43 An introduction to the economics of rare earths by Eva Bartekova 
2014-44 The unequal effect of India's industrial liberalization on firms' decision to innovate: 
Do business conditions matter? By Maria Bas and Caroline Paunov 
2014-45 Insurgents in motion: Counterinsurgency and insurgency relocation in Iraq by Pui‐hang 
Wong
2014-46 Successive leadership changes in the regional jet industry by Daniel Vertesy 
2014-47 Demand, credit and macroeconomic dynamics: A microsimulation model by Huub 
Meijers, Önder Nomaler and Bart Verspagen 
2014-48 Accessibility analysis as an urban planning tool: Gas station location by D.A. 
Escobar , C. Cadena‐Gaitán, F.J. Garcia 
2014-49 China's economic embrace of Africa ‐ An international comparative perspective by 
Tobias Broich and Adam Szirmai 
2014-50 Mapping regional social enterprise ecosystems in India: Framework and indicators 
by Lina Sonne 
2014-51 Does shelter assistance reduce poverty in Afghanistan? By Craig Loschmann, 
Christopher R. Parsons and Melissa Siegel 
2014-52 How important is innovation? A Bayesian factor‐augmented productivity model on 
panel data by Georges Bresson, Jean‐Michel Etienne and Pierre Mohnen 
2014-53 Does too much work hamper innovation? Evidence for diminishing returns of work 
hours for patent grants by Mehmet Güney Celbi¸ Serdar Türkeli 
2014-54 Globalization, the rise of biotechnology and catching up in agricultural innovation: 
The case of Bt technology in India Michiko Iizuka and Ajay Thutupalli 
2014-55 Where are innovation indicators, and their applications, going? by Fred Gault 
2014-56 Productivity in services in Latin America and the Caribbean by Elena Arias‐Ortiz, 
Gustavo Crespi, Alejandro Rasteletti and Fernando Vargas 
2014-57 Optimal public investment, growth, and consumption: Fresh evidence from African 
countries by Augustin Kwasi Fosu, Yoseph Yilma Getachew and Thomas H.W. 
Ziesemer 
2014-58 International R&D alliances by firms: Origins and development by Rajneesh Narula 
and Andrea Martínez‐Noya 
2014-59 Appropriability mechanisms, innovation and productivity: Evidence from the UK by 
Bronwyn H. Hall and Vania Sena 
2014-60 The size of patent categories: USPTO 1976‐2006 by François Lafond 
2014-61 Asset recombination in international partnerships as a source of improved 
innovation capabilities in China by Simon C. Collinson and Rajneesh Narula 
2014-62 The viability of sustained growth by India's MNEs: India's dual economy and 
constraints from location assets by Rajneesh Narula 
2014-63 The effect of unconditional cash transfers on adult labour supply: A unitary discrete 
choice model for the case of Ecuador by Andrés Mideros and Cathal O'Donoghue 
2014-64 Giving in South Africa: Determining the influence of altruism, inequality aversion 
and social capital by Nyasha Tirivayi 
2014-65 The impact of food transfers for people living with HIV/AIDS: Evidence from Zambia 
by Nyasha Tirivayi and Wim Groot 
2014-66 Size and economies of scale in higher education and the implications for mergers by 
Nyasha Tirivayi, Henriette Maasen van den Brink and Wim Groot

Wp2014 066

  • 1.
    #2014-066 UNU‐MERIT WorkingPaper Series Size and economies of scale in higher education and the implications for mergers Nyasha Tirivayi, Henriette Maasen van den Brink and Wim Groot Maastricht Economic and social Research institute on Innovation and Technology (UNU‐MERIT) email: info@merit.unu.edu | website: http://www.merit.unu.edu Maastricht Graduate School of Governance (MGSoG) email: info‐governance@maastrichtuniversity.nl | website: http://mgsog.merit.unu.edu Keizer Karelplein 19, 6211 TC Maastricht, The Netherlands Tel: (31) (43) 388 4400, Fax: (31) (43) 388 4499
  • 2.
    UNU-MERIT Working Papers ISSN 1871-9872 Maastricht Economic and social Research Institute on Innovation and Technology, UNU-MERIT Maastricht Graduate School of Governance MGSoG UNU-MERIT Working Papers intend to disseminate preliminary results of research carried out at UNU-MERIT and MGSoG to stimulate discussion on the issues raised.
  • 3.
    1 Size andEconomies of Scale in Higher Education and the Implications for Mergers Nyasha Tirivayi1*, Henriette Maasen van den Brink2 , Wim Groot3 August 2014 Abstract This paper carries out a meta regression analysis to estimate the optimal size of higher education institutions (HEI) and identify its implications for strategies of mergers in higher education. This study finds an optimal institutional size of 24,954 students. We find potential opportunities for merging different HEIs relative to their mean sample size: public universities by nearly 190 per cent, private universities by 131 per cent, small colleges by around 952 per cent, and non-US HEIs by about 118 per cent. However, if we compare with actual sizes of top ranked universities we find that in some parts of the world top ranked universities seem to be below optimal size, while in others they appear above optimal size. We urge caution in the interpretation of the findings due to the limited data. We recommend further research and that policymakers around the world refer to their own cost structures to determine the optimal size for efficiency. JEL Classification: I23, I21, I22 Keywords: Size, economies of scale, higher education, mergers, optimal size 1 Corresponding author. UNU-MERIT, Keizer Karelplein 19, 6211 TC, Maastricht. The Netherlands. tirivayi@merit.unu.edu 2 Top Institute for Evidence Based Education Research (TIER), Maastricht University, Kapoenstraat 2, 6211 KW, Maastricht, Netherlands 3 Top Institute for Evidence Based Education Research (TIER), Maastricht University, Kapoenstraat 2, 6211 KW, Maastricht, Netherlands
  • 4.
    2 1. Introduction In higher education, universities and colleges make decisions on how to efficiently use resources in order to enhance and maintain a sustainable competitive position (Bonaccorsi et al. 2007). Consequently, management of higher education institutions (HEIs) have a strong interest in cost minimization (Laband and Lentz 2003). Elements affecting decisions on cost minimization include quantity and quality of output, whether to specialize or produce multiple outputs or whether the institution should be small or large in either student enrolment or research (Laband and Lentz 2003). Mergers are often perceived as a means to achieve cost savings through increased economies of scale and a means to reduce competition in the market. It is within this context that the education literature includes many econometric studies that analyse economies of scale in HEIs by identifying the optimal size for a HEI or attempt to justify the need for mergers of institutions (Patterson 2000). In most of the analyses of economies of scale, the focus is to establish if larger institutions incur lower costs than small institutions and thus determine at what size a HEI functions at optimum efficiency (Patterson 2000). Size is usually measured in terms of student enrolment and economies of scale arise when the cost of providing education falls as the student enrolment increases (Lloyd et al. 1993). Student enrolment is the most common measure used for teaching output and an essential contributor to institutional costs (Cohn et al. 1989; de Groot et al. 1991). In the short-term an HEI can achieve economies of scale by lowering quality and boosting quantity (student enrolment), but in the long term the quality of instruction and research output also influence the HEI cost structure and are vital determinants of economies of scale in higher education (Fu et al. 2008).
  • 5.
    Many empirical studieshave been carried out to determine if there are economies of scale in higher education. The size-cost relationship has been presented in many ways including through estimations of cost functions, calculations of the overall and product specific economies of scale and illustrations of the shape of the average or marginal cost curves. In the USA, a seminal review of studies conducted in the previous 50 years was carried out by Brinkman and Leslie (1986). Their review focused on the size-cost relationship in US higher education and concluded that economies of scale are most likely to occur at the low end of student enrolment range i.e. 1000 full time equivalent (fte) students in two year colleges and 1500-2000 fte students in four year colleges (Brinkman and Leslie 1986, Patterson 2000). However, they also determined that nature and strength of the economies of scale were not only influenced by size, but also by type of institution, type of costs (administrative vs instructional), input prices like salaries paid and breadth of curriculum (Patterson 2000, Brinkman and Leslie 1986). A popular strategy for cost minimization and boosting competitiveness in higher education has been the merger of HEIs. In Europe, USA, Australia and China, there have been comprehensive mergers of HEIs (Lloyd et al. 1993, Mao et al. 2009, Paterson 2000). One of the main reasons and arguments for the mergers is the expected increase in size and scope of the institution and ultimately economies of scale which would provide an economic benefit and could free resources to improve quality of output (Patterson 2000). There is however limited empirical literature on the economic benefits of such mergers and whether mergers directly result in lower education costs or savings. However, there exist several studies that have generally sought to establish the size-cost relationship and prove the existence of economies of scale in HEIs (Patterson 2000, Cohn et al. 1989, de Groot et al. 1991). 3
  • 6.
    This paper’s maininterest is to derive from the empirical literature a “standard” optimal HEI size, show how it varies by characteristics of the HEIs and each study, and to discuss the implications on strategies of mergers in higher education. The paper employs a systematic review approach in collating the relevant empirical literature. The empirical studies reviewed, use a variety of estimation techniques, models and data in determining economies of scale in higher education institutions. Hence in order to make the estimates comparable meta regression analysis will be used (Stanley and Jarrell 1989). To our knowledge this is the first study to utilize meta regression analysis to compute a base estimate of the optimal HEI size. We adapt the meta regression analysis guidelines laid out by Stanley and Jarell (1989) and the approach utilized by Colegrave and Giles (2008) to compute a “standard” estimate of an optimal school size and how independent variables increased or decreased the “standard”. The paper is organized as follows, section II details the methodology used in the literature search and the meta regression analysis. Section III presents the findings of the meta regression analysis. Section IV discusses the results and their strategic implications on mergers in higher education. The paper concludes by providing suggestions for further research. 4 2. Methodology 2.1 Background on Meta Regression Analysis Meta regression analysis (MRA) is an approach used in meta analysis. It is especially useful when the control and experimental groups required in a comprehensive meta analysis are not available (Stanley and Jarell 1989). MRA’s design allows for the control of biases found in non-experimental studies. The steps to conducting an MRA include a) searching and documenting all relevant studies, b) choosing the summary statistic for the dependent
  • 7.
    variable, c) selectingmeta-independent variables pertaining to the study design and conduct, d) carrying out the MRA and finally e) conducting specification tests (Stanley 2001). 2.2 Search for Relevant Studies We initially searched for the existing literature and systematic reviews on the subject matter. We identified two literature reviews; Patterson (2000) and Brinkman and Leslie (1986). We selected keywords based on our reading of these earlier literature reviews. The keywords that were chosen are “economies of scale”, “cost structure” and “cost function”. The keywords were used in combination with the terms “higher education”, “colleges” and “universities” and a requirement that each study contain an exact term “ray economies of scale”. We then searched for relevant published empirical articles, books, book chapters and working papers during the period October 2011 to April 2014. The following electronic databases and search engines were searched: ERIC, PsycINFO, Science Direct, SAGE, JSTOR, Social Science Research Network, Economic Papers, Wiley, Taylor and Francis, Springer and Google Scholar. Our initial search yielded 155 studies with estimates of economies of scale including about 7 references from Brinkman and Leslie (1986). Relevant studies had to meet the following inclusion criteria: 1) Studies analyse economies of scale by estimating institutional cost functions. The general methodology involves estimating total costs as a function of outputs S (e.g. student enrolments and research), exogenous inputs and input quality measures, Xi (e.g. institutional characteristics, student-faculty ratio), output quality, Qi (e.g. 5
  • 8.
    entrance scores, academicreputation), and input prices, pi (e.g. faculty compensation). Hence the total cost of an institution i can be expressed as follows: 6 , ܳ௜, ݌௜ሻ (1) ܶܥ௜ ൌ ݂ ሺܵ,ܺ௜ Functional forms for estimating economies of scale considered in this study include the earlier linear cost functions, constant elasticity substitution cost functions, and hybrid translog cost functions and the most common, quadratic cost function (Longlong et al 2009). The quadratic cost function, another way of presenting equation (1) is shown in equation (2): ߙ଴ ൅ ෍ ߙ௜ܵ௜ ൅ 1 2 ௡ ෍ ෍ ߚ௜௝ܵ௜௝ ௝ୀଵ ൅ ௡ ௜ୀଵ ௡ ௜ୀଵ ௡ ෍ ߛ௜ܺ௜ ൅ ෍ߜ௜ ܳ௜ ൅ ߠଵ݌௜ ൅ ௜ୀଵ ௡ ௜ୀଵ ߝ௜ (2) Where TC is the total cost of producing n outputs/products, α଴ is a constant, α୧ and β୧୨ are coefficients for the various output variables. Si represents the outputs; γ୧, δ୧ and θଵ are the coefficients of inputs/ input quality X୧ , output quality Q୧ and input price p୧ . ε୧ is a random error term. 2) Studies that estimated economies of scale for the whole institution. We excluded studies that estimated economies of scale for departments or courses (Lenton 2008, Lloyd et al. 1993, Dundar and Lewis 1995). 3) Studies that used total student enrolment (or graduate and undergraduate student enrolments) as a measure of teaching output in the cost functions. Studies that estimated economies of scale using measures such as student completion rates or
  • 9.
    student credit hourswere excluded from the study (Worthington and Higgs 2011, Sav 2011). 4) Studies that were published after 1960. Brinkman and Leslie (1986) clearly show that most studies published earlier than 1960 were mostly based on smaller samples, descriptive statistics and institutions that were on average smaller than contemporary higher education institutions today. The inclusion criteria confer some uniformity between the reviewed studies, ensuring relevance (Colegrave and Giles 2008). After applying our inclusion criteria, we identified 21 studies. Our literature search was thorough; however it is possible that some studies have been excluded due to unavailability in libraries or online. Studies such as Heaton (1996) and Heaton and Throsby (1997) were referenced in Patterson (2000), but could not be found anywhere online or in libraries. 2.3 Dependent variable In meta analyses, the effect size is the key variable of interest. In our study we looked at various articles that employed diverse estimation techniques in determining the economies of scale at higher education institutes and the optimal size at which average costs are lowest. The studies employed estimation methods such as linear regression, hybrid translog cost functions and quadratic multi-product cost functions. Consequently, choosing an effect size from the coefficients was problematic as they were difficult to standardize. In this paper we use optimal institutional size estimates as the dependent variable of our meta regression analysis. These estimates correspond to the institutional student enrolment where the minimum ray economies of scale are achieved. This is normally demonstrated on an average 7
  • 10.
    cost curve showinga minimum point after which, costs start rising again. Ray economies of scale refer to the reduction in average costs relative to marginal costs when a composition of output is assumed to remain fixed while its size is allowed to vary (Dundar and Lewis 1995). Hence, ray economies of scale are overall economies of scale over an output set. Ray economies of scale often indicate a decline or increase in total education costs as HEIs alter the levels of their outputs. As mentioned earlier, the most common outputs featured in economies of scale studies are student enrolment and research. For purposes of standardization, we selected total student enrolment as the main indicator for optimal institutional size4. In instances where the optimal size was given as an interval, we calculated the midpoint and used it instead in our analysis. After checking for the presence of our parameter of interest, we reduced our tally of studies from 21 to 12. We excluded studies that did not have optimal institutional size estimates or did not explicitly indicate the minimum ray average costs corresponding to the output mix (Lyell 1979, Sav 2011, Koshal et al. 2001, Dougherty 1990, Goudriaan and de Groot 1991, Hashimoto and Cohn 1997, Laband and Lentz 2003, Longlong et al. 2009, Worthington and Higgs 2011). Some of the 12 remaining studies provided more than one set of estimations based on either different functional forms (single product vs. multi product cost functions) or different subgroups (e.g. public vs. private universities). Multiple estimates of optimal institutional size (OIS) were treated as separate observations if they were based on separate models or subgroups of HEIs. Hence, the 12 studies on which our analysis is based on, produced 30 observations of OIS (see appendix A for complete list). 8 4 Where enrolment was split into undergraduate (UG) and graduate (G) numbers, we simply added the two numbers. Research output was excluded as an indicator as the indicators for the variable were too diverse ranging from publications, federal research grant money, general research grant money etc.
  • 11.
    9 2.4 Meta-IndependentVariables Twelve meta-independent or predictor variables were considered in the MRA. Ten of these are binary variables compared to two continuous variables. These variables were selected based on key feature variables described in Brinkman and Leslie (1986) and Colegrave and Giles (2008). The binary predictor variables describe type of data (non-US data, subgroup sample) and they also reflect the presence or absence of the following variables in the studies; input quality and price variables (i.e. student–faculty ratio, faculty salaries), an output quality variable (i.e. entrance test scores, academic reputation or rankings), exogenous input variables (i.e. institutional type e.g. public or private university). The continuous variables are sample size and year of data. Table 1 shows the definitions of meta-independent variables. Table 1 Meta-Independent Variables Code Definition A. Institutional Type Public =1 if public university Private =1 if private university College =1if small college/liberal arts/post secondary school Mixed =1 if mixed sample HEIs (all institutional types) Mixed2 =1 if mixed sample of public and private universities only B. Quality Indicators InputQ =1 if omitted input quality and price variables e.g. student-faculty ratio, faculty salaries OutputQ =1 if omitted output quality variables e.g. entrance test scores, academic reputation C. Datasets Non-US =1 if based on non-US data Subgroup =1 if based on a subsample Sample Sample size Year Year of data D. Model Specification MP =1 if study used a multi-product cost function Form =1 if study specified a quadratic cost function Totalcost =1 if total educational expenditures used as dependent variable in cost function (vs.variable costs) HC =1 if study tested for heteroscedasticity E. Publication characteristics Peer =1 if study published in peer-reviewed outlets Table 2 lists the 30 OIS estimates with their corresponding meta-independent variables.
  • 12.
    10 Table 2OIS and corresponding meta-independent variables OIS Public Private College Mixed Mixed2 InputQ OutputQ MP Form Totalcost HC Pub non-US Subgroup Sample Year 1750 0 0 1 0 0 0 1 0 0 1 0 2 0 0 119 1977.5 3500 0 0 1 0 0 0 1 0 0 1 0 2 0 0 585 1977.5 5120 0 0 0 1 0 0 1 0 1 1 0 1 0 0 692 1981.5 4842 0 0 0 1 0 0 1 1 1 1 0 1 0 0 692 1981.5 2110 0 0 0 1 0 0 1 0 1 1 0 1 0 0 1195 1981.5 45000 0 0 0 0 1 1 0 1 0 0 0 1 0 0 86 1982.5 17000 0 1 0 0 0 1 0 1 0 0 0 1 0 1 61 1982.5 1600 0 0 1 0 0 0 0 0 1 1 0 1 1 0 65 1991.5 10481 1 0 0 0 0 0 1 1 0 1 0 1 1 0 13 2000 18141 0 0 0 0 1 0 1 1 0 1 0 1 1 0 33 2000 1100 0 0 1 0 0 1 1 0 1 1 0 2 0 1 72 1987.5 1600 0 0 1 0 0 1 1 0 1 1 0 2 0 0 129 1987.5 20227 0 1 0 0 0 1 1 0 1 1 0 2 0 0 24 1987.5 2150 0 0 1 0 0 1 1 0 1 1 0 2 0 0 331 1987.5 18934 0 1 0 0 0 1 1 0 1 1 0 2 0 1 21 1987.5 1115 0 0 1 0 0 1 1 0 1 1 0 1 0 1 72 1987.5 2153 0 0 1 0 0 1 1 0 1 1 0 1 0 0 331 1987.5 1584 0 0 1 0 0 1 1 0 1 1 0 1 0 0 129 1987.5 30957 0 0 0 0 1 0 0 0 1 1 1 1 0 1 66 1990.5 11758 0 0 0 0 1 0 0 0 1 1 1 1 0 1 51 1990.5 16112 0 0 0 0 1 0 0 0 1 1 1 1 0 1 44 1990.5 22174 0 0 0 0 1 0 0 0 1 1 1 1 0 1 33 1990.5 2472 0 0 1 0 0 0 0 1 1 1 1 1 0 0 295 1994.5 19800 0 0 0 1 0 0 1 1 1 1 0 1 0 0 1450 1995.5 19800 0 0 0 1 0 0 1 1 1 1 0 1 0 0 1316 1995.5 5300 0 0 0 1 0 1 1 0 0 1 0 2 0 0 123 1967.5 13000 1 0 0 0 0 0 1 0 1 1 1 1 1 19 1980 9800 0 0 0 1 0 0 0 1 1 0 1 2 0 1 730 1994.5 16000 0 0 0 1 0 0 0 1 1 0 1 2 0 0 820 1994.5 7720 0 0 0 1 0 0 0 1 1 0 1 2 0 1 384 1994.5 Notes. Year was calculated as a midpoint for data obtained between two years e.g. 1987/1988 becomes 1987.5
  • 13.
    Table 3 presentsthe descriptive statistics. The mean OIS across the literature is around 11,110 students. Mean OIS refers to the average of the OIS estimates. The average institutional sizes from the study samples are presented in appendix B. However a closer look at OIS by institutional type indicates that estimates based on public and private university samples have a higher mean OIS of 11,740 and 18,720 students respectively, while for college samples the OIS is very low at 1,902, possibly pulling down the OIS into the mid-range OIS for all literature. Nearly 37 per cent of the estimates omitted input quality and price variables (e.g. student-faculty ratio, faculty salaries), compared to 63 per cent who omitted output quality variables (e.g. entrance test scores, academic reputation, rankings). About 63 per cent of the estimates were in peer-reviewed articles, 13 per cent are based on non-US data and 37 per cent of are based on multi-product cost functions, while only 30 per cent tested for heteroscedasticity. 11 Table 3 Descriptive Statistics (n=30) Mean Std. Dev. Optimal Institutional Size Full sample 11,110 10,427.36 Public (n=3) 11,740.5 1,781.20 Private (n=3) 18,720.33 1,624.08 College (n=10) 1,902.4 712.758 Mixed (n=9) 10,054.67 6,782.82 Mixed2 (n=5) 24,023.67 12,158.5 Rest of variables Public 0.067 0.254 Private 0.100 0.305 College 0.333 0.479 Mixed 0.300 0.466 Mixed2 0.200 0.407 InputQ 0.367 0.490 OutputQ 0.633 0.490 MP 0.367 0.490 Form 0.767 0.430 Totalcost 0.833 0.379 HC 0.300 0.466 Pub 0.633 0.490 Non-US 0.133 0.346 Subgroup 0.345 0.484
  • 14.
    Sample 332.700 415.288 Year 1987.817 7.191 Table 4 presents the correlation matrix of the OIS estimates and predictor variables. As seen from Table 4, a number of correlations are significant at the 1 per cent and 5 per cent levels. Notable high positive correlations are “non-US data” and public universities at about 0.68, studies based on mixed public and private universities and OIS at around 0.63, and “total costs (use of total costs in estimations)” and studies that omitted output quality variables at 0.58. Negative correlations include “total costs (use of total costs in estimations)” and studies that used multi-product cost functions at around 0.59, “small colleges” and OIS at around 0.64. Interestingly studies that tested for heteroscedasticity are positively correlated with “mixed samples of public and private universities” at 0.4, but negatively correlated with studies that omitted input quality and price variables in their estimations at around 0.5 and studies that omitted output quality variables in their estimates at around 0.71. Year of data is positively correlated with studies that used multiple product cost functions at around 0.48, an indication that these cost functions have become commonplace or more popular in recent years. 12
  • 15.
    13 Table 4Correlation Matrix OIS Public Private College Mixed Mixed2 InputQ OutputQ MP Form Totalcost HC Pub non-US Subgroup sample Year OIS 1 Public 0.016 1 Private 0.247 -0.089 1 College -0.635*** -0.189 -0.236 1 Mixed -0.067 -0.175 -0.218 -0.463** 1 Mixed2 0.630** -0.134 -0.167 -0.354 -0.327 1 InputQ -0.041 -0.203 0.438** 0.342 -0.347 -0.208 1 OutputQ -0.393** 0.203 0.023 0.245 0.045 -0.484*** 0.292 1 MP 0.33 0.074 -0.023 -0.391** 0.408** -0.035 -0.292 -0.282 1 Form -0.18 -0.169 -0.079 0.056 0.189 -0.118 -0.071 -0.093 -0.234 1 Totalcosts -0.349 0.120 -0.149 0.316 -0.293 -0.00001 -0.031 0.588*** -0.588*** 0.176 1 HC 0.213 0.117 -0.218 -0.309 0.048 0.400** -0.498*** -0.709*** 0.106 0.361** -0.293 1 Pub -0.23 -0.203 0.208 0.196 0.106 -0.380** 0.282 0.148 -0.148 -0.071 -0.217 -0.045 1 non-US -0.012 0.681*** -0.131 -0.069 -0.257 0.049 -0.298 0.095 0.109 -0.247 0.175 -0.043 -0.298 1 Subgroup 0.176 -0.189 0.236 -0.200 -0.154 0.354 0.049 -0.489*** -0.098 0.223 -0.253 0.463** 0.049 -0.277 1 sample -0.055 -0.207 -0.243 -0.208 0.785*** -0.344 -0.386** 0.174 0.376** 0.253 -0.092 -0.098 -0.055 -0.288 -0.311 1 Year 0.199 0.083 -0.094 -0.122 -0.040 0.207 -0.327 -0.299 0.484*** 0.303 -0.119 0.305 -0.22 0.281 0.178 0.117 1 Notes: *** and ** denote significance at the 1 per cent and 5 per cent levels, respectively.
  • 16.
    2.5 Meta regressionmodel We estimated a MRA model based on the guidelines suggested by Stanley and Jarrell (1989) and the application by Colegrave and Giles (2008) to finding optimal school size. The MRA model is expressed in equation 3. 14 ௠ OIS௜ൌ α൅ ෍ ߙ௠ ௠ୀଵ ܼ௜௠ ൅ ߝ௜ for i =1, 2,...,n (3) OIS denotes the dependent variable optimal institutional size for the ith study in n studies. However n refers to the 30 estimations produced since some of the 12 studies computed more than one OIS estimate. Z୧୩ represents the meta-independent variables described earlier in table 1 The constant term, α denotes the mean OIS predicted by the MRA model if all other predictor variables Z୧୩ are zero. Hence this is used in this study as the base estimate or predicted “standard” OIS (Colegrave and Giles 2008). α୫ denotes the mean deviation from the constant term and standard OIS, α. ε୧ is a random error term. We are concerned about heteroscedasticity especially since the estimates are based on different sample sizes. To ensure that our MRA estimates are BLUE, we carry out tests for heteroscedasticity (Breusch-Pagan test) and multicollinearity (Variance Inflation Factor-VIF), and if necessary use robust standard errors to counter heteroscedasticity. We also check for omitted variable bias and misspecification using the Ramsey RESET test. 3. Results Table 5 presents the results of our MRA model (equation 3, n=30). OIS represents our dependent variable and parameter of interest for the study. From the original 15 meta-independent variables, we only include 13 variables, excluding sample size and year of data.
  • 17.
    This is becausethese two variables substantially contribute to heteroscedasticity in the model5. After excluding these variables, we estimated our model using OLS. 15 Table 5 MRA results (n=30) Dependent Variable-OIS Model 1 (OLS) Model 2 (Robust SE) Coefficient t t Constant 24,954.45 3.07*** 4.36*** Institutional Type Public 7,615.22 0.72 0.81 College -14,657.84 -3.16*** -5.02*** Mixed -10,809.22 -1.87* -3.50*** Mixed2 13,337.35 2.17** 2.46*** Referent-Private Other independent variables InputQ -428.33 -0.10 -0.18 OutputQ -3,823.91 -0.61 -0.77 MP 4,403.65 1.19 1.17 Form 6,071.67 1.43 2.18** Totalcost -6,803.55 -0.88 -1.15 HC -8,987.01 -1.34 -1.60 Pub -2.706.69 -0.75 -1.03 non-US -8,959.18 -1.56 -1.87* Subgroup -5,721.37 -1.73 -2.62** R2=0.65 R2=0.80 F 13,16=5.10*** F 13,16=8.53*** BP=3.10* Ramsey RESET=1.67 (F 3,13 P=0.222) Notes: ***, ** and * denote significance at the 1 per cent, 5 per cent and 10 per cent levels, respectively. BP is Breusch-Pagan test. The model is significant at 1 per cent level and has an adjusted R2 of 0.65. Our specification tests show that the variance inflation factor of independent variables is below 10 (rule of thumb) suggesting reason not to be concerned about multicollinearity (see Appendix C). The Ramsey RESET test indicates that the model neither has omitted variable bias nor is it mis-specified (p=0.222). However the Breusch-Pagan Test is still significant at 10 per cent level, suggesting we should still be concerned about heteroscedasticity in the model. In order to 5 With these variables in the model, the Breusch-Pagan test is 3.68 (p=0.055)
  • 18.
    counter this, asecond estimation of the model was done with robust standard errors (model 2). Since the coefficients of the meta-independent variables do not change, we report only the t-values from the second estimation with robust standard errors. The model with robust standard errors has an R2 of 0.80. Our interpretation of results is based on the second model. The results show that the intercept (our standard model estimate of OIS) is 24,954 full time equivalent student enrolment (p<0.01). This is the base model when all the meta-independent variables are all equal to zero. The reference category for institutional type is the private university variable, which corresponds to the standard model estimate of 24,954 students. The public university variable is not significant, an indication that estimates based on public universities samples, on average are not significantly different from the intercept (which is also our reference variable private university). Several meta-independent variables significantly affect our OIS estimate. Studies which based their estimates on small colleges on average reduce the standard model estimate by 14,657 students (p<0.01) while studies which based their estimates on mixed samples of HEIs, on average reduce the standard model estimate by 10,809 students. Studies which based their estimates on mixed samples of public and private universities increase the standard model estimate by 13, 337 students (p<0.01). Other significant variables concern the type of data and sample used and the functional form of model used. Studies based on subgroups, on average reduce the standard model estimate by 5,721 students, while studies based on non-US data6, on average reduce the standard model estimate by 8,959 students. Studies that used quadratic cost functions, on average increase the standard model estimate by 6,071 students. Omitting input quality, price variables or output quality variables in a study does not significantly affect our standard 16 6 Non-US data is based on four estimates from three studies from Australia, Turkey and Taiwan.
  • 19.
    model estimate; neitherdoes publishing in peer reviewed outlets nor testing for heteroscedasticity. Studies that used multi-product cost functions (vs. single product) or studies that used total costs as their dependent variable (vs. variable costs) also do not significantly change our standard model estimate. 17 4. Discussion 4.1 Policy implications The standard estimate of OIS and how meta-independent variables affect it have possible implications on strategies for HEI mergers. For interpretation, we add the coefficients of significant institutional type variables to the standard model estimate to get the predicted OIS for each type of institution. In our analysis, public universities are predicted to have an OIS which is the same as the standard model estimate of 24,954 students. Average institutional size for public university samples in the reviewed literature is about 8,608 students. This probably indicates or justifies an argument for mergers. Hence, public universities of average sample size can increase student enrolment by about 190 per cent as they experience declining average costs until they reach 24,954 students, the optimal point. Our analysis predicts the OIS for private universities to be equivalent to the standard model OIS of 24,954 students. The average size for private universities in our sample is 10,784 students. Hence, there is room or justification for increasing private university size by 131 per cent of the sample mean to reach the optimal point. However, there are caveats to these findings. Since the average institutional size and predicted OIS are based on two non-US studies (Australia and Taiwan), where public universities could be smaller than US public universities), the implied expansion path is
  • 20.
    likely more applicableto non-US countries than the US. Moreover, in the US, the cost-size relationship of public universities is influenced or obscured by the financing structure, where funding is dependent on enrolments (Laband and Lentz 2004, Getz and Siegfried 1991). The small sample of public university estimates also warrants caution in our interpretation. In addition, private university estimates in our sample are all based on US studies and might be less applicable to non-US contexts where private universities could be much smaller in size and may be less common. A cursory comparative analysis of our predicted optimum with actual sizes of top three universities based on Times Higher Education World University Rankings7 from each region shows varying opportunities for expansion (see appendix D). The top three universities in North America are all private universities with sizes in the range of 2,012 to 21,000 total students, indicating room for expansion in the range of 19 per cent to 1140 per cent. The top public university in North America is larger than the predicted optimum, and hence would need to contract by 31 per cent. In Europe the top three universities are all public with sizes ranging from 13,964 to 21,872 students, indicating expansions in the range of 14 per cent - 79 per cent. In Asia, the top three universities are public institutions, with sizes ranging from 22, 260 to 37, 304 students. However, based on our optimum, only one university has room for expansion (12 per cent) while the other two would face contraction in the range of 14 per cent and 33 per cent respectively. In Oceania, the top three universities are all Australian and publicly controlled with sizes ranging from 16,719 to 49,020 students. This would indicate room for expansion for one university by around 49 per cent, while the other two universities would need to contract by about 32 per cent and 49 per cent respectively. In South America, two of the top institutions are public universities and the third ranked institution is a private 18 7 http://www.timeshighereducation.co.uk/world-university-rankings/
  • 21.
    university. They havesizes in the range of 22,848 (private) to 88,962 students. Comparing with our optimum, the two public universities would need to contract by 44 per cent and 72 per cent respectively, while the private university can expand by 9 per cent. In Africa, the top three universities are public institutions with sizes ranging from 25,532 to 28,442 students. This would indicate that these institutions are slightly larger than our predicted optimum and would face contraction in the range of 2 per cent-12 per cent. The variable “colleges” is predicted to have a lower OIS than the standard estimate, about 10,296 students. Considering that average “college” size in the reviewed literature is about 979 students, this finding suggests room for average size colleges to expand by around 952 per cent. This variable is based on studies that used samples of community colleges, liberal arts colleges and vocational schools. Predicted OIS for non-US HEIs is about 15,995 students. Average non-US HEI size in the reviewed literature is 7,338 students. This would suggest expansion in size of non-US HEIs by about 118 per cent of the sample mean. However only four studies looked at non-US institutions suggesting a heavy bias in the literature towards US institutions. This bias maybe due to the ease of data availability or data reliability of HEI costs in the US. Hence caution is warranted in interpreting non-US data. While omitting input quality and output quality variables does not seem to influence study’s OIS estimate, what this study cannot dismiss is the potential effect of the input price on potential mergers. Our study faces shortcomings, one of them being that our sample size for the MRA is quite small. Previous studies have indicated that student-faculty ratio and the complexity of curriculum accounted for greater variation in institutional costs than enrolment size (Brinkman and Leslie 1986; McLaughlin et al. 1980). Hence, expanding institutional 19
  • 22.
    size, as mergersdo, could also increase costs especially from higher faculty salaries or increased curricula potentially negating any economies of scale (Brinkman and Leslie 1986). Our analytical findings seem to suggest a justification for the potential expansion or merging of HEIs. Yet, there are several reasons to be cautious. First, institutional characteristics and location of HEIs appear to influence the cost –size relationship. Second, our preliminary comparisons with actual sizes of top ranked institutions show a varied picture on expansion or contraction. Third, there are shortcomings of our data, in particular the limited sample. Hence, we recommend policymakers in US or non-US locations to refer to their own cost structures to determine the optimal size for efficiency (Colegrave and Giles 2008). 20 4.2 Research implications Our findings also have implications on current and future research in this area. Our analysis produced several important insights on how empirical methodology influences OIS estimates. The type of functional form used in cost functions seems to matter. For instance, estimates based on quadratic cost functions increase the standard model OIS by about 6,071 students. The use of quadratic or cubic cost functions in estimating economies of scale for HEIs became the norm starting in the mid-1980s in articles by Throsby (1986) and Cohn et al. (1989), unlike earlier studies where linear functional forms where commonplace. Hence, one may argue that functional form acts as an indirect indicator of a time trend in the methodology and may influence estimates.
  • 23.
    However as expectedand earlier illustrated, our limited sample size is a major shortcoming. This makes it difficult for us to draw firm conclusions on our findings. Furthermore, our sample distribution is skewed towards smaller colleges (10 estimates) or estimates from mixed HEIs (9 estimates), for a total of 19 out of 30 estimates. Thus, studies determining the cost-size relationship of small colleges or estimating economies of scale based on mixed samples of universities and colleges (which have different sizes and costs) currently dominate the literature. While, our efforts in searching for the relevant studies were rigorous, there is a small possibility that we missed unpublished articles which might have increased our sample size. In addition, we identified many other studies that estimated economies of scale but did not specifically reveal the optimal institutional size in their estimates. We hope that this MRA will encourage future researchers to produce OIS estimates when estimating cost functions. 21 5. Conclusion This paper used the meta-regression analysis method to determine a standard OIS in higher education. Our findings indicate a standard OIS of 24,954 students. The meta-regression analysis shows that the predicted standard OIS is negatively influenced by; studies based on small college samples and samples of mixed HEIs, the use of subsamples, studies based on non-US data. The standard OIS is positively influenced by studies based on samples of mixed public and private universities and the use of quadratic or cubic cost functions. The OIS for public universities is not significantly different from the standard OIS estimate (also private university estimate). We find a potential for HEIs to expand their size by different magnitudes; public universities by about 190 per cent of the sample mean size, private universities by 131 per cent of the sample mean size, small colleges by around 952 per cent of the sample mean size, and non-US HEIs by about 118 per cent of the sample mean. However, if we compare optimum sizes with actual sizes of top ranked universities in the
  • 24.
    Times Higher EducationWorld University Rankings a more mixed impression emerges: in some parts of the world top ranked universities seem to be below optimal size, while in others they appear above optimal size. However, we urge caution in the interpretation of the findings due to the still limited sample of studies producing optimal institutional size estimates and the dominance of optimal institutional size estimates of small colleges in the literature. We therefore recommend further research in this area. We also recommend policymakers in US or non-US locations to refer to their own cost structures to determine the optimal size for efficiency. 22 Acknowledgements We are grateful to Sabrina Wollmann for her assistance during the search for literature.
  • 25.
    23 References Brinkman,P. T. (1981). Marginal costs of instruction in public higher education. Ph.D. dissertation, University of Arizona. Brinkman, P. T. & Leslie, L. L. (1986). Economies of scale in higher education: sixty years of Research, Review of Higher Education, 10, 1- 28. Cohn, E., Rhine, S. L. W. & Santos, M. C. (1989) Institutions of higher education as multiproduct firms: economies of scale and scope, Review of Economics and Statistics, 71, 284-290. Colegrave, A. D., & Giles, M. J. (2008). School Cost Functions: A Meta-Regression Analysis. Economics of Education Review, 27(6), 688–696. de Groot, H., McMahon, W. W. & Volkwein, J. F. (1991) The cost structure of American research universities, Review of Economics and Statistics, 73, 424-431. Dougherty, C. (1990). Unit costs and economies of scale in vocational and technical education: evidence from the People’s Republic of China. Economics of Education Review, 9(4), 389-394 Dundar, H. & Lewis, D. R. (1995). Departmental productivity in American universities: economies of scale and scope, Economics of Education Review, 14, 199-244. Fu, T.T., Huang, C. J. & Tien, F. F. (2008). University Cost Structure in Taiwan. Contemporary Economic Policy, 26,651–662. Getz, M. & J.J. Siegfried. 1991. Costs and Enrollment. In C. T. Clotfelter, R.G. Ehrenberg, R. Getz and J. J. Siegfried (Ed.), Economic Challenges in Higher Education (p. 332 - 356). Chicago: University of Chicago Press. Getz, M., Siegfried, J. J., & Zhang, H. (1991). Estimating economies of scale in higher education. Economic Letters, 37, 203–208. Goudriaan, R., and de Groot, H. (1993). State regulation and university behaviour. Journal of Economic Behavior and Organization 20,309-318.
  • 26.
    Hashimoto, K. &Cohn, E. (1997). Economies of scale and scope in Japanese private universities. Education Economics, 5,107-116. Heaton, C. & Throsby, D. (1997). Cost Functions for Australian Universities: A Survey of Results with Implications for Policy. Paper 2, Discussion Paper 360. Canberra: Centre for Economic Policy Research, ANU, 11–20. Koshal, R. K. & Koshal M. (1995). Quality and economies of scale in higher education, Applied Economics, 22, 3- 8. Koshal, R. K. & Koshal M .(2000). “Do Liberal Arts Colleges Exhibit Economies of Scale and Scope?”, Education Economics, 8 (3), 209-220. Koshal, R. K., Koshal, M. & Gupta, A. (2001). Multi-Product Total Cost Function for Higher Education: A Case of Bible Colleges. Economics of Education Review, 20, 297-303. Lenton, P. (2008). The cost structure of higher education in further education colleges in England. Eonomomics of Education Review, 27, 471–482. Lewis, D., & H. Dundar. (1995). Economies of Scale and Scope in Turkish Universities. Educational Economics, 3, 133–158. Lloyd, P. J., Morgan, M. H. & Williams, R. A. (1993). Amalgamation of universities: are there economies of scale or scope? Applied Economics, 25, 1081-1092. Longlong, H., Fengliang, L. & Weifang, M. (2009). Multi-product total cost functions for higher education: The case of Chinese research universities. Economics of Education Review, 28(4), 505-511. Lyell, E. H. The Cost Structure of Higher Education: Implications for Governmental Policy in Steady State. Paper presented at the Annual Meeting of the American Educational Research Association, San Francisco, April, 1979. Maynard, J. (1971). Some microeconomics of higher education. Lincoln, University of Nebraska Press. 24
  • 27.
    Sav, G. T.(2011). Panel Data Estimates of Public Higher Education Scale and Scope Economies. Atlantic Economic Journal 39 (2), 143–153. Stanley, T.D., & Jarrell, S.B. (1989). Meta-regression Analysis; A Quantitative method of Literature Surveys. Journal of Economic Surveys, 3(2), 161–170. Stanley, T.D. (2001). Wheat from Chaff: Meta Analysis as a Quantitative Literature Review. Journal of Economic Perspectives, 15(3), 131–150. 25 Throsby, C.D. (1986). Cost Functions for Australian Universities, Australian Economic Papers 25, 175–192. Varadi, B. (2001). Multiproduct Cost Function Estimation for American Higher Education: Economies of Scale and Scope. Discussion Papers MT–DP. 2001/11, Institute of Economics, Hungarian Academy of Sciences Worthington, A.C, & Higgs, H. (2011): Economies of scale and scope in Australian higher education. Higher Education, 61, 387-414.
  • 28.
    26 Appendix A Studies included in the MRA Author Country Pub Yr OIS Public Private College Mixed Mixed2 Brinkman USA 1981 1750 0 0 1 0 0 Brinkman USA 1981 3500 0 0 1 0 0 Cohn et al USA 1989 5120 0 0 0 1 0 Cohn et al USA 1989 4842 0 0 0 1 0 Cohn et al USA 1989 2110 0 0 0 1 0 DeGroot et al USA 1991 45000 0 0 0 0 1 DeGroot et al USA 1991 17000 0 1 0 0 0 Lewis & Dundar Turkey 1995 1600 0 0 1 0 0 Fu et al Taiwan 2008 10481 1 0 0 0 0 Fu et al Taiwan 2008 18141 0 0 0 0 1 Getz and Siegfried USA 1991 1100 0 0 1 0 0 Getz and Siegfried USA 1991 1600 0 0 1 0 0 Getz and Siegfried USA 1991 20227 0 1 0 0 0 Getz and Siegfried USA 1991 2150 0 0 1 0 0 Getz and Siegfried USA 1991 18934 0 1 0 0 0 Getz et al USA 1991 1115 0 0 1 0 0 Getz et al USA 1991 2153 0 0 1 0 0 Getz et al USA 1991 1584 0 0 1 0 0 Koshal and Koshal USA 1995 30957 0 0 0 0 1 Koshal and Koshal USA 1995 11758 0 0 0 0 1 Koshal and Koshal USA 1995 16112 0 0 0 0 1 Koshal and Koshal USA 1995 22174 0 0 0 0 1 Koshal and Koshal USA 2000 2472 0 0 1 0 0 Laband and Lentz USA 2004 19800 0 0 0 1 0 Laband and Lentz USA 2004 19800 0 0 0 1 0 Maynard USA 1971 5300 0 0 0 1 0 Throsby Aus 1986 13000 1 0 0 0 0 Varadi USA 2001 9800 0 0 0 1 0 Varadi USA 2001 16000 0 0 0 1 0 Varadi USA 2001 7720 0 0 0 1 0
  • 29.
    27 Appendix B Average Institutional Size, n=22 Mean Std. Dev. Full sample 8,013.23 5,840.35 Public (n=3) 8,608.5 1,501.19 Private (n=3) 10,784 807.14 College (n=3) 979.39 355.80 Mixed (n=8) 4,343.1 2,217.44 Mixed2 (n=5) 14,839.83 4,868.98
  • 30.
    28 Appendix C Test for Multicollinearity Variable VIF 1/VIF HC 7.39 0.135 OutputQ 7.21 0.139 Mixed 5.51 0.182 Public 5.39 0.185 Totalcost 5.19 0.193 Mixed2 4.71 0.212 College 3.74 0.268 InputQ 3.47 0.288 Non-US 2.99 0.335 Form 2.52 0.397 MP 2.5 0.400 Pub 2.34 0.428 Subgroup 1.91 0.524 Mean VIF 4.22 Notes: VIF denotes variance inflation factor
  • 31.
    29 Appendix D Actual Sizes of Top-Ranked Universities from World Regions Institution Size Public Private Country Expansion (Contraction) North America California Institute of Technology 2,231 √ USA 1119% Harvard University 21,000 √ USA 119% Stanford University 19,945 √ USA 125% University of California Berkeley 36,142 √ USA (31%) Europe University of Oxford 21,872 √ UK 114% University of Cambridge 18,306 √ UK 136% Imperial College of London 13,964 √ UK 179% Oceania University of Melbourne 36,626 √ Australia (32%) Australia National University 16,719 √ Australia 149% University of Sydney 49,020 √ Australia (49%) Asia University of Tokyo 28,978 √ Japan (14%) University of Hong Kong 22,260 √ Hong Kong 112% National University of Singapore 37,304 √ Singapore (33%) South America University of Sao Paulo 88,962 √ Brazil (72%) State University of Campinas 44,519 √ Brazil (44%) Pontifical Catholic University of Chile 22,848 √ Chile 109% Africa University of Cape Town 25,352 √ South Africa (2%) Stellenbosch University 28,193 √ South Africa (11%) University of Witwatersrand 28,442 √ South Africa (12%) Notes: Rankings based on Times Higher Education World University Rankings. Actual institutional sizes are from each university’s website. Magnitude of expansion or contraction is relative to the optimum of 24,954 students. Expansion is by multiplication and contraction by subtraction.
  • 32.
    The UNU‐MERIT WORKINGPaper Series 2014-01 The medium‐term effect of R&D on firm growth by Marco Capasso, Tania Treibich and Bart Verspagen 2014-02 Diverse and uneven pathways towards transition to low carbon development: The case of diffusion of solar PV technology in ChinaMichiko Iizuka 2014-03 User innovators and their influence on innovation activities of firms in Finland by JariKuusisto, MerviNiemi and Fred Gault 2014-04 Migration, remittances and household welfare in Ethiopia by Lisa Andersson 2014-05 Path‐breaking directions of nanotechnology‐based chemotherapy and molecular cancer therapy by Mario Coccia and Lili Wang 2014-06 Poor trends ‐ The pace of poverty reduction after the Millennium Development AgendaRichard Bluhm, Denis de Crombrugghe, Adam Szirmai 2014-07 Firms' adoption of international standards: Evidence from the Ethiopian floriculture sector by MuluGebreeyesu 2014-08 School choice, segregation, and forced school closureby Cheng Boon Ong andKristof De Witte 2014-09 Gender difference in support for democracy in Sub‐Saharan Africa: Do social institutions matter?by MatyKonte 2014-10 Why are women less democratic than men? Evidence from Sub‐Saharan African countries by Cecilia García‐Peñalosa and MatyKonte 2014-11 Tipping points? Ethnic composition change in Dutch big city neighbourhoods by Cheng Boon Ong 2014-12 Technology life cycle and specialization patterns of latecomer countries. The case of the semiconductor industry by Giorgio Triulzi 2014-13 Patents as quality signals? The implications for financing constraints on R&D by Dirk Czarnitzki, Bronwyn H. Hall and Hanna Hottenrott 2014-14 Assessment of effectiveness of Chinese aid in competence building and financing development in Sudan by SamiaSatti Osman Mohamed Nour 2014-15 Education, training and skill development policies in Arab Gulf countries: Macro‐micro overview by SamiaSatti Osman Mohamed Nour 2014-16 Structure of labour market and unemployment in Sudan by SamiaSatti Osman Mohamed Nour 2014-17 Overview of knowledge transfer in MENA countries ‐ The case of Egypt by SamiaSatti Osman Mohamed Nour 2014-18 The impact of ICT in public and private universities in Sudanby SamiaSatti Osman Mohamed Nour 2014-19 End‐user collaboration for process innovation in services: The role of internal resources by Mona Ashok, Rajneesh Narula and Andrea Martinez‐Noya 2014-20 Public investment and regional politics: The case of Turkey by Mehmet Guney Celbis, Denis de Crombrugghe and Joan Muysken 2014-21 Infrastructure and the international export performance of Turkish regions by Mehmet Guney Celbis, Peter Nijkamp and Jacques Poot 2014-22 Discovering and explaining work‐family strategies of parents in Luxembourg by Nevena Zhelyazkova 2014-23 Parental leave take up and return to work of mothers in Luxembourg: An application of the model of nested dichotomies by Nevena Zhelyazkova
  • 33.
    2014-24 Millennium DevelopmentGoals: Tool or token of global social governance? by Mueid Al Raee, Elvis Amoateng, Elvis Korku Avenyo, Youssef Beshay, Mira Bierbaum, Charlotte Keijser and Rashmi Sinha 2014-25 One Europe or several? Causes and consequences of the European stagnation by Jan Fagerberg and Bart Verspagen 2014-26 The harmony of programs package: Quasi‐experimental evidence on deworming and canteen interventions in rural Senegal by Théophile Azomahou, Fatoumata Diallo and Wladimir Raymond 2014-27 Country Terms of Trade 1960‐2012: Trends, unit roots, over‐differencing, endogeneity, time dummies, and heterogeneity by Thomas Ziesemer 2014-28 The structure and comparative advantages of China's scientific research ‐ Quantitative and qualitative perspectives by Lili Wang 2014-29 Transition to knowledge‐based economy in Saudi Arabia by Samia Satti Osman Mohamed Nour 2014-30 Challenges and opportunities for transition to knowledge‐based economy in Arab Gulf countries by Samia Satti Osman Mohamed Nour 2014-31 Migration of international students and mobilizing skills in the MENA Region by Samia Satti Osman Mohamed Nour 2014-32 Beyond product innovation; improving innovation policy support for SMEs in traditional industries by René Wintjes, David Douglas, Jon Fairburn, Hugo Hollanders and Geoffrey Pugh 2014-33 The impact of innovation support programmes on SME innovation in traditional manufacturing industries: an evaluation for seven EU regions by Dragana Radicic, Geoffrey Pugh, Hugo Hollanders and René Wintjes 2014-34 Beliefs dynamics in communication networks by Théophile T. Azomahou and Daniel C. Opolot 2014-35 Stability and strategic diffusion in networks by Théophile T. Azomahou and Daniel C. Opolot 2014-36 Epsilon‐stability and the speed of learning in network games by Théophile T. Azomahou and Daniel C. Opolot 2014-37 Afghan unaccompanied minors in the Netherlands: Far away from home and protected? by Carla Buil and Melissa Siegel 2014-38 Multinational production and trade in an endogenous growth model with heterogeneous firms by Hibret B. Maemir and Thomas Ziesemer 2014-39 The political economy of research and innovation in organic photovoltaics (OPV) in different world regions by Serdar Türkeli and René Kemp 2014-40 Towards the societal system of innovation: The case of metropolitan areas in Europe by Serdar Türkeli and René Wintjes 2014-41 To return permanently or to return temporarily? Explaining migrants' intentions by Özge Bilgili and Melissa Siegel 2014-42 Catching up and lagging behind in a balance‐of‐payments‐constrained dual economy by Alejandro Lavopa 2014-43 An introduction to the economics of rare earths by Eva Bartekova 2014-44 The unequal effect of India's industrial liberalization on firms' decision to innovate: Do business conditions matter? By Maria Bas and Caroline Paunov 2014-45 Insurgents in motion: Counterinsurgency and insurgency relocation in Iraq by Pui‐hang Wong
  • 34.
    2014-46 Successive leadershipchanges in the regional jet industry by Daniel Vertesy 2014-47 Demand, credit and macroeconomic dynamics: A microsimulation model by Huub Meijers, Önder Nomaler and Bart Verspagen 2014-48 Accessibility analysis as an urban planning tool: Gas station location by D.A. Escobar , C. Cadena‐Gaitán, F.J. Garcia 2014-49 China's economic embrace of Africa ‐ An international comparative perspective by Tobias Broich and Adam Szirmai 2014-50 Mapping regional social enterprise ecosystems in India: Framework and indicators by Lina Sonne 2014-51 Does shelter assistance reduce poverty in Afghanistan? By Craig Loschmann, Christopher R. Parsons and Melissa Siegel 2014-52 How important is innovation? A Bayesian factor‐augmented productivity model on panel data by Georges Bresson, Jean‐Michel Etienne and Pierre Mohnen 2014-53 Does too much work hamper innovation? Evidence for diminishing returns of work hours for patent grants by Mehmet Güney Celbi¸ Serdar Türkeli 2014-54 Globalization, the rise of biotechnology and catching up in agricultural innovation: The case of Bt technology in India Michiko Iizuka and Ajay Thutupalli 2014-55 Where are innovation indicators, and their applications, going? by Fred Gault 2014-56 Productivity in services in Latin America and the Caribbean by Elena Arias‐Ortiz, Gustavo Crespi, Alejandro Rasteletti and Fernando Vargas 2014-57 Optimal public investment, growth, and consumption: Fresh evidence from African countries by Augustin Kwasi Fosu, Yoseph Yilma Getachew and Thomas H.W. Ziesemer 2014-58 International R&D alliances by firms: Origins and development by Rajneesh Narula and Andrea Martínez‐Noya 2014-59 Appropriability mechanisms, innovation and productivity: Evidence from the UK by Bronwyn H. Hall and Vania Sena 2014-60 The size of patent categories: USPTO 1976‐2006 by François Lafond 2014-61 Asset recombination in international partnerships as a source of improved innovation capabilities in China by Simon C. Collinson and Rajneesh Narula 2014-62 The viability of sustained growth by India's MNEs: India's dual economy and constraints from location assets by Rajneesh Narula 2014-63 The effect of unconditional cash transfers on adult labour supply: A unitary discrete choice model for the case of Ecuador by Andrés Mideros and Cathal O'Donoghue 2014-64 Giving in South Africa: Determining the influence of altruism, inequality aversion and social capital by Nyasha Tirivayi 2014-65 The impact of food transfers for people living with HIV/AIDS: Evidence from Zambia by Nyasha Tirivayi and Wim Groot 2014-66 Size and economies of scale in higher education and the implications for mergers by Nyasha Tirivayi, Henriette Maasen van den Brink and Wim Groot