This document discusses differences in how Asian and American students learn place value concepts in first grade. It summarizes research showing that Asian students develop place value understanding earlier due to cultural practices like using a base-10 number naming system and visualizing quantities rather than counting. The study tested implementing these Asian approaches in an experimental American classroom, including using an abacus, place value cards, and focusing on visualization over counting. Students in the experimental class performed significantly better on place value tasks compared to a control class taught traditionally.
This document provides an overview of the fourth grade mathematics curriculum for Unit 2 on data analysis at the Isaac School District. The unit focuses on collecting, organizing, displaying, and interpreting data through various graphs and charts. It includes 13 sessions covering key concepts like different types of graphs, measures of center, and drawing conclusions from data. Standards and practices from operations/algebraic thinking and number/operations in base ten are also addressed, with an emphasis on multi-digit arithmetic using the standard algorithm. Explanations and examples are provided for core ideas around data displays and multi-step word problems.
The document provides an overview of Unit 6 of the third grade mathematics curriculum for the Isaac School District. The unit focuses on patterns, functions, and change through stories, tables, and graphs over 16 sessions. It covers key ideas such as recognizing and extending patterns, variables representing numbers, and functions showing relationships. The unit vocabulary and Arizona math standards are outlined. Explanations and examples are provided for core concepts like properties of multiplication and division, and fluently multiplying and dividing within 100.
Proton Training Solution (PTS) is a trusted Training Institute in Pune for MBA Entrance Exams (CAT | IIFT | XAT | SNAP | NMAT | CMAT | TISS | MH CET | MAT | ATMA and many others), BBA Entrance Exams (IPM-AT | DUJAT | SET | NPAT | BMCC | MIT and many others). Proton is also associated with many institutes as knowledge partner & provides Aptitude Training for Placement Preparation.
To determine the probability of two independent events occurring:
1. Find the probability of each individual event. For example, if spinning a spinner with four equal sections and rolling a six-sided die, the probability of each event would be 1/4 and 1/6 respectively.
2. Multiply the probabilities of the individual events. Since independent events do not influence each other, we can treat them as separate occurrences.
3. The product of the individual probabilities is the probability the two independent events will both occur. Continuing the spinner and die example, the probability of a specific outcome on the spinner AND a specific outcome on the die is (1/4) × (1/6) = 1/
This document discusses permutations and combinations. Permutations refer to arrangements where order matters, while combinations refer to arrangements where order does not matter. Formulas for calculating permutations and combinations are provided. Several examples are worked through to demonstrate calculating permutations and combinations for different scenarios such as choosing passwords, selecting movies, and arranging binders on a shelf.
The document summarizes Joan Cotter's presentation on updating Montessori fractions. It discusses fraction charts, models for representing fractions like fish tanks and pies, games for learning fractions, and arithmetic with fractions like simplifying, adding, subtracting, and multiplying fractions. Various teaching strategies and manipulatives are presented.
The document summarizes Joan Cotter's presentation on updating Montessori fractions. It discusses fraction charts, models for representing fractions like fish tanks and pies, games for learning fractions, and arithmetic operations like simplifying, adding, subtracting, and multiplying fractions. Various teaching strategies and manipulatives are presented.
This document introduces special products and factors of polynomials. It discusses how patterns can be used to simplify algebraic expressions and solve geometric problems. Students will learn to identify special products through pattern recognition, find special products of polynomials, and apply these concepts to real-world problems. The goals are to demonstrate understanding of key concepts and solve practice problems accurately using different strategies.
This document is the preface to "The History of Mathematics: A Brief Course Answers to Questions and Problems" by Roger Cooke. It explains that the solutions manual is intended for instructors and not students directly, and contains the author's personal views in response to questions from the textbook. The preface notes that references and citations from the textbook are included for context but the literature list is not. It aims to promote discussion and critical thinking rather than provide definitive answers.
Probability and statistics as helpers in real lifeTarun Gehlot
1) Probability and statistics are important topics that help us understand chance and make predictions about the world. They are used across many fields from science to economics.
2) Teachers can use hands-on activities to help students understand concepts like probability, mean, median, and mode. Examples include coin tosses, drawing cards, and analyzing data sets.
3) Statistics and data analysis are especially challenging for English language learners. Teachers should provide opportunities for students to practice key concepts in their native language when possible.
The document provides a mathematics curriculum guide for third grade students in the Isaac School District. It focuses on unit 8 which covers addition, subtraction, and number systems over 3 sessions. The unit teaches students that numbers can be represented in many ways and used to solve problems. Students will learn about relationships between numbers, place value, and comparing and ordering whole numbers. They will solve 2-step word problems using the four operations and identify arithmetic patterns. Students will also learn to fluently add and subtract within 1000 using strategies based on place value.
This module introduces key concepts in statistics. It will cover defining statistics and related terms, the history and importance of statistics, summation rules, sampling techniques, organizing data in tables, constructing frequency distributions, and measures of central tendency for ungrouped data. The goal is for students to understand how statistics is used in daily life and to learn techniques for collecting, organizing, and analyzing data.
Presentation Math Workshop#May 25th New Help our teachers understa...guest80c0981
This is presented by a Math teacher,in Army Burn Hall College For Girls ,Abbottabad.
The target group was the teachers of school section. There were certain activities also performed an demonstrated in order to introduce new teaching methodologies and to prepare our teachers to meet the need of the day.
Umber
The document discusses collecting and analyzing data through surveys. It defines key terms like variables, category data, and discrete data. Category data is described in words, while discrete data uses numbers. Data can be organized and presented in tables, tally charts, frequency tables, dot plots, and bar graphs. Bar graphs can show and compare data, with either a horizontal or vertical orientation. The document provides examples of each term and type of data presentation. It concludes with a summary of the key points and practice questions.
1. This module discusses permutations and their applications. It provides opportunities to identify situations involving permutations and differentiate them from other situations. Students are given problems to solve on permutations.
2. The module recalls the fundamental counting principle for combining multiple choices. It provides examples of using multiplication to calculate the number of combinations when choosing objects with replacement and without replacement.
3. The document defines permutations as arrangements or orderings of objects. It provides examples of calculating permutations using factorial notation, including distinguishing permutations where some objects are identical.
1. The document provides information about permutations including definitions, formulas, and examples of calculating the number of permutations of different arrangements.
2. Permutations refer to the number of ways objects can be ordered or arranged, taking into account the order of the arrangement.
3. Common permutation formulas provided include P(n, n) = n! for permutations of n objects taken n at a time and P(n, r) = n!/(n-r)! for permutations of n objects taken r at a time.
Probability distribution of a random variable moduleMelody01082019
This document provides an overview of a module on statistics and probability for senior high school students. It covers basic concepts of random variables and probability distributions through two lessons. The first lesson defines random variables and distinguishes between discrete and continuous variables. The second lesson defines discrete probability distributions and shows how to construct a histogram for a probability mass function. Examples are provided to illustrate key concepts. Learning competencies focus on understanding and applying random variables and probability distributions to real-world problems.
- Students will solve problems involving handshakes between groups of people in various ways including using tables, diagrams, lists, or formulas.
- A table shows that with 9 people there are 36 handshakes, following the pattern of adding the number of previous people to get the next number of handshakes.
- Through exploration and questioning, students derive the formula for number of handshakes which is 1/2 * n * (n-1), where n is the number of people. This relationship is quadratic, not linear.
2. week 2 data presentation and organizationrenz50
Here are the answers to the questions:
A.
1. The variables in the graph are age (x-axis) and frequency (y-axis).
2. The variables are quantitative.
3. The variables are discrete.
4. No, a pie chart could not be used to display this data since it involves quantitative variables rather than categorical variables.
B.
1. A line graph would most appropriately represent the number of students enrolled at a local college for each year during the last 5 years. This involves two quantitative variables - years on the x-axis and enrollments on the y-axis.
2. A bar graph would most appropriately represent the frequency of each type of crime committed in
The document provides an overview of Unit 1 of the third grade mathematics curriculum for the Isaac School District. It focuses on representing numbers in different ways and relationships between numbers. The unit covers addition, subtraction, and place value over 16 sessions. It includes essential questions, vocabulary, Arizona state standards, and examples for how students can explore numerical patterns and operations with multiples of 10 to develop fluency.
This document provides teaching materials on permutations for a mathematics class. It includes examples, activities, and practice problems for students to illustrate and solve permutations of objects. The first activity asks students to find the number of possible passwords that can be created from rearranging four letters in Shayna's name for her 22 students. Later activities involve listing arrangements of different objects, finding factorials, and solving permutation problems. The document aims to help students understand and apply the concept of permutations through examples, guided practice, and assessments.
This document provides teaching guidelines for introducing the concepts of numbers 1-3. It includes 5 objectives, lists prerequisite concepts, recommends materials, and provides detailed instructional procedures. The procedures involve showing pictures with increasing numbers of objects, writing number symbols and words, distributing counters for activities, and worksheets to reinforce number recognition and relationships between numbers.
The document provides early math lesson plans for teaching preschoolers numbers and counting, left/right orientation, and geometry. It includes books, objectives, vocabulary, and activities for each topic. For example, one lesson teaches counting to 5 by using colored tiles and another has children grouping toy bugs into cages numbered 6-10. The reflection notes that the preschoolers needed more scaffolding than expected to use materials mathematically. Slowly introducing concepts over multiple days in different contexts helps children connect topics to play.
Presentation math workshop#may 25th newUmber Tariq
It was prepared for the staff of our school , in order to guide that how to make, teaching and leaning for Maths, interesting and fun .
To reduce boredom for kids and to relate the concepts with the nature and universe.
This document contains a daily lesson log for a 7th grade mathematics class. It outlines four sessions on the topics of irrational numbers and principal roots. The objectives are to describe principal roots, determine if they are rational or irrational, estimate square roots to the nearest hundredth, and plot irrational numbers on a number line. Examples and practice problems are provided to help students determine what two integers a square root lies between, estimate square roots, and plot them on a number line.
Here are my recommendations for graphs to use for each data set:
- Comparison of annual snowfall between resorts: Bar graph or line graph. Both would clearly show the snowfall amounts and how they compare each year.
- Time spent watching TV: Histogram. It can accommodate a large data set and show the distribution of hours watched.
- Wind speed over 3 weeks: Line graph. A line graph is best to show changes in a measurement over time.
- Favorite summer activity: Pie or bar graph. These are best for categorical data to compare proportions for each category.
- The document is from a presentation on fractions given on April 27, 2013 by Joan Cotter.
- It discusses why fractions are important to learn, such as for sharing pizza, cooking, reading rulers, and preparing for algebra.
- It includes examples of using fractions in comics and charts showing fraction relationships. Games are presented to help students understand unit fractions and that combinations of fractions can make a whole.
Learning Disabilities Mass HOPE April 2013rightstartmath
This document summarizes a presentation on teaching math to children with special needs. It discusses the characteristics of children with learning disabilities, myths about learning disabilities, problems occurring in math like dyscalculia, and effective teaching strategies like teaching for understanding versus rules and procedures. It also covers topics like memorization, flash cards, counting strategies, and visualizing mathematics concepts.
More Related Content
Similar to RightStart™ Mathematics Research Summary
This document is the preface to "The History of Mathematics: A Brief Course Answers to Questions and Problems" by Roger Cooke. It explains that the solutions manual is intended for instructors and not students directly, and contains the author's personal views in response to questions from the textbook. The preface notes that references and citations from the textbook are included for context but the literature list is not. It aims to promote discussion and critical thinking rather than provide definitive answers.
Probability and statistics as helpers in real lifeTarun Gehlot
1) Probability and statistics are important topics that help us understand chance and make predictions about the world. They are used across many fields from science to economics.
2) Teachers can use hands-on activities to help students understand concepts like probability, mean, median, and mode. Examples include coin tosses, drawing cards, and analyzing data sets.
3) Statistics and data analysis are especially challenging for English language learners. Teachers should provide opportunities for students to practice key concepts in their native language when possible.
The document provides a mathematics curriculum guide for third grade students in the Isaac School District. It focuses on unit 8 which covers addition, subtraction, and number systems over 3 sessions. The unit teaches students that numbers can be represented in many ways and used to solve problems. Students will learn about relationships between numbers, place value, and comparing and ordering whole numbers. They will solve 2-step word problems using the four operations and identify arithmetic patterns. Students will also learn to fluently add and subtract within 1000 using strategies based on place value.
This module introduces key concepts in statistics. It will cover defining statistics and related terms, the history and importance of statistics, summation rules, sampling techniques, organizing data in tables, constructing frequency distributions, and measures of central tendency for ungrouped data. The goal is for students to understand how statistics is used in daily life and to learn techniques for collecting, organizing, and analyzing data.
Presentation Math Workshop#May 25th New Help our teachers understa...guest80c0981
This is presented by a Math teacher,in Army Burn Hall College For Girls ,Abbottabad.
The target group was the teachers of school section. There were certain activities also performed an demonstrated in order to introduce new teaching methodologies and to prepare our teachers to meet the need of the day.
Umber
The document discusses collecting and analyzing data through surveys. It defines key terms like variables, category data, and discrete data. Category data is described in words, while discrete data uses numbers. Data can be organized and presented in tables, tally charts, frequency tables, dot plots, and bar graphs. Bar graphs can show and compare data, with either a horizontal or vertical orientation. The document provides examples of each term and type of data presentation. It concludes with a summary of the key points and practice questions.
1. This module discusses permutations and their applications. It provides opportunities to identify situations involving permutations and differentiate them from other situations. Students are given problems to solve on permutations.
2. The module recalls the fundamental counting principle for combining multiple choices. It provides examples of using multiplication to calculate the number of combinations when choosing objects with replacement and without replacement.
3. The document defines permutations as arrangements or orderings of objects. It provides examples of calculating permutations using factorial notation, including distinguishing permutations where some objects are identical.
1. The document provides information about permutations including definitions, formulas, and examples of calculating the number of permutations of different arrangements.
2. Permutations refer to the number of ways objects can be ordered or arranged, taking into account the order of the arrangement.
3. Common permutation formulas provided include P(n, n) = n! for permutations of n objects taken n at a time and P(n, r) = n!/(n-r)! for permutations of n objects taken r at a time.
Probability distribution of a random variable moduleMelody01082019
This document provides an overview of a module on statistics and probability for senior high school students. It covers basic concepts of random variables and probability distributions through two lessons. The first lesson defines random variables and distinguishes between discrete and continuous variables. The second lesson defines discrete probability distributions and shows how to construct a histogram for a probability mass function. Examples are provided to illustrate key concepts. Learning competencies focus on understanding and applying random variables and probability distributions to real-world problems.
- Students will solve problems involving handshakes between groups of people in various ways including using tables, diagrams, lists, or formulas.
- A table shows that with 9 people there are 36 handshakes, following the pattern of adding the number of previous people to get the next number of handshakes.
- Through exploration and questioning, students derive the formula for number of handshakes which is 1/2 * n * (n-1), where n is the number of people. This relationship is quadratic, not linear.
2. week 2 data presentation and organizationrenz50
Here are the answers to the questions:
A.
1. The variables in the graph are age (x-axis) and frequency (y-axis).
2. The variables are quantitative.
3. The variables are discrete.
4. No, a pie chart could not be used to display this data since it involves quantitative variables rather than categorical variables.
B.
1. A line graph would most appropriately represent the number of students enrolled at a local college for each year during the last 5 years. This involves two quantitative variables - years on the x-axis and enrollments on the y-axis.
2. A bar graph would most appropriately represent the frequency of each type of crime committed in
The document provides an overview of Unit 1 of the third grade mathematics curriculum for the Isaac School District. It focuses on representing numbers in different ways and relationships between numbers. The unit covers addition, subtraction, and place value over 16 sessions. It includes essential questions, vocabulary, Arizona state standards, and examples for how students can explore numerical patterns and operations with multiples of 10 to develop fluency.
This document provides teaching materials on permutations for a mathematics class. It includes examples, activities, and practice problems for students to illustrate and solve permutations of objects. The first activity asks students to find the number of possible passwords that can be created from rearranging four letters in Shayna's name for her 22 students. Later activities involve listing arrangements of different objects, finding factorials, and solving permutation problems. The document aims to help students understand and apply the concept of permutations through examples, guided practice, and assessments.
This document provides teaching guidelines for introducing the concepts of numbers 1-3. It includes 5 objectives, lists prerequisite concepts, recommends materials, and provides detailed instructional procedures. The procedures involve showing pictures with increasing numbers of objects, writing number symbols and words, distributing counters for activities, and worksheets to reinforce number recognition and relationships between numbers.
The document provides early math lesson plans for teaching preschoolers numbers and counting, left/right orientation, and geometry. It includes books, objectives, vocabulary, and activities for each topic. For example, one lesson teaches counting to 5 by using colored tiles and another has children grouping toy bugs into cages numbered 6-10. The reflection notes that the preschoolers needed more scaffolding than expected to use materials mathematically. Slowly introducing concepts over multiple days in different contexts helps children connect topics to play.
Presentation math workshop#may 25th newUmber Tariq
It was prepared for the staff of our school , in order to guide that how to make, teaching and leaning for Maths, interesting and fun .
To reduce boredom for kids and to relate the concepts with the nature and universe.
This document contains a daily lesson log for a 7th grade mathematics class. It outlines four sessions on the topics of irrational numbers and principal roots. The objectives are to describe principal roots, determine if they are rational or irrational, estimate square roots to the nearest hundredth, and plot irrational numbers on a number line. Examples and practice problems are provided to help students determine what two integers a square root lies between, estimate square roots, and plot them on a number line.
Here are my recommendations for graphs to use for each data set:
- Comparison of annual snowfall between resorts: Bar graph or line graph. Both would clearly show the snowfall amounts and how they compare each year.
- Time spent watching TV: Histogram. It can accommodate a large data set and show the distribution of hours watched.
- Wind speed over 3 weeks: Line graph. A line graph is best to show changes in a measurement over time.
- Favorite summer activity: Pie or bar graph. These are best for categorical data to compare proportions for each category.
Similar to RightStart™ Mathematics Research Summary (20)
- The document is from a presentation on fractions given on April 27, 2013 by Joan Cotter.
- It discusses why fractions are important to learn, such as for sharing pizza, cooking, reading rulers, and preparing for algebra.
- It includes examples of using fractions in comics and charts showing fraction relationships. Games are presented to help students understand unit fractions and that combinations of fractions can make a whole.
Learning Disabilities Mass HOPE April 2013rightstartmath
This document summarizes a presentation on teaching math to children with special needs. It discusses the characteristics of children with learning disabilities, myths about learning disabilities, problems occurring in math like dyscalculia, and effective teaching strategies like teaching for understanding versus rules and procedures. It also covers topics like memorization, flash cards, counting strategies, and visualizing mathematics concepts.
This document outlines Joan Cotter's presentation on teaching primary mathematics with less counting. The presentation objectives are to: review the traditional counting model; experience traditional counting as a child; introduce grouping in 5s and 10s as an alternative to counting; and meet Common Core standards without counting. The traditional counting model is described as difficult and tedious for children. Grouping in 5s and 10s is presented as a more intuitive approach that leverages children's innate ability to subitize small quantities. Research supports subitizing as important for mathematical understanding and performance.
Personalized Learning Bridges Middle School Math with a Geometric Approachrightstartmath
The document discusses a geometric approach to teaching middle school math. It notes that most middle school students are visual learners and that 90% of math topics can be explored geometrically. It then presents various drawing tools like T-squares, 30-60 triangles, and examples of how to draw geometric shapes like equilateral triangles to teach math concepts visually.
The document is a presentation on math puzzles and brain teasers by Kathleen Cotter Lawler. It covers topics such as patterns, squares, guided discovery, fractals, Asian cultures' relationship with math, math balancing, puzzle numbers, magic squares, and understanding place value. The presentation provides visual examples and explanations for each topic to illustrate different math concepts and puzzles in an engaging way.
This document discusses using card games to help students master basic math facts. It introduces two addition games called "Go to the Dump" and "Rows and Columns" that are designed to help students learn facts that total 10 and 15 respectively. The document provides explanations of the games' purposes and goals as well as examples of gameplay.
The document discusses how Joan Cotter, an engineer and educator with a PhD in math education, developed innovative ways to teach fractions. It describes several fraction models she created, including linear charts, colored bars, and missing parts charts, that make fraction comparisons and concepts easier to understand compared to traditional fraction circles or "fish tank" models. The document advocates teaching fractions using these types of linear representations rather than area models like pie charts that can be more difficult for students to interpret.
The document summarizes a presentation on developing a deeper understanding of primary math concepts through less rote counting and memorization. It discusses current counting models that rely heavily on memorization and proposes alternative approaches focusing on visualization and conceptual understanding. These include using subitizing to recognize small quantities, teaching number names in a way that reflects place value, and place value cards to build understanding of our base-ten number system. The presenters argue this will lead to longer retention and a stronger math foundation compared to traditional counting models.
This document summarizes a presentation about overcoming math obstacles through visualizing with the AL Abacus. The presentation was given by Tracy Mittleider and was based on the work of Joan A. Cotter. It discusses Dr. Cotter's background and the development of the AL Abacus, a visual and tactile manipulative that helps develop mental images of quantities, strategies, and mathematical operations. It also provides examples of how the abacus can be used to help visualize quantities and perform simple addition.
IMF: Visualizing and Montessori Math PART 2rightstartmath
The document is a presentation on how visualization enhances Montessori mathematics instruction. It discusses strategies for teaching basic multiplication facts using visual tools like the abacus, multiplication board, and charts showing multiples patterns. Strategies include showing how to break down larger multiplication problems into "tens" and "ones" places on the abacus. Charts are used to visualize repeating patterns in multiples of numbers and how they relate to specific multiplication facts.
IMF: Visualizing and Montessori Math PART 1rightstartmath
The document discusses how visualization enhances Montessori mathematics education. It provides examples of how Montessori uses concrete materials to teach counting and arithmetic concepts to children. These include number rods, bead frames, and calendar activities. The focus is on a verbal counting model that uses letters instead of numbers to demonstrate addition, subtraction, and multiplication facts to children in a visual way. Calendar math activities are also described, showing how children can develop ordinal counting and pattern recognition skills.
The document discusses a counting model for teaching mathematics to children. It describes how counting is not natural and takes years of practice, provides a poor concept of quantity, and ignores place value. The model shown uses letters instead of numbers to represent quantities in order to demonstrate counting, addition, subtraction, and other math concepts in a more concrete way for children. Montessori materials are also noted as being helpful for reinforcing counting concepts through hands-on experience.
The document discusses issues with traditional counting models and introduces an alternative counting model based on letters to represent quantities. It describes how the counting model provides a foundation for understanding place value and efficiently learning math facts. The document also cautions against using calendars for counting, noting that calendars involve ordinal rather than cardinal numbering and do not accurately represent quantities.
The document provides strategies for teaching addition and subtraction to students. Some key strategies include:
- Using visual tools like an abacus to teach strategies like "making 10" and "two 5s" for addition. Counting should be discouraged.
- Part-whole circles can help students see the relationship between addition and subtraction and solve word problems.
- Strategies for subtraction include subtracting 1 or 2 from even/odd numbers, subtracting from 10, and a "going up" strategy to find the difference between numbers.
- Games like "Go to the Dump" can make subtraction strategies engaging for students to practice facts involving 10.
This document summarizes Joan Cotter's presentation on teaching arithmetic facts using strategies and games. It discusses that counting-based and rote memorization approaches have limited success. Instead, it promotes using subitizing to identify quantities without counting, and incorporating manipulatives and mental work through enjoyable games. An example game called "Go to the Dump" is described, which aims to teach adding facts that total 10 through collecting number pairs.
This document outlines a verbal counting model proposed to help children develop a deeper understanding of numbers and math concepts rather than relying on rote memorization. The model uses letters to represent numbers and demonstrates counting, addition, subtraction, and other operations by building word problems using the letters. It also shows how this model could be applied to calendar math and comparing it to state math standards. The goal is to promote a more conceptual approach to early number sense over a procedural focus on counting and calculations.
The AL abacus provides a hands-on tool to help children understand quantities and math operations like addition and multiplication. It uses beads on wires to represent numbers up to 100. Children first learn to represent quantities 1-10 using their fingers and then on the abacus. They can then add by entering both numbers and seeing the sum without counting. Tens are entered as whole rows of beads. Multiplication can be modeled by repeatedly entering a number. The abacus also demonstrates trading or carrying for multi-digit addition and place value on its second side.
The document discusses the limitations of using verbal counting and calendars to teach early mathematics concepts. It notes that verbal counting is unnatural, provides a poor concept of quantity, ignores place value, is error-prone, tedious, and does not efficiently teach number facts. Regarding calendars, it states that calendars are not number lines as numbers appear in spaces rather than along lines, they provide an ordinal rather than cardinal view of numbers, and give a narrow view of patterning that does not generalize beyond the days in a month.
The document describes how to use drawing tools like a T-square, 30-60 triangle, 45 triangle, and pencil to divide an equilateral triangle into halves, thirds, fourths, sixths, and eighths. It shows how to draw parallel, perpendicular, and intersecting lines. The document also discusses classifying shapes like rhombuses, trapezoids, and triangles formed within the divisions. Finally, it demonstrates how to construct a tetrahedron by folding the equilateral triangle divisions.
The document discusses the limitations of a traditional verbal counting model for teaching mathematics to children. It notes that verbal counting is not natural, takes years of practice, provides a poor concept of quantity, ignores place value, is error prone, tedious and inefficient for mastering facts. An alternative approach using letters to represent numbers is presented as a more intuitive method for children.
Physiology and chemistry of skin and pigmentation, hairs, scalp, lips and nail, Cleansing cream, Lotions, Face powders, Face packs, Lipsticks, Bath products, soaps and baby product,
Preparation and standardization of the following : Tonic, Bleaches, Dentifrices and Mouth washes & Tooth Pastes, Cosmetics for Nails.
Exploiting Artificial Intelligence for Empowering Researchers and Faculty, In...Dr. Vinod Kumar Kanvaria
Exploiting Artificial Intelligence for Empowering Researchers and Faculty,
International FDP on Fundamentals of Research in Social Sciences
at Integral University, Lucknow, 06.06.2024
By Dr. Vinod Kumar Kanvaria
How to Build a Module in Odoo 17 Using the Scaffold MethodCeline George
Odoo provides an option for creating a module by using a single line command. By using this command the user can make a whole structure of a module. It is very easy for a beginner to make a module. There is no need to make each file manually. This slide will show how to create a module using the scaffold method.
A review of the growth of the Israel Genealogy Research Association Database Collection for the last 12 months. Our collection is now passed the 3 million mark and still growing. See which archives have contributed the most. See the different types of records we have, and which years have had records added. You can also see what we have for the future.
The simplified electron and muon model, Oscillating Spacetime: The Foundation...RitikBhardwaj56
Discover the Simplified Electron and Muon Model: A New Wave-Based Approach to Understanding Particles delves into a groundbreaking theory that presents electrons and muons as rotating soliton waves within oscillating spacetime. Geared towards students, researchers, and science buffs, this book breaks down complex ideas into simple explanations. It covers topics such as electron waves, temporal dynamics, and the implications of this model on particle physics. With clear illustrations and easy-to-follow explanations, readers will gain a new outlook on the universe's fundamental nature.
Executive Directors Chat Leveraging AI for Diversity, Equity, and InclusionTechSoup
Let’s explore the intersection of technology and equity in the final session of our DEI series. Discover how AI tools, like ChatGPT, can be used to support and enhance your nonprofit's DEI initiatives. Participants will gain insights into practical AI applications and get tips for leveraging technology to advance their DEI goals.
A Strategic Approach: GenAI in EducationPeter Windle
Artificial Intelligence (AI) technologies such as Generative AI, Image Generators and Large Language Models have had a dramatic impact on teaching, learning and assessment over the past 18 months. The most immediate threat AI posed was to Academic Integrity with Higher Education Institutes (HEIs) focusing their efforts on combating the use of GenAI in assessment. Guidelines were developed for staff and students, policies put in place too. Innovative educators have forged paths in the use of Generative AI for teaching, learning and assessments leading to pockets of transformation springing up across HEIs, often with little or no top-down guidance, support or direction.
This Gasta posits a strategic approach to integrating AI into HEIs to prepare staff, students and the curriculum for an evolving world and workplace. We will highlight the advantages of working with these technologies beyond the realm of teaching, learning and assessment by considering prompt engineering skills, industry impact, curriculum changes, and the need for staff upskilling. In contrast, not engaging strategically with Generative AI poses risks, including falling behind peers, missed opportunities and failing to ensure our graduates remain employable. The rapid evolution of AI technologies necessitates a proactive and strategic approach if we are to remain relevant.
ISO/IEC 27001, ISO/IEC 42001, and GDPR: Best Practices for Implementation and...PECB
Denis is a dynamic and results-driven Chief Information Officer (CIO) with a distinguished career spanning information systems analysis and technical project management. With a proven track record of spearheading the design and delivery of cutting-edge Information Management solutions, he has consistently elevated business operations, streamlined reporting functions, and maximized process efficiency.
Certified as an ISO/IEC 27001: Information Security Management Systems (ISMS) Lead Implementer, Data Protection Officer, and Cyber Risks Analyst, Denis brings a heightened focus on data security, privacy, and cyber resilience to every endeavor.
His expertise extends across a diverse spectrum of reporting, database, and web development applications, underpinned by an exceptional grasp of data storage and virtualization technologies. His proficiency in application testing, database administration, and data cleansing ensures seamless execution of complex projects.
What sets Denis apart is his comprehensive understanding of Business and Systems Analysis technologies, honed through involvement in all phases of the Software Development Lifecycle (SDLC). From meticulous requirements gathering to precise analysis, innovative design, rigorous development, thorough testing, and successful implementation, he has consistently delivered exceptional results.
Throughout his career, he has taken on multifaceted roles, from leading technical project management teams to owning solutions that drive operational excellence. His conscientious and proactive approach is unwavering, whether he is working independently or collaboratively within a team. His ability to connect with colleagues on a personal level underscores his commitment to fostering a harmonious and productive workplace environment.
Date: May 29, 2024
Tags: Information Security, ISO/IEC 27001, ISO/IEC 42001, Artificial Intelligence, GDPR
-------------------------------------------------------------------------------
Find out more about ISO training and certification services
Training: ISO/IEC 27001 Information Security Management System - EN | PECB
ISO/IEC 42001 Artificial Intelligence Management System - EN | PECB
General Data Protection Regulation (GDPR) - Training Courses - EN | PECB
Webinars: https://pecb.com/webinars
Article: https://pecb.com/article
-------------------------------------------------------------------------------
For more information about PECB:
Website: https://pecb.com/
LinkedIn: https://www.linkedin.com/company/pecb/
Facebook: https://www.facebook.com/PECBInternational/
Slideshare: http://www.slideshare.net/PECBCERTIFICATION
it describes the bony anatomy including the femoral head , acetabulum, labrum . also discusses the capsule , ligaments . muscle that act on the hip joint and the range of motion are outlined. factors affecting hip joint stability and weight transmission through the joint are summarized.
Assessment and Planning in Educational technology.pptxKavitha Krishnan
In an education system, it is understood that assessment is only for the students, but on the other hand, the Assessment of teachers is also an important aspect of the education system that ensures teachers are providing high-quality instruction to students. The assessment process can be used to provide feedback and support for professional development, to inform decisions about teacher retention or promotion, or to evaluate teacher effectiveness for accountability purposes.
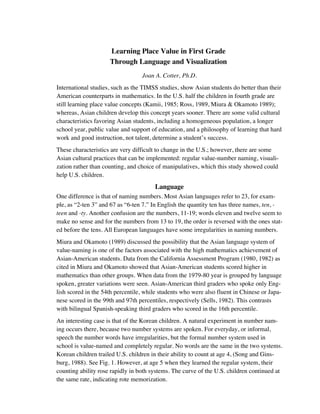
1. Learning Place Value in First Grade
Through Language and Visualization
Joan A. Cotter, Ph.D.
International studies, such as the TIMSS studies, show Asian students do better than their
American counterparts in mathematics. In the U.S. half the children in fourth grade are
still learning place value concepts (Kamii, 1985; Ross, 1989, Miura & Okamoto 1989);
whereas, Asian children develop this concept years sooner. There are some valid cultural
characteristics favoring Asian students, including a homogeneous population, a longer
school year, public value and support of education, and a philosophy of learning that hard
work and good instruction, not talent, determine a student’s success.
These characteristics are very difficult to change in the U.S.; however, there are some
Asian cultural practices that can be implemented: regular value-number naming, visuali-
zation rather than counting, and choice of manipulatives, which this study showed could
help U.S. children.
Language
One difference is that of naming numbers. Most Asian languages refer to 23, for exam-
ple, as “2-ten 3” and 67 as “6-ten 7.” In English the quantity ten has three names, ten, -
teen and -ty. Another confusion are the numbers, 11-19; words eleven and twelve seem to
make no sense and for the numbers from 13 to 19, the order is reversed with the ones stat-
ed before the tens. All European languages have some irregularities in naming numbers.
Miura and Okamoto (1989) discussed the possibility that the Asian language system of
value-naming is one of the factors associated with the high mathematics achievement of
Asian-American students. Data from the California Assessment Program (1980, 1982) as
cited in Miura and Okamoto showed that Asian-American students scored higher in
mathematics than other groups. When data from the 1979-80 year is grouped by language
spoken, greater variations were seen. Asian-American third graders who spoke only Eng-
lish scored in the 54th percentile, while students who were also fluent in Chinese or Japa-
nese scored in the 99th and 97th percentiles, respectively (Sells, 1982). This contrasts
with bilingual Spanish-speaking third graders who scored in the 16th percentile.
An interesting case is that of the Korean children. A natural experiment in number nam-
ing occurs there, because two number systems are spoken. For everyday, or informal,
speech the number words have irregularities, but the formal number system used in
school is value-named and completely regular. No words are the same in the two systems.
Korean children trailed U.S. children in their ability to count at age 4, (Song and Gins-
burg, 1988). See Fig. 1. However, at age 5 when they learned the regular system, their
counting ability rose rapidly in both systems. The curve of the U.S. children continued at
the same rate, indicating rote memorization.
2. 2
100
Korean formal
Korean informal
90
Chinese
80 U.S.
Average Highest Number Counted
70
60
50
40
30
20
10
0
3:6-4:5 4:6-5:5 5:6-6:5
Ages (year:month)
Figure 1. Counting ability by language.
Chart from Song and Ginsburg (1988) p. 326.
Song, M., & Ginsburg, H. (1988). The Effect of the Korean Number System on Young Children's
Counting: A Natural Experiment in Numerical Bilingualism. International Journal of Psychology, 23,
pp. 319-332.
Visualization vs. Counting
Another major difference is the view of counting. In the U.S. counting is considered the
basis of arithmetic; children engage in various counting strategies: counting all, counting
on, and counting back. Conversely, Japanese children are discouraged from counting;
they are taught to recognize and visualize quantities in groups of fives and tens. Children
using counting, which is slow and often unreliable, to add and subtract develop a unitary
concept of number. For example, they think of 14 as 14 ones, not as 1 ten and 4 ones.
Such thinking interferes with understanding carrying and borrowing in larger numbers.
To understand the importance of visualization, try to see mentally 8 apples in a line with-
out any grouping–virtually impossible. Now try to see 5 of those apples as red and 3 as
green; the vast majority of people can form the mental image. The Japanese employ this
sub-base of 5 to make quantities between 6 and 10 easily imaginable. Thus, 8 is seen as 5
and 3. See Fig. 2.
Also, Japanese primary classrooms have very few manipulatives, all of which the chil-
dren must be able to visualize; in contrast to U.S. classrooms, which usually have an
abundance of manipulatives.
3. 3
This collection needs to be This collection can be recognized
counted. It cannot be visualized. and visualized, without counting.
Figure 2.
The Study
Research was conducted in an experimental first grade classroom of 16 children in a rural
community in Minnesota, USA, during the 1994-95 school year (Cotter, 1996). A
matched class, the control, was taught in the traditional workbook method. The research-
er supplied lesson plans in the experimental class.
All mathematical activities concerning quantities centered on place value. Naming quan-
tities, representing them concretely and pictorially, computing, and recording, all focused
on ones, tens, hundreds, and thousands.
The study included six major components: (a) visualizing quantities, (b) value-naming of
tens and ones, (c) an abacus displaying a sub-base of five, (d) overlapping place value
cards, (e) part-part-whole partitioning, and (f) early introduction of multidigit addition
and subtraction. Only the latter two components had been studied previously.
The AL Abacus
A specially designed double-sided abacus, called the AL Abacus, allowed the children to
represent quantities based on fives and tens. On Side 1 of the AL abacus, each bead has a
value of 1. See Figure 3. There are 10 wires, each with 2 groups of 5 beads in contrasting
colors. The first 5 rows have 5 dark colored-beads followed by 5 light-colored beads. The
two colors allow instant recognition, so counting is not needed. Quantities are considered
“entered” when they are moved to the left side.
Figure 3. Representing 7 on Figure 4. The quantity 76 entered
side 1 of the AL abacus. on the abacus.
The last 5 rows are reversed: 5 light-colored beads followed by 5 dark-colored beads, per-
mitting instant recognition of more than 5 tens. See Fig. 4. Thus, any quantity from 1 to
100 can be visualized and recognized. Hundreds are built by combining several aba-
cuses. For example, stacking 3 abacuses represents 300 and stacking 10 abacuses repre-
sents 1000.
4. 4
Visualization also played a part in strategies for learning the facts. For example, to add 9
+ 4, 1 is removed from the 4 and combined with the 9 to give 10 and 3, or 13.
On Side 2 of the abacus, beads have a value according to their position. See Figure 5.
Note that two wires are used to show each denomination. Enter quantities by moving
beads up. The children worked with four-digit quantities, trading between denominations
as needed.
4 0 0 0 4 0 0 0 4 8 1 3
8 0 0
8 0 0 1 0
3
1 0
3
Figure 6. Overlapping place value cards showing
the composition of 4813.
Figure 5. Representing 4813
on side 2 of the AL abacus.
Place Value Cards
To help children compose and record multidigit numbers, they used overlapping place
value cards. See Figure 6. Children learned the 8 in 813 is 8 hundred because two zeroes
(or other digits) follow it. This meant they read numbers in the normal left to right order,
and not backwards as is done with the column approach of starting at the right and say-
ing, “ones, tens, hundreds.”
Results
Some significant findings comparing the experimental class to the control class are the
following: (a) Three times as often, the experimental class preferred to represent numbers
11, 13, 28, 30, and 42 with tens and ones instead of a collection of ones. (b) Only 13% of
the control class, but 63% of the experimental class correctly explained the meaning of
the 2 in 26 after the 26 cubes were grouped in 6 containers with 2 left over. (c) In the con-
trol class 47% knew the value of 10 + 3 and 33% knew 6 + 10, while 94% and 88%, re-
spectively, of the experimental class knew. (d) In the control class 33% subtracted 14
from 48 by removing 1 ten and 4 ones rather than 14 ones; 81% of the experimental class
did so. (e) When asked to circle the tens place in the number 3924, 7% of the control
class and 44% of the experimental did so correctly. (f) None of the control class mentally
computed 85 – 70, but 31% of the experimental class did. (g) For the sum of 38 + 24,
40% of the control class incorrectly wrote 512, while none in the experimental class did.
5. 5
Notable comparisons with the work of other researchers showed that: (a) all of the chil-
dren in this study made at least one “tens and ones” representation of 11, 13, 28, 30, and
42, while only 50% of the U.S. children did so in the study by Miura & Okamoto (1989);
(b) 63% of children in this study made all five “tens and ones” representations, while
only 2% of the U.S. children did so in the study by Miura & Okamoto; (c) 93% of the
children explained the meaning of the digits in 26 while 50% of the third graders in
Ross’s (1989) did so; (d) 94% of the children knew 10 + 3 while 67% of beginning sec-
ond graders in Steinberg’s (1985) knew; (e) 88% knew 6 + 10 compared to 72% of the
second graders in Reys et al. (1993) study; (f) 44% of the children circled the tens place
in 3924 while data from the 1986 NAEP (Kouba et al., 1988) found 65% of third graders
circled the tens place in a four-digit number; (g) 63% of the children named 511 as great-
er than 298, which compared to 40% of 6-year-olds in Geneva, Switzerland, and 33% in
Bariloche, Argentina, (Sinclair & Scheuer, 1993); (h) 56% mentally computed 64 + 20,
which compared to 52% of nine-year-olds on the 1986 NAEP study; and (i) 69% mental-
ly computed 80 – 30 while 9% of the second graders in Reys et al. study did so.
The children also worked with four-digit addition and subtraction algorithms. They
learned the procedure on side 2 of the abacus and spontaneously transferred their knowl-
edge to the paper and pencil algorithm. While learning the procedure, they recorded their
results as it was formed on the abacus along with any carries. The children did not prac-
tice the algorithm for two-place numbers as these were done mentally. On the final test
where the problem, 2304 + 86 =, was written horizontally, 56% of the children did it cor-
rectly, including one child who did it in his head.
Summary
Both the teacher and children enjoyed this new approach for first grade mathematics. The
children did construct a tens-base approach to numbers, rather than a unitary concept.
They learned their addition and subtraction combinations through strategies based on
fives and tens.
The lowest ability child, who weighed about 1200 gm (2 pounds 9 ounces) at birth and
was hydrocephalic, was asked to draw what 12 looks like. He drew 10 objects in the first
row and 2 in the second row and explained it by saying that it had to be that way because
12 is 10 and 2. He also could mentally add 9 to a number; for example, he added 9 + 4 by
changing it to 10 + 3. The most advanced child at the conclusion of the study was sur-
prised to learn that not all children learned to add and subtract 4-digit numbers in first
grade. There were no problems or complaints from parents with the children using value-
named words for numbers, which they did for the first three months of the school year.
Sequel
The following year, 1995-96, the lesson plans were modified and used for both first grade
classes. In April, both classes took the First Grade Testronics National Standardized Test,
6. 6
published by ACT (American College Test), and scored at the 98th percentile. The pro-
gram was also introduced into the kindergarten. Half of the children developed the con-
cept of tens and ones.
In the 1996-97 school year, there was one first grade class with 23 children; that class
also scored at the 98th percentile.
References
Clements, D. H. “Subitizing: What Is it? Why Teach It?” Teaching Children
Mathematics 5 (March 1999): 400-404.
Cotter, J. A. (1996). Constructing a Multidigit Concept of Numbers: A Teaching
Experiment in the First Grade. (Doctoral dissertation, University of Minnesota,
1996). Dissertation Abstracts International #9626354.
Cotter, J. A. (2000). “Using Language and Visualization to Teach Place Value.”
Teaching Children Mathematics, 7 (October 2000): 108-114.
Cotter, J. A. (2002). “Using Language and Visualization to Teach Place Value.” NCTM
On-Math, 1 (2) (Winter 2002):
http://my.nctm.org/eresources/view_article.asp?article_id=2261
Kamii, C. K. (with G. DeClark) (1985). Young Children Reinvent Arithmetic. New York:
Teachers College Press.
Kouba, V. L., C. A. Brown, T. P. Carpenter, M. M. Lindquist, E. A. Silver, & J. O.
Swafford. (1988). “Results of the Fourth NAEP Assessment of Mathematics:
Number, Operations, and Word Problems.” Arithmetic Teacher, 35(8), 14-19.
Miura, I. T., & Y. Okamoto. (1989). “Comparisons of U.S. and Japanese First Graders'
Cognitive Representation of Number and Understanding of Place Value.” Journal
of Educational Psychology, 81(1), 109-114.
Ross, S. H. (1989). Parts, Wholes, and Place Value: A Developmental View. Arithmetic
Teacher, 36(6), 47-51.
Sells, L. W. (1982). Leverage for Equal Opportunity Through Mastery of Mathematics.
In S. M. Humphreys (Ed.), Women and Minorities in Science (pp. 6-25). Boulder,
CO: Westview Press.
Sinclair, A. & N. Scheuer. (1993). Understanding the Written Number System: 6
Year-olds in Argentina and Switzerland. Educational Studies in Mathematics, 24,
199-221.
Song, M., & H. Ginsburg. (1988). The Effect of the Korean Number System on Young
Children's Counting: A Natural Experiment in Numerical Bilingualism.
International Journal of Psychology, 23, 319-332.
Sun, Wei and Joanne Y. Zhang. “Teaching Addition and Subtraction Fact: A Chinese
Perspective.” Teaching Children Mathematics 8 (Sept 2001): 28-31.
Electronic Abacus: http://illuminations.nctm.org/mathlets/abacus/index.html
Activities for Learning, Inc.; RightStart™ Mathematics
800-RS5Math • 701-782-2000 • Fax: 701-782-2007
info@ALabacus.com
www.ALabacus.com