
Recommended
More Related Content
Similar to research on journaling
Similar to research on journaling (20)
More from rikaseorika
More from rikaseorika (20)
Recently uploaded
Recently uploaded (20)
research on journaling
- 1. Journal of Science and Technology ISSN: 2456-5660 Volume 5, Issue 01 (JAN-FEB 2020) www.jst.org.in DOI: https://doi.org/10.46243/jst.2022.v7.i02.pp 61-83 Published by: Longman Publishers www.jst.org.in P a g e 61 | 23 FLOOD ESTIMATE USING GIS SPECIFIC TO FLOOD STUDIES FOR UPPER SARADA RIVER BASIN IN VISAKHAPATNAM DISTRICT, ANDHRA PRADESH, INDIA B.V.Shiva Kumar†* , Y. Bhuvaneswari Devi† , V.Mahammood* †* Research Scholar, Department of Civil Engineering, Andhra University College of Engineering, Visakhapatnam, Andhra Pradesh, India.. † M.E.Student , Department of Civil Engineering, Andhra University College of Engineering, Visakhapatnam, Andhra Pradesh, India.. * Professor, Department of Civil Engineering, Andhra University College of Engineering, Visakhapatnam, Andhra Pradesh, India.. Corresponding author Email ID:shivakumar.bandaru@gmail.com To Cite this Article B.V.Shiva Kumar†* , Y. Bhuvaneswari Devi† , V.Mahammood, “FLOOD ESTIMATE USING GIS SPECIFIC TO FLOOD STUDIES FOR UPPER SARADA RIVER BASIN IN VISAKHAPATNAM DISTRICT, ANDHRA PRADESH, INDIA”, Journal of Science and Technology, Vol. 05, Issue 01, Jan-Feb 2020. Article Info Received: 24-01-2020 Revised:02-02-2020 Accepted:11-02-2020 Published: 21-02-2020 Abstract Geographical Information System (GIS) techniques have been effectively used for the study of drainages and estimation of runoff of a catchment. In this paper, the flood estimate of the Upper Sarada River Basin is analyzed using GIS techniques. The Upper Sarada River Basin is analyzed by building a Drainage Elevation Model and thereby extracting the drainage map. The runoff is estimated on this catchment by assuming unit net rainfall (1cm direct runoff) and taking appropriate assumptions. For this purpose, streams in a River Basin are assigned weights with respect to slope of the area and using the same, a travel time contour map represented by isochrones is developed from the equivalent distance map. The flow accumulation map of the drainages is also developed and then this is used to determine discharge at outlet of the catchment. The entire basin area is divided into eleven parts of equal interval of travel time and the yield caused in each part is determined. Further, this is used to determine the discharge at the end of eleven-time steps and the resulting unit hydrograph (UH) is plotted. UH is prepared for the daily average run-off values. An S-hydrograph is also plotted to obtain a UH of selected time duration for the use in flood estimate due to a storm. This hydrograph is validated by taking different selected storm events from the year 1990 to 2019, recorded by Central Water Commission (CWC), Anakapalle station. Eight storm events are observed and these are validated using Thiessen polygon method. Keywords: DEM, Runoff, Catchment, Isochrones, Unit Hydrograph, Flood estimation and Thiessen polygon map.
- 2. Journal of Science and Technology ISSN: 2456-5660 Volume 5, Issue 01 (JAN-FEB 2020) www.jst.org.in DOI: https://doi.org/10.46243/jst.2022.v7.i02.pp172-194 v Published by: Longman Publishers www.jst.org.in P a g e 62 | 23 INTRODUCTION The nature of stream flow in any region is related to rainfall characteristics and the morphology of the watershed. The rainfall characteristics include the intensity and volume of rainfall and its spatial and temporal distribution. The study of the hydrological characteristics of the basins and development of mathematical models for rainfall and runoff relationships that bind it with the topographic characteristics was first made by Sherman(1932).The geomorphic characteristics are the channel network and the surrounding landscape, which translate the rainfall input into an output hydrograph at the outlet of the watershed (Berihun et al. 2019). An unusual high state of the river flow due to excess runoff from rainfall produces flood. The maximum flood discharge (peak runoff) in a river may be determined by different methods(Zhu & Hao, 2014). They are empirical formulae and curves, concentration time method, overland flow hydrograph, rational method, unit hydrograph method and flood frequency studies( Sreedevi et al. 2013; Vijay P. Singh,1988). One of the above methods, flood estimation by unit hydrograph method is mostly used for catchments having areas less than 5000 km2 (Arnold et al. 1998;Destaet al. 2019). In the recent times, digital elevation model (DEM) based unit hydrograph using Geographic Information System (GIS) has gained importance as an effective tool for the analysis of spatial, non-spatial data on drainage, geology, landform parameters and to understand their interrelationships(Debala Devi & Usha Anandhi, 2009;Maathuis & Wang; 2006, Moore et al. 1991; Noto & La Loggia, 2007). LITERATURE REVIEW DEMs are most widely used in the watershed modeling. The automatic derivation of topographic watershed data from DEM is faster, less subjective and provides more reproducible measurements than the traditional manual techniques applied using the topographic maps( Patel & Sarkar ,2010). The technological advances provided by GIS and the increasing availability and high quality DEMs have greatly expanded the application potential of DEMs in many hydrologic, hydraulic, water resources and environmental investigations(Moore et al. 1991; Singh et al. 2014). The DEM provides a basic spatial reference system to the GIS spatial data. Images or vector information can automatically be draped over and integrated with the DEM for more advanced analysis(Lau et al. 2010). Effective process for drainage network identification
- 3. Journal of Science and Technology ISSN: 2456-5660 Volume 5, Issue 01 (JAN-FEB 2020) www.jst.org.in DOI: https://doi.org/10.46243/jst.2022.v7.i02.pp 61-83 Published by: Longman Publishers www.jst.org.in P a g e 63 | 23 based on DEMs by conducting a comparative analysis of various geomorphologic characteristics. In India, DEMs have been employed for River Basin analysis, estimation of soil loss, water resource evaluation and topographic characterization by various hydrologists(Agarwal et al. 2012; Aher et al. 2014; Patel & Sarkar, 2010). Rational method is a popular technique developed to predict peak flow rates for small watersheds (Kinthada 2014). Hydrologists felt the need to have an analogous procedure that predicts the peak flow rate for larger watersheds. A modification of the ‘Rational method’ was based on the concept of isochrones. Thus, the modified ‘Rational method’ was used to solve many of the same type of problems as the original rational method. However, it generally produced more realistic and accurate solutions (Singh et al. 2014). The unit hydrograph concept was first proposed by Sherman in 1932 based on the principle of superposition for estimating surface runoff in gauged basins(Maddamsetty et al. 2010). This theory has been considered an important contribution to the field of hydrology in deriving flood hydrograph. It was one of the first tools available to hydrologists to predict entire hydrographs instead of just peak discharges (Xiong 2011). After studying watersheds in the Appalachian Mountains of the United States, Snyder (1938) proposed and developed a set of empirical equations for Synthetic Unit Hydrograph (SUH) for large number of catchments in Appalachian Highland of Eastern United States. Albishi (2016) derived a unit hydrograph of Allith River Basin in the South West of Saudi Arabia and its S-curve in the South Western part of Saudi Arabia for predicting flash flood more accurately in the region. Gebremeskel et al. (2002) proposed a flood estimation method by combining GIS with distributed hydrologic modeling. This method has mainly focused on discussing a flood hydrograph estimation method by using physiographic characteristics and recorded meteorological data. Elmoustafa et al. (2013) used digital elevation model to delineate watersheds and the morphological parameters to determine flood risk in the Sinai Peninsula, Egypt. Therefore, the broad inferences that can be drawn from the review of literature are: a) DEMs are widely accepted for use in drainage pattern extraction.
- 4. Journal of Science and Technology ISSN: 2456-5660 Volume 5, Issue 01 (JAN-FEB 2020) www.jst.org.in DOI: https://doi.org/10.46243/jst.2022.v7.i02.pp172-194 v Published by: Longman Publishers www.jst.org.in P a g e 64 | 23 b) DEMs are very useful for hydrological processing of the catchment, but little has been done for developing hydrograph from the hydrological processing. c) The Time–Area (TA) technique is believed to perform best for small to intermediate steep watersheds where runoff process is mainly governed by translation. Hence, an attempt is made in the present study to use DEM for the simulation on a catchment for estimating flood through the preparation of unit hydrograph and validate the model comparing the results with the observed flood discharges. Objectives of the Study The present study has been taken up with the following objectives: To prepare a Digital Elevation Model of the study area. To obtain the drainage characteristics of the study area. To derive a Peak Runoff Unit Hydrograph for the drainage basin from DEM hydro processing and to estimate peak floods for different storms. To validate the peak flood discharge obtained from the computed hydrograph for the total study area. For this purpose, a part of the Sarada River Basin has been taken as a case study. Study Area The Sarada is an East flowing medium sized river located in Visakhapatnam district of Andhra Pradesh on the East Coast of India (Fig 1). The river has a total catchment area of 2,665 km2 .The 122 km long Sarada River originates at approximately 1000 m elevation in the Anantagiri hills of the Eastern Ghats and flows in a general NW–SE direction for over 62 km up to Anakapalle town, where it abruptly changes its direction to N–S, and finally empties into the Bay of Bengal. Bound by 17°25' and 18°15' North latitudes, and 82°32' and 83°06' East longitudes, the length of the Sarada River Basin is 90 km along its long axis (North to South) and about 55 km at its widest(East to West) in its headwater region. The overall drainage network in the basin appears to be dendritic to sub-dendritic pattern. Being essentially a rain fed river, the water flow in Sarada and its tributaries is highly seasonal and hence it is an ephemeral drainage system. The basin is surrounded by River Nagavali on the North, River Gosthani, Gambhiram Gedda, Meghadri Gedda on the East, Bay of Bengal on the South,
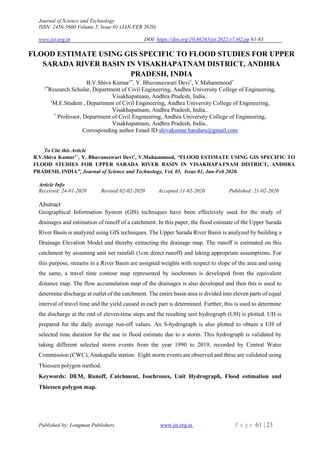
- 5. Journal of Science and Technology ISSN: 2456-5660 Volume 5, Issue 01 (JAN-FEB 2020) www.jst.org.in DOI: https://doi.org/10.46243/jst.2022.v7.i02.pp 61-83 Published by: Longman Publishers www.jst.org.in P a g e 65 | 23 Tandava and Eleru River Basins and the Machhkund sub-basin of the River Godavari on the West(Kinthada 2014). Fig. 1: Location of the Upper Sarada River Basin There is one river gauge station on the Sarada River located near Anakapalle town (17°41'21.66" N, 82°59'53" E) and maintained by the Central Water Commission (CWC), Government of India. Hence, the present study is restricted to the Upper Sarada River Basin covering the drainage network up to the river gauge point. The Upper Sarada River Basin comprising a catchment area of 1952 km2 and bound by 17°41'10" and 18°15' North latitudes, and 82°32’ and 83°06' East longitudes. The Sarada River is joined by several tributaries along its left bank, while very few or no main tributaries join it along its right bank. Some of the important tributaries contributing their discharge to the Sarada River along its left bank are: Bodderu Nadi, Tacheru Vagu, Vedurla Gedda, Pedderu and Chintagedda (Fig. 2).
- 6. Journal of Science and Technology ISSN: 2456-5660 Volume 5, Issue 01 (JAN-FEB 2020) www.jst.org.in DOI: https://doi.org/10.46243/jst.2022.v7.i02.pp172-194 v Published by: Longman Publishers www.jst.org.in P a g e 66 | 23 Fig. 2: Drainage Map of the Upper Sarada River Basin Data Collected Data on rainfall and river discharges, which provide the important information on the hydrographic conditions of the basin are collected from the governments’ records and tabulated here. Rainfall data Data on rainfall have been collected from 23 rain gauge stations set up by AP Revenue Department in as many revenue‘mandals’ (tahsils) in and around the Sarada River Basin in Visakhapatnam district. The daily rainfall data recorded at each of these 23 mandals over a 30-year period from 1990 to 2019were obtained from the Directorate of Economics and Statistics (Revenue Department, Visakhapatnam). Fig. 3 shows the location of the rain gauge stations from which the rainfall data was collected. Table 1 shows the mean annual rainfall for each rain gauge station. The rain gauge stations are represented by their ID numbers as given in the Table 1.
- 7. Journal of Science and Technology ISSN: 2456-5660 Volume 5, Issue 01 (JAN-FEB 2020) www.jst.org.in DOI: https://doi.org/10.46243/jst.2022.v7.i02.pp 61-83 Published by: Longman Publishers www.jst.org.in P a g e 67 | 23 Fig. 3: Location of rain gauge stations in the study area. Numbers in parentheses below the names of the rain gauge stations indicate the average annual rainfall in mm recorded at the respective stations. Table 1: Data on mean annual rainfall from 23 Rain gauge stations in and around Upper Sarada River Basin in Visakhapatnam district S.No. Rain Gauge Station ID Names of Rain Gauge Stations Mean Annual Rainfall (mm) Longitude (° E) Latitude (° N) 1 2 KASIMKOTA 1130 82.96 17.66 2 3 ANAKAPALLE 1181 83.00 17.69 3 4 CHODAVARAM 1163 82.94 17.82 4 5 DEVARAPALLE 1188 82.98 17.98 5 6 ANANTHAGIRI 1309 83.00 18.23 6 7 YELAMANCHILI 1114 82.86 17.54 7 8 K KOTAPADU 1198 83.04 17.88 8 9 CHEEDIKADA 1158 82.89 17.92
- 8. Journal of Science and Technology ISSN: 2456-5660 Volume 5, Issue 01 (JAN-FEB 2020) www.jst.org.in DOI: https://doi.org/10.46243/jst.2022.v7.i02.pp172-194 v Published by: Longman Publishers www.jst.org.in P a g e 68 | 23 9 10 MADUGULA 1359 82.81 17.91 10 11 MAKAVARAPALEM 1174 82.72 17.61 11 12 BUTCHAYYAPETA 1098 82.87 17.78 12 15 MUNAGAPAKA 1106 82.99 17.63 13 19 PEDABAYALU 1310 82.58 18.28 14 20 ROLUGUNTA 1228 82.67 17.71 15 21 NARSIPATNAM 1247 82.61 17.66 16 23 GOLUGONDA 1159 82.47 17.67 17 25 S RAYAVARAM 1112 82.80 17.45 18 26 RAVIKAMATHAM 1190 82.80 17.79 19 27 PADERU 1269 82.67 18.07 20 28 PARAVADA 1131 83.07 17.62 21 29 G MADUGULA 1395 82.53 18.01 22 30 MUNCHINGIPUTT 1623 82.51 18.36 23 31 HUKUMPETA 1237 82.69 18.14 Average Annual Rainfall: 1121 mm River discharge data The Sarada River discharge data for the study area from the year 1990 to 2019, recorded by Central Water Commission (CWC), Anakapalle station, was used to select flood events and validation of the predicted flood discharges is done using this data. METHODOLOGY The estimation of runoff for a unit net rainfall was done for the selected drainage basin of the study area to prepare a unit hydrograph. In this paper, the Survey of India maps were scanned and geo-coded using UTM (Universal Transverse Mercator) projection, zone 44 and Everest 1956 spheroid. ILWIS software was used to digitise contour maps (with value domain) and drainage maps (with class domain). The streams in the drainage map are designated by Strahler order such as first order, second order, third order, fourth order, etc; whereas contours are denoted with their elevation values (Strahler, 1957). By contour interpolation, DEM was developed and used for processing the drainage extraction. The DEM hydro-processing includes filling of local depressions (fill sinks), creation of flow direction map, flow accumulation map, drainage network extraction and drainage network ordering. The
- 9. Journal of Science and Technology ISSN: 2456-5660 Volume 5, Issue 01 (JAN-FEB 2020) www.jst.org.in DOI: https://doi.org/10.46243/jst.2022.v7.i02.pp 61-83 Published by: Longman Publishers www.jst.org.in P a g e 69 | 23 methodology for drainage extraction from DEM is shown in a flowchart (Fig 4). Fig. 4: Flowchart of Methodology for drainage extraction from DEM Fig. 5: Flowchart showing the GIS methodology for Unit Hydrograph preparation The DEM of the selected drainage basin was used to develop a classified slope map.The slope map was classified based on the USGS classification system. As the flow velocity (V) is proportional to the slope (S), i.e., V = f (S1/2 ), the slope map was assigned weightages based on this criterion. Then the weighted map for the drainages was developed. Further, a point map of the outlet to the catchment was prepared, for the use as ‘source’ to prepare the distance map, which shows the equivalent distances from the outlet, through ‘Distance Calculation operation’ in ILWIS 3.4. This distance map was converted to a point map, and the point map was opened as a table having point data with coordinates. This point data was imported into the SURFER
- 10. Journal of Science and Technology ISSN: 2456-5660 Volume 5, Issue 01 (JAN-FEB 2020) www.jst.org.in DOI: https://doi.org/10.46243/jst.2022.v7.i02.pp172-194 v Published by: Longman Publishers www.jst.org.in P a g e 70 | 23 10 to develop contours of equal interval showing lines joining the points of equal time of concentration from the outlet. These isochrones are then imported to ILWIS 3.4. This map was then digitized to get segment map and was then rasterised. The rasterised contour map was crossed in ILWIS with the flow accumulation map of the extracted drainage map. This yielded the values of the discharge in terms of number of pixels for each time step (isochrones interval). Using this data, the runoff was estimated by taking appropriate assumptions and a unit hydrographwas plotted. An S-hydrograph was plotted to obtain a unit hydrograph of selected time duration for the use in flood estimate due to a storm. The flowchart showing the methodology used for the preparation of the unit hydrograph is shown in Fig. 5 and the flowchart showing the overall methodology of flood prediction is shown in Fig. 6. Fig. 6: Flowchart of overall methodology used for flood estimation The assumptions made to prepare the unit hydrograph (UH) are: 1. Entire area is divided into eleven equal time steps (∆T) based on upstream distance from the outlet. 2. Rainfall duration is equal to 11*ΔT. 3. Average rainfall is obtained from Thiessen polygon prepared using nearest point method in ILWIS. 4. Storm occurred uniformly over the entire catchment.
- 11. Journal of Science and Technology ISSN: 2456-5660 Volume 5, Issue 01 (JAN-FEB 2020) www.jst.org.in DOI: https://doi.org/10.46243/jst.2022.v7.i02.pp 61-83 Published by: Longman Publishers www.jst.org.in P a g e 71 | 23 5. Run off coefficient is uniform over the entire catchment. 6. Base flow is zero. 7. Runoff is dependent on the gradient. RESULTS & DISCUSSION Based on the assumption of spatially uniform rainfall of uniform intensity, the peakest runoff unit hydrograph is developed from DEM using GIS analysis for Upper Sarada River Basin (Fig. 7&Table 2). The peakest discharge for the 54.56 hour rainfall giving 1cm direct runoff is found to be 96.88m3 /s with basin lag of 27.28 hour. Fig. 7: Unit Hydrograph for Upper Sarada River Basin The peak discharge for the one day and 6 hr unit hydrograph obtained from S-hydrograph (Fig.8, Fig. 9&Table 3) was computed to be 91.13 m3 /s and 72.89 m3 /s, a base period of 104.17& 84.33 hour with a basin lag of 54.56 & 44.64 hour. 0 20 40 60 80 100 120 0 1000 2000 3000 4000 5000 6000 7000 Discharge (m³/s) Time (min) UH for Upper Sarada River Basin UNIT HYDROGRAPH Peak discharge= 96.88 m³/s Basin lag=27.28 hr Rainfall duration=54.56 hr Base period=109.12 hr
- 12. Journal of Science and Technology ISSN: 2456-5660 Volume 5, Issue 01 (JAN-FEB 2020) www.jst.org.in DOI: https://doi.org/10.46243/jst.2022.v7.i02.pp172-194 v Published by: Longman Publishers www.jst.org.in P a g e 72 | 23 Fig. 8: S-Hydrograph for Upper Sarada River Basin Fig. 9: Computed hydrographs using maximum computed discharge of 6 hr and One-Day duration derived from S–hydrograph for Upper Sarada River Basin
- 13. Journal of Science and Technology ISSN: 2456-5660 Volume 5, Issue 01 (JAN-FEB 2020) www.jst.org.in DOI: https://doi.org/10.46243/jst.2022.v7.i02.pp 61-83 Published by: Longman Publishers www.jst.org.in P a g e 73 | 23 Table 2: Peak Run-off computation for Upper Sarada River Basin Isochrones (m) Time (min) Q (Npix) ΔQ (Npix) Cum ΔQ (Npix) Flow Area (m²) Discharge (m³/s) 0 0 0 0 0 0 0 100000 297.62 3044715 125616 125616 78510000 4.00 200000 595.24 2919099 110033 235649 147280625 7.50 300000 892.86 2809066 194225 429874 268671250 13.68 400000 1190.48 2614841 192129 622003 388751875 19.79 500000 1488.1 2422712 347164 969167 605729375 30.84 600000 1785.72 2075548 467476 1436643 897901875 45.71 700000 2083.34 1608072 402775 1839418 1149636250 58.53 800000 2380.96 1205297 504330 2343748 1464842500 74.57 900000 2678.58 700967 376806 2720554 1700346250 86.56 1000000 2976.2 324161 146769 2867323 1792076875 91.23 1100000 3273.82 177392 177392 3044715 1902946875 96.88 3571.44 2919099 1824436875 92.88 3869.06 2809066 1755666250 89.38 4166.68 2614841 1634275625 83.20 4464.3 2422712 1514195000 77.09 4761.92 2075548 1297217500 66.04 5059.54 1608072 1005045000 51.17 5357.16 1205297 753310625 38.35 5654.78 700967 438104375 22.30 5952.4 324161 202600625 10.31 6250.02 177392 110870000 5.64 6547.64 0 0 0
- 14. Journal of Science and Technology ISSN: 2456-5660 Volume 5, Issue 01 (JAN-FEB 2020) www.jst.org.in DOI: https://doi.org/10.46243/jst.2022.v7.i02.pp172-194 v Published by: Longman Publishers www.jst.org.in P a g e 74 | 23 Table 3: Computation of S - Hydrograph, 6 hr UH and 1 Day UH for Upper Sarada River Basin T (hrs) Q (m³/s ) Lag 54.5 hrs Lag 54.5 hrs S-H YG T (hrs) S-H YG T (hrs) S-H YG T (hrs) S-H YG Shift ed by 6hrs Diff. T (hrs) 6 hrs UH T (hrs) S-H YG Shift ed by 24hr s Diff. 0 0 0 0 0 0 0 0 0 0 0 0 0 0 0 0 0 0 4.96 4 0 0 4 4.96 4 2.48 2 1.24 1 0 1 1.24 1 1.24 1 1 9.92 7.5 0 0 7.5 9.92 7.5 4.96 4 2.48 2 0 2 2.48 2 2.48 2 2 14.88 13.68 0 0 13.68 14.88 13.68 7.44 5.75 3.72 3 0 3 3.72 3 3.72 3 3 19.84 19.79 0 0 19.79 19.84 19.79 9.92 7.5 4.96 4 0 4 4.96 4 4.96 4 4 24.8 30.84 0 0 30.84 24.8 30.84 14.88 13.68 6.2 4.87 0 4.87 6.2 4.87 6.2 4.87 4.87 29.76 45.71 0 0 45.71 29.76 45.71 19.84 19.79 7.44 5.75 0 5.75 7.44 4.75 7.44 5.75 5.75 34.72 58.53 0 0 58.53 34.72 58.53 24.8 30.84 9.92 7.5 1 6.5 9.92 5.5 9.92 7.5 7.5 39.68 74.57 0 0 74.57 39.68 74.57 29.76 45.71 14.88 13.68 2 11.68 14.88 10.68 14.88 13.68 13.68 44.64 86.56 0 0 86.56 44.64 86.56 34.72 58.53 19.84 19.79 3 16.79 19.84 15.79 19.84 19.79 19.79 49.6 91.23 0 0 91.23 49.6 91.23 39.68 74.57 24.8 30.84 4 26.84 24.8 25.96 24.8 30.84 0 30.84 54.56 96.88 0 0 96.88 54.56 96.88 44.64 86.56 29.76 45.71 4.87 40.84 29.76 39.96 29.76 45.71 1 44.71 59.52 92.88 4 0 96.88 59.52 96.88 49.6 91.23 34.72 58.53 5.75 52.78 34.72 51.03 34.72 58.53 2 56.53 64.48 89.38 7.5 0 96.88 64.48 96.88 54.56 96.88 39.68 74.57 7.5 67.07 39.68 60.9 39.68 74.57 3 71.58 69.44 83.2 13.68 0 96.88 69.44 96.88 59.52 96.88 44.64 86.56 13.68 72.88 44.64 66.77 44.64 86.56 4 82.57 74.41 77.09 19.79 0 96.88 74.41 96.88 64.48 96.88 49.6 91.23 19.79 71.44 49.6 60.4 49.6 91.23 4.87 86.36 79.37 66.04 30.84 0 96.88 79.37 96.88 69.44 96.88 54.56 96.88 30.84 66.04 54.56 51.17 54.56 96.88 5.75 91.13 84.33 51.17 45.71 0 96.88 84.33 96.88 74.41 96.88 59.52 96.88 45.71 51.17 59.52 38.35 59.52 96.88 7.5 89.38 89.29 38.35 58.53 0 96.88 89.29 96.88 79.37 96.88 64.48 96.88 58.53 38.35 64.48 22.3 64.48 96.88 13.68 83.2 94.25 22.3 74.57 0 96.88 94.25 96.88 84.33 96.88 69.44 96.88 74.57 22.31 69.44 10.31 69.44 96.88 19.79 77.09 99.21 10.31 86.56 0 96.88 99.21 96.88 89.29 96.88 74.41 96.88 86.56 10.32 74.41 5.64 74.41 96.88 30.84 66.04 104.2 5.64 91.23 0 96.88 104.2 96.88 94.25 96.88 79.37 96.88 91.23 5.65 79.37 0 79.37 96.88 45.71 51.17 109.1 0 96.88 0 96.88 109.1 96.88 99.21 96.88 84.33 96.88 96.88 0 84.33 96.88 58.53 38.35 92.88 4 96.88 104.2 96.88 89.29 96.88 96.88 0 89.29 96.88 74.57 22.3 89.38 7.5 96.88 109.1 96.88 94.25 96.88 96.88 0 94.25 96.88 86.56 10.31 83.2 13.68 96.88 99.21 96.88 96.88 0 99.21 96.88 91.23 5.64 77.09 19.79 96.88 104.2 96.88 96.88 0 104.2 96.88 96.88 0 66.04 30.84 96.88 109.1 96.88 96.88 0 109.1 96.88 96.88 0 51.17 45.71 96.88 96.88 38.35 58.53 96.88 96.88 22.3 74.57 96.88 96.88 10.31 86.56 96.88 96.88 5.64 91.23 96.88 96.88 0 96.88 96.88 96.88 92.88 92.88 96.88 89.38 89.38 96.88 83.2 83.2 96.88 77.09 77.09 96.88 66.04 66.04
- 15. Journal of Science and Technology ISSN: 2456-5660 Volume 5, Issue 01 (JAN-FEB 2020) www.jst.org.in DOI: https://doi.org/10.46243/jst.2022.v7.i02.pp 61-83 Published by: Longman Publishers www.jst.org.in P a g e 75 | 23 51.17 51.17 38.35 38.35 22.3 22.3 10.31 10.31 5.64 5.64 0 0 Flood prediction for Selected Storms: From the available rainfall and river discharge data, eight storm events are selected for validating the models (Fig. 10 to Fig. 17). The peak runoff hydrograph is validated with the observed hydrographs. A comparison of observed and computed peak flood discharges in the study area is given in Table 4. Fig. 10: Hyetograph, flood hydrograph and observed discharge for Upper Sarada River Basin for the storm event during 03rd October– 13th October, 1992. Observations from graph in Fig. 10 are: (i) The maximum observed discharge is 499.70 m3 /s. (ii) The computed peak discharge obtained from one day UH is 517.95 m3 /s. (iii) The computed peak discharge occurred on the Sixth day. (iv) The observed peak also occurred on the same day. (v) The computed peak discharge exceeded the observed discharge by 18.25 m3 /s
- 16. Journal of Science and Technology ISSN: 2456-5660 Volume 5, Issue 01 (JAN-FEB 2020) www.jst.org.in DOI: https://doi.org/10.46243/jst.2022.v7.i02.pp172-194 v Published by: Longman Publishers www.jst.org.in P a g e 76 | 23 Fig. 11: Hyetograph, flood hydrograph and observed discharge for Upper Sarada River Basin for the storm event during 06th October– 19th October, 1995. Observations from graph in Fig. 11 are: (i) The maximum observed discharge is 571.10 m3 /s. (ii) The computed peak discharge obtained from one day UH is 603.35 m3 /s. (iii) The computed peak discharge occurred on the Sixth day. (iv) The observed peak occurred on the Fifth day. (v) The computed peak discharge exceeded the observed discharge by 32.25 m3 /s Fig. 12: Hyetograph, flood hydrograph and observed discharge for Upper Sarada River Basin for the storm event during 09th October– 20th October, 1998.
- 17. Journal of Science and Technology ISSN: 2456-5660 Volume 5, Issue 01 (JAN-FEB 2020) www.jst.org.in DOI: https://doi.org/10.46243/jst.2022.v7.i02.pp 61-83 Published by: Longman Publishers www.jst.org.in P a g e 77 | 23 Observations from graph in Fig. 12 are: (i) The maximum observed discharge is 887.00 m3 /s. (ii) The computed peak discharge obtained from one day UH is 955.67 m3 /s. (iii) The computed peak discharge occurred on the Ninth day. (iv) The observed peak occurred on the Eighth day. (v) Themaximum observed discharge exceeded the computed peak discharge by 68.67 m3 /s. Fig. 13: Hyetograph, flood hydrograph and observed discharge for Upper Sarada River Basin for the storm event during 12th October – 24th October, 2005. Observations from graph in Fig. 13 are: (i) The maximum observed discharge is 572.67 m3 /s. (ii) The computed peak discharge obtained from one day UH is 662.37 m3 /s. (iii) The computed peak discharge occurred on the Fifth day. (iv) The observed peak occurred on the Fourth day. (v) The computed peak discharge exceeded the observed discharge by 89.70 m3 /s.
- 18. Journal of Science and Technology ISSN: 2456-5660 Volume 5, Issue 01 (JAN-FEB 2020) www.jst.org.in DOI: https://doi.org/10.46243/jst.2022.v7.i02.pp172-194 v Published by: Longman Publishers www.jst.org.in P a g e 78 | 23 Fig. 14: Hyetograph, flood hydrograph and observed discharge for Upper Sarada River Basin for the storm event during 20th October– 31st October, 2013. Observations from graph in Fig. 14 are: The maximum observed discharge is 850.50 m3 /s. (i) The computed peak discharge obtained from one day UH is 911.65 m3 /s. (ii) The computed peak discharge occurred on Fifth day. (iii) The observed peak occurred on the Eighth day. (iv) The computed peak discharge exceeded the observed discharge by 61.15 m3 /s. Fig. 15: Hyetograph, flood hydrograph and observed discharge for Upper Sarada River Basin for the storm event during 11th October– 23rd October, 2014.
- 19. Journal of Science and Technology ISSN: 2456-5660 Volume 5, Issue 01 (JAN-FEB 2020) www.jst.org.in DOI: https://doi.org/10.46243/jst.2022.v7.i02.pp 61-83 Published by: Longman Publishers www.jst.org.in P a g e 79 | 23 Observations from graph in Fig. 15 are: (i) The maximum observed discharge is 767.85 m3 /s. (ii) The computed peak discharge obtained from one day UH is 1295.53 m3 /s. (iii) The computed peak discharge occurred on Fourth day. (iv) The observed peak occurred on the Third day. (v) The computed peak discharge exceeded the observed discharge by 527.68 m3 /s. Fig. 16: Hyetograph, flood hydrograph and observed discharge for Upper Sarada River Basin for the storm event during 18th September– 28th September, 2016. Observations from graph in Fig. 16 are: (i) The maximum observed discharge is 487.45 m3 /s. (ii) The computed peak discharge obtained from one day UH is 527.49 m3 /s. (iii) The computed peak discharge occurred on Sixth day. (iv) The observed peak occurred on the Ninth day. (v) The computed peak discharge exceeded the observed discharge by 40.04 m3 /s.
- 20. Journal of Science and Technology ISSN: 2456-5660 Volume 5, Issue 01 (JAN-FEB 2020) www.jst.org.in DOI: https://doi.org/10.46243/jst.2022.v7.i02.pp172-194 v Published by: Longman Publishers www.jst.org.in P a g e 80 | 23 Fig.17: Hyetograph, flood hydrograph and observed discharge for Upper Sarada River Basin for the storm event during 29th September– 11th October, 2017. Observations from graph in Fig.17 are: (i) The maximum observed discharge is 257.54 m3 /s. (ii) The computed peak discharge obtained from one day UH is 345.40 m3 /s. (iii) The computed peak discharge occurred on Ninth day. (iv) The observed peak occurred on the Same day. (v) The computed peak discharge exceeded the observed discharge by 87.87 m3 /s. Table 4: Comparison of observed and computed peak flood discharges in the Upper Sarada River Basin Period Peak Flood Discharges Observed (cumecs) Computed(One Day UH in cumecs) 03rd Oct to 13th Oct 1992 499.70 517.95 06th Oct to 19th Oct1995 571.10 603.35 09th Oct to 20th Oct1998 887.00 955.67 12th Oct to 24th Oct 2005 572.67 662.37 20th Oct to 31st Oct 2013 850.50 911.65 11th Oct to 23rd Oct 2014 767.85 1295.53 18th Sep to 28th Sep 2016 487.45 527.49 29th Sep to 11th Oct 2017 257.54 345.40 The flood estimates obtained from unit hydrograph for selected storm events are found to higher than the observed values and it can be concluded that it may be due to improper
- 21. Journal of Science and Technology ISSN: 2456-5660 Volume 5, Issue 01 (JAN-FEB 2020) www.jst.org.in DOI: https://doi.org/10.46243/jst.2022.v7.i02.pp 61-83 Published by: Longman Publishers www.jst.org.in P a g e 81 | 23 infiltration values which are randomly assumed for the spatially varying rainfall and uniform intensity and are not valid for these storms CONCLUSION The conclusions drawn from the above study are presented as follows: The drainage network map with threshold value 500 is found more relevant with original drainage map obtained from 1:50,000 SOI map in terms of the number of stream and lengths of streams of each order. The flood estimates made for different events of consecutive rainy days in the study area using the peakest flood unit hydrograph are validated with the observed discharges recorded by CWC. It can be concluded that the flood estimates are in a close agreement with the observed values except in some cases which may be due to the reason that assumed rainfall duration (24 hours) and uniform intensity are not valid for these storms. The effect of the three reservoirs built across the Sarada River, namely Raiwada, Konam & Pedderu are responsible for the flood estimate to be higher than the observed values which need to be studied further. REFERENCES 1. Agarwal, K. K., Prakash, C., Ali, S. N., and Jahan, N. 2012. Morphometric analysis of the Ladhiya and Lohawati river basins, Kumaun Lesser Himalaya, India. Zeitschrift Fur Geomorphologie, 56(2), 201–224. https://doi.org/10.1127/0372-8854/2012/0067. 2. Aher, P D; Adinarayana, J; Gorantiwar, S. 2014. Quantification of morphometric characterisation and prioritisation for management in semi-arid tropics of India: a remote sensing and GIS approach. Jour. Hydrol. 511, 850-860. . https://doi.org/10.1016/j.jhydrol.2014.02.028. 3. Albishi, M., Bahrawi, J; Elfeki, A. 2016. 7 th International Conference on Water Resources and Arid Environments. (ICWRAE7). 621-628. 4. Arnold, J.G; Srinivasan, R; Muttiah, R.S; Williams, J.R. 1998. Large area hydrologic modelling and assessment - Part 1: Model development. J. Am. Water Resour. Assoc. 34 (1). 73 -89.https://doi.org/10.1111/j.1752-1688.1998.tb05961.x 5. Berihun, M. L., Tsunekawa, A., Haregeweyn, N., Meshesha, D. T., Adgo, E., Tsubo, M., Masunaga, T., Fenta, A. A., Sultan, D., Yibeltal, M., and Ebabu, K. 2019.Hydrological responses to land use/land cover change and climate variability in contrasting agro-ecological environments of the Upper Blue Nile basin, Ethiopia. Science of the total environment, 689,347-365.
- 22. Journal of Science and Technology ISSN: 2456-5660 Volume 5, Issue 01 (JAN-FEB 2020) www.jst.org.in DOI: https://doi.org/10.46243/jst.2022.v7.i02.pp172-194 v Published by: Longman Publishers www.jst.org.in P a g e 82 | 23 6. Debala Devi, C., and Usha Anandhi, D. 2009. Assessment of Water Quality for Aquaculture-A Case Study of Madhavara Lake in Bangalore. Nature Environment and Pollution Technology An International Quarterly Scientific Journal. 8 (4) 755-760. 7. Desta, Y., Goitom, H., and Aregay, G. 2019. Investigation of runoff response to land use/land cover change on the case of Aynalem catchment, North of Ethiopia. Journal of African Earth Sciences, 153(March), 130–143 8. Elmoustafa, A. M., and Mohamed, M. M. 2013. Flash Flood Risk Assessment Using Morphological Parameters in Sinai Peninsula. Open Journal of Modern Hydrology, 03(03), 122–129 9. Gebremeskel, S., Liu, Y. B., and De Smedt, F. 2002. GIS based distributed modeling for flood estimation.Nature Environment and Pollution Technology An International Quarterly Scientific Journal. April, 1–4,2002 10. Kinthada, N. R. 2014. Land Use/Land Cover and NDVI Analysis for Monitoring the Health of Micro-watersheds of Sarada River Basin, Visakhapatnam District, India. Journal of Geology & Geosciences, 03(02), 146 11. Lau, C. L., Smythe, L. D., Craig, S. B., and Weinstein, P. 2010. Climate change, flooding, urbanisation and leptospirosis: fuelling the fire? Transactions of the Royal Society of Tropical Medicine and Hygiene, 104(10), 631–638 12. Maathuis, B. H. P., and Wang, L. 2006. Digital elevation model based hydro-processing. In Geocarto International (Vol. 21, Issue 1, pp. 21–26). Geocarto International Centre 13. Maddamsetty, R., Praveen, T. V., Rao, S. S., and Manjulavani, K. 2010. Tehri dam-breach versus monsoon flood routing in the ganga river system. ISH Journal of Hydraulic Engineering, 16(1), 109–131 14. Moore, I. D., Grayson, R. B., and Ladson, A. R. 1991. Digital terrain modelling: A review of hydrological, geomorphological, and biological applications. Hydrological Processes, 5(1), 3–30. 15. Noto, L. V., and La Loggia, G. 2007. Derivation of a Distributed Unit Hydrograph Integrating GIS and Remote Sensing. Journal of Hydrologic Engineering, 12(6), 639–650 16. Patel, P. P., and Sarkar, A. 2010. Terrain characterization using SRTM data. Journal of the Indian Society of Remote Sensing, 38(1), 11–24
- 23. Journal of Science and Technology ISSN: 2456-5660 Volume 5, Issue 01 (JAN-FEB 2020) www.jst.org.in DOI: https://doi.org/10.46243/jst.2022.v7.i02.pp 61-83 Published by: Longman Publishers www.jst.org.in P a g e 83 | 23 17. Sherman, L. K. 1932. Stream flow from rainfall by the unit - graph method. Engineering News Record. 108. 501 – 505 18. Singh, P., Gupta, A., and Singh, M. 2014. Hydrological inferences from watershed analysis for water resource management using remote sensing and GIS techniques. Egyptian Journal of Remote Sensing and Space Science, 17(2), 111–12 19. Sreedevi, P. D., Sreekanth, P. D., Khan, H. H., and Ahmed, S. 2013. Drainage morphometry and its influence on hydrology in an semi arid region: Using SRTM data and GIS. Environmental Earth Sciences, 70(2), 839–848 20. Snyder, F. F. 1938. Synthetic Unit Graphs. Trans. Amer. Geophy. Union. 19. 447-454. 21. Strahler, A. N. 1957.Quantitative geomorphology of drainage basin and channel networks. Handbook of Hydrology. (Ed) VenTe Chow. McGraw Hill, Section 4-11 22. Vijay P. Singh. 1988. Singh, V. P., and Scarlatos, P. D. 1988. Analysis of gradual earth-dam failure. Journal of hydraulic engineering, 114(1), 21-42. 114(1), 21–42. 23. Xiong, Y. 2011. A Dam Break Analysis Using HEC-RAS. Journal of Water Resource and Protection, 03(06), 370–379 24. Zhu, C. and Hao, W.2014.Hydrodynamics and Contaminant Transportation Development in Vegetated Open Channel. Nature, Environment and Pollution Technology, An International Quarterly Scientific Journal.13, 119-124.