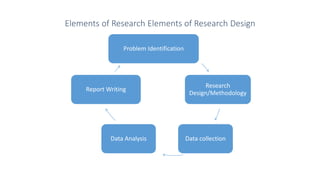
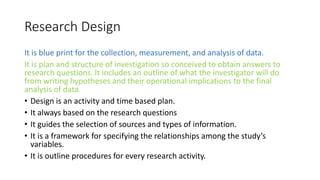
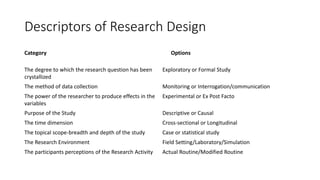
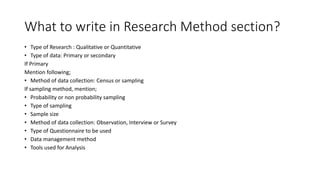
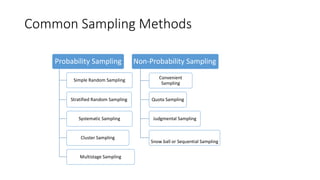
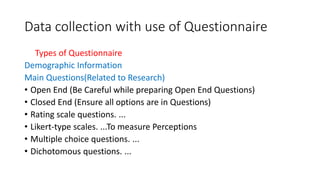
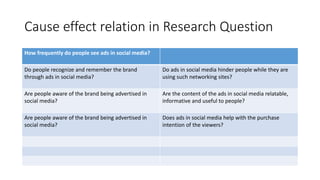
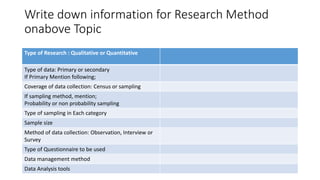
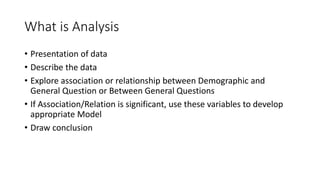
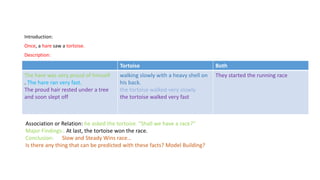
Basics of Research Process, Questionnaire Construction
Elements of Research Elements of Research Design
Problem Identification
Research
Design/Methodology
Data collectionData Analysis
Report Writing
Research Design
It is blue print for the collection, measurement, and analysis of data.
It is plan and structure of investigation so conceived to obtain answers to
research questions. It includes an outline of what the investigator will do
from writing hypotheses and their operational implications to the final
analysis of data.
• Design is an activity and time based plan.
• It always based on the research questions
• It guides the selection of sources and types of information.
• It is a framework for specifying the relationships among the study’s
variables.
• It is outline procedures for every research activity.
Descriptors of Research Design
Category optOptions
The degree to which the research question has been
crystallized
Exploratory or Formal Study
The method of data collection Monitoring or Interrogation/communication
The power of the researcher to produce effects in the
variables
Experimental or Ex Post Facto
Purpose of the Study Descriptive or Causal
The time dimension Cross-sectional or Longitudinal
The topical scope-breadth and depth of the study Case or statistical study
The Research Environment Field Setting/Laboratory/Simulation
The participants perceptions of the Research Activity Actual Routine/Modified Routine
What to write in Research Method section?
• Type of Research : Qualitative or Quantitative
• Type of data: Primary or secondary
If Primary
Mention following;
• Method of data collection: Census or sampling
If sampling method, mention;
• Probability or non probability sampling
• Type of sampling
• Sample size
• Method of data collection: Observation, Interview or Survey
• Type of Questionnaire to be used
• Data management method
• Tools used for Analysis
Common Sampling Methods
Probability Sampling
Simple Random Sampling
Stratified Random Sampling
Systematic Sampling
Cluster Sampling
Multistage Sampling
Non-Probability Sampling
Convenient
Sampling
Quota Sampling
Judgmental Sampling
Snow ball or Sequential Sampling
Data collection with use of Questionnaire
Types of Questionnaire
Demographic Information
Main Questions(Related to Research)
• Open End (Be Careful while preparing Open End Questions)
• Closed End (Ensure all options are in Questions)
• Rating scale questions. ...
• Likert-type scales. ...To measure Perceptions
• Multiple choice questions. ...
• Dichotomous questions. ...
Research Design -----Research Method
ADVERTISING THROUGH SOCIAL MEDIA IN KATHMANDU VALLEY
Research Questions
• How frequently do people see ads in social media?
• Do people recognize and remember the brand through ads in social media?
• Are people aware of the brand being advertised in social media?
• Does ads in social media help with the purchase intention of the viewers?
• Do ads in social media hinder people while they are using such networking
sites?
• Are the content of the ads in social media relatable, informative and useful
to people?
• How often do people visit the advertised products page?
Cause effect relation in Research Question
How frequently do people see ads in social media?
Do people recognize and remember the brand
through ads in social media?
Do ads in social media hinder people while they are
using such networking sites?
Are people aware of the brand being advertised in
social media?
Are the content of the ads in social media relatable,
informative and useful to people?
Are people aware of the brand being advertised in
social media?
Does ads in social media help with the purchase
intention of the viewers?
Write down information for Research Method
onabove Topic
Type of Research : Qualitative or Quantitative
Type of data: Primary or secondary
If Primary Mention following;
Coverage of data collection: Census or sampling
If sampling method, mention;
Probability or non probability sampling
Type of sampling in Each category
Sample size
Method of data collection: Observation, Interview or
Survey
Type of Questionnaire to be used
Data management method
Data Analysis tools
What is Analysis
• Presentation of data
• Describe the data
• Explore association or relationship between Demographic and
General Question or Between General Questions
• If Association/Relation is significant, use these variables to develop
appropriate Model
• Draw conclusion
story of The Hare and The Tortoise.
Once, a hare saw a tortoise walking slowly with a heavy shell on his back. The hare was very proud of himself and he asked
the tortoise. “Shall we have a race?"
The tortoise agreed. They started the running race. The hare ran very fast. But the tortoise walked very slowly. The proud
hair rested under a tree and soon slept off. But the tortoise walked very fast, slowly and steadily and reached the goal. At
last, the tortoise won the race.
Moral : Pride goes before a fall.
story of The Hare and The Tortoise.
Description
Once, a hare saw a tortoise walking slowly with a heavy shell on his back. The hare was very proud of himself and he asked the
tortoise. “Shall we have a race?"
The tortoise agreed. They started the running race. The hare ran very fast. But the tortoise walked very slowly. The proud hair rested
under a tree and soon slept off. But the tortoise walked very fast, slowly and steadily and reached the goal. At last, the tortoise won
the race.
Moral : Slow and Steady Wins race…
Introduction:
Once, a hare saw a tortoise.
Description:
Tortoise Both
The hare was very proud of himself .
. The hare ran very fast.
The proud hair rested under a tree
and soon slept off
walking slowly with a heavy shell on
his back.
the tortoise walked very slowly.
the tortoise walked very fast
They started the running race
Association or Relation: he asked the tortoise. “Shall we have a race?“
Major Findings:. At last, the tortoise won the race.
Conclusion: Slow and Steady Wins race…
Is there any thing that can be predicted with these facts? Model Building?
Introducing data:
Presentation
Textual Presentation
Tabular Presentation
Diagrammatic Presentation
Graphical Presentation
Describing Data
• Find Appropriate Average/Central Tendency Value
• Find Appropriate Dispersion
• Find Skewness/Kurtosis
Do Hypothesis testing for checking significance Differences.
ANOVA Vs t-test
Exploring Association or Relationship
• Association for Nominal via Chi-Square test
• Correlation for Scale or Ordinal
• How to develop Linear Models?
Thanks for Patience

Research methods and data analysis

  • 1.
    Basics of ResearchProcess, Questionnaire Construction
  • 2.
    Elements of ResearchElements of Research Design Problem Identification Research Design/Methodology Data collectionData Analysis Report Writing
  • 3.
    Research Design It isblue print for the collection, measurement, and analysis of data. It is plan and structure of investigation so conceived to obtain answers to research questions. It includes an outline of what the investigator will do from writing hypotheses and their operational implications to the final analysis of data. • Design is an activity and time based plan. • It always based on the research questions • It guides the selection of sources and types of information. • It is a framework for specifying the relationships among the study’s variables. • It is outline procedures for every research activity.
  • 4.
    Descriptors of ResearchDesign Category optOptions The degree to which the research question has been crystallized Exploratory or Formal Study The method of data collection Monitoring or Interrogation/communication The power of the researcher to produce effects in the variables Experimental or Ex Post Facto Purpose of the Study Descriptive or Causal The time dimension Cross-sectional or Longitudinal The topical scope-breadth and depth of the study Case or statistical study The Research Environment Field Setting/Laboratory/Simulation The participants perceptions of the Research Activity Actual Routine/Modified Routine
  • 5.
    What to writein Research Method section? • Type of Research : Qualitative or Quantitative • Type of data: Primary or secondary If Primary Mention following; • Method of data collection: Census or sampling If sampling method, mention; • Probability or non probability sampling • Type of sampling • Sample size • Method of data collection: Observation, Interview or Survey • Type of Questionnaire to be used • Data management method • Tools used for Analysis
  • 6.
    Common Sampling Methods ProbabilitySampling Simple Random Sampling Stratified Random Sampling Systematic Sampling Cluster Sampling Multistage Sampling Non-Probability Sampling Convenient Sampling Quota Sampling Judgmental Sampling Snow ball or Sequential Sampling
  • 7.
    Data collection withuse of Questionnaire Types of Questionnaire Demographic Information Main Questions(Related to Research) • Open End (Be Careful while preparing Open End Questions) • Closed End (Ensure all options are in Questions) • Rating scale questions. ... • Likert-type scales. ...To measure Perceptions • Multiple choice questions. ... • Dichotomous questions. ...
  • 8.
  • 9.
    ADVERTISING THROUGH SOCIALMEDIA IN KATHMANDU VALLEY Research Questions • How frequently do people see ads in social media? • Do people recognize and remember the brand through ads in social media? • Are people aware of the brand being advertised in social media? • Does ads in social media help with the purchase intention of the viewers? • Do ads in social media hinder people while they are using such networking sites? • Are the content of the ads in social media relatable, informative and useful to people? • How often do people visit the advertised products page?
  • 10.
    Cause effect relationin Research Question How frequently do people see ads in social media? Do people recognize and remember the brand through ads in social media? Do ads in social media hinder people while they are using such networking sites? Are people aware of the brand being advertised in social media? Are the content of the ads in social media relatable, informative and useful to people? Are people aware of the brand being advertised in social media? Does ads in social media help with the purchase intention of the viewers?
  • 11.
    Write down informationfor Research Method onabove Topic Type of Research : Qualitative or Quantitative Type of data: Primary or secondary If Primary Mention following; Coverage of data collection: Census or sampling If sampling method, mention; Probability or non probability sampling Type of sampling in Each category Sample size Method of data collection: Observation, Interview or Survey Type of Questionnaire to be used Data management method Data Analysis tools
  • 12.
    What is Analysis •Presentation of data • Describe the data • Explore association or relationship between Demographic and General Question or Between General Questions • If Association/Relation is significant, use these variables to develop appropriate Model • Draw conclusion
  • 13.
    story of TheHare and The Tortoise. Once, a hare saw a tortoise walking slowly with a heavy shell on his back. The hare was very proud of himself and he asked the tortoise. “Shall we have a race?" The tortoise agreed. They started the running race. The hare ran very fast. But the tortoise walked very slowly. The proud hair rested under a tree and soon slept off. But the tortoise walked very fast, slowly and steadily and reached the goal. At last, the tortoise won the race. Moral : Pride goes before a fall.
  • 14.
    story of TheHare and The Tortoise. Description Once, a hare saw a tortoise walking slowly with a heavy shell on his back. The hare was very proud of himself and he asked the tortoise. “Shall we have a race?" The tortoise agreed. They started the running race. The hare ran very fast. But the tortoise walked very slowly. The proud hair rested under a tree and soon slept off. But the tortoise walked very fast, slowly and steadily and reached the goal. At last, the tortoise won the race. Moral : Slow and Steady Wins race…
  • 15.
    Introduction: Once, a haresaw a tortoise. Description: Tortoise Both The hare was very proud of himself . . The hare ran very fast. The proud hair rested under a tree and soon slept off walking slowly with a heavy shell on his back. the tortoise walked very slowly. the tortoise walked very fast They started the running race Association or Relation: he asked the tortoise. “Shall we have a race?“ Major Findings:. At last, the tortoise won the race. Conclusion: Slow and Steady Wins race… Is there any thing that can be predicted with these facts? Model Building?
  • 16.
    Introducing data: Presentation Textual Presentation TabularPresentation Diagrammatic Presentation Graphical Presentation
  • 17.
    Describing Data • FindAppropriate Average/Central Tendency Value • Find Appropriate Dispersion • Find Skewness/Kurtosis Do Hypothesis testing for checking significance Differences. ANOVA Vs t-test
  • 18.
    Exploring Association orRelationship • Association for Nominal via Chi-Square test • Correlation for Scale or Ordinal
  • 19.
    • How todevelop Linear Models?
  • 20.