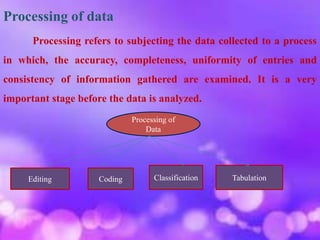
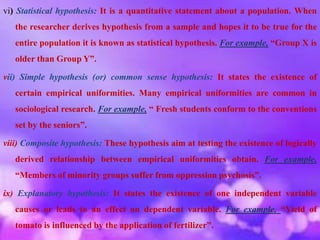
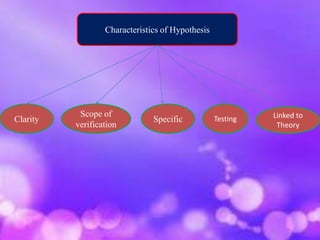
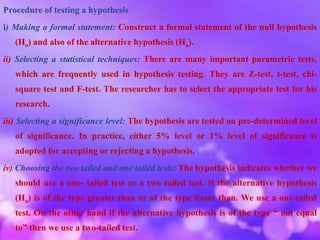
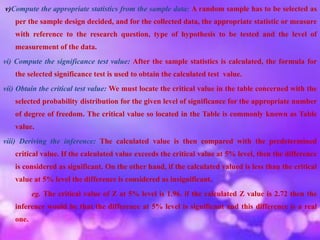
This document discusses research methodology and processing of data. It covers editing, coding, classification, and tabulation as important steps in processing data collected during research. Editing involves correcting errors and omissions in the data. Coding assigns standardized codes to responses for efficient analysis. Classification groups the data based on common characteristics. Tabulation arranges the classified data in an organized table for analysis. The document also defines hypothesis and discusses types of hypotheses, characteristics of a good hypothesis, and the procedure for testing hypotheses using statistical techniques. Finally, it defines interpretation as drawing inferences from analyzed data and discusses techniques for proper interpretation.
A Simple Guide to the Item Response Theory (IRT) and Rasch ModelingOpenThink Labs
Â
This document, which is a practical introduction to Item Response Theory (IRT) and Rasch modeling, is
composed of five parts:
I. Item calibration and ability estimation
II. Item Characteristic Curve in one to three parameter models
III. Item Information Function and Test Information Function
IV. Item-Person Map
V. Misfit
Introduction to unidimensional item response modelSumit Das
Â
Item response theory has become an important technique in the field of psychology and education. This slides gives a brief introduction to unidimensional item response models.
Bus 308 Effective Communication - snaptutorial.comHarrisGeorg10
Â
BUS 308 Week 2 Problem Set
BUS 308 Week 3 Problem Set (Anova)
BUS 308 Week 4 Problem Set (Regression and Correlation)
BUS 308 Week 5 Final Paper Statistics Reflection (2 Papers)
BUS 308 Week 1 DQ 1
BUS 308 Week 1 DQ 2
BUS 308 Week 2 DQ 1
BUS 308 Week 2 DQ 2
BUS 308 Week 3 DQ 1
BUS 308 Week 3 DQ 2
Exploratory data analysis data visualization:
Exploratory Data Analysis (EDA) is an approach/philosophy for data analysis that employs a variety of techniques (mostly graphical) to
Maximize insight into a data set.
Uncover underlying structure.
Extract important variables.
Detect outliers and anomalies.
Test underlying assumptions.
Develop parsimonious models.
Determine optimal factor settings
Evaluation metric plays a critical role in achieving the optimal classifier during the classification training.
Thus, a selection of suitable evaluation metric is an important key for discriminating and obtaining the
optimal classifier. This paper systematically reviewed the related evaluation metrics that are specifically
designed as a discriminator for optimizing generative classifier. Generally, many generative classifiers
employ accuracy as a measure to discriminate the optimal solution during the classification training.
However, the accuracy has several weaknesses which are less distinctiveness, less discriminability, less
informativeness and bias to majority class data. This paper also briefly discusses other metrics that are
specifically designed for discriminating the optimal solution. The shortcomings of these alternative metrics
are also discussed. Finally, this paper suggests five important aspects that must be taken into consideration
in constructing a new discriminator metric.
This is the first of a series of powerpoints presented at a CAT/IRT workshop at the University of Brasilia in 2012. It provides an introduction to item response theory (IRT), tying it to classical test theory and describing some of the major IRT models. Learn more at www.assess.com.
MULTI-PARAMETER BASED PERFORMANCE EVALUATION OF CLASSIFICATION ALGORITHMSijcsit
Â
Diabetes disease is amongst the most common disease in India. It affects patientâs health and also leads to
other chronic diseases. Prediction of diabetes plays a significant role in saving of life and cost. Predicting
diabetes in human body is a challenging task because it depends on several factors. Few studies have reported the performance of classification algorithms in terms of accuracy. Results in these studies are difficult and complex to understand by medical practitioner and also lack in terms of visual aids as they arepresented in pure text format. This reported survey uses ROC and PRC graphical measures toimproveunderstanding of results. A detailed parameter wise discussion of comparison is also presented which lacksin other reported surveys. Execution time, Accuracy, TP Rate, FP Rate, Precision, Recall, F Measureparameters are used for comparative analysis and Confusion Matrix is prepared for quick review of each
algorithm. Ten fold cross validation method is used for estimation of prediction model. Different sets of
classification algorithms are analyzed on diabetes dataset acquired from UCI repository
Analytical Hierarchical Process has been used as a useful methodology for multi-criteria decision making environments with substantial applications in recent years. But the weakness of the traditional AHP method lies in the use of subjective judgement based assessment and standardized scale for pairwise comparison matrix creation. The paper proposes a Condorcet Voting Theory based AHP method to solve multi criteria decision making problems where Analytical Hierarchy Process (AHP) is combined with Condorcet theory based preferential voting technique followed by a quantitative ratio method for framing the comparison matrix instead of the standard importance scale in traditional AHP approach. The consistency ratio (CR) is calculated for both the approaches to determine and compare the consistency of both the methods. The results reveal Condorcet- AHP method to be superior generating lower consistency ratio and more accurate ranking of the criterion for solving MCDM problems.
Its a fully detailed topic about Editing , Coding, Tabulation o Data in research work.
The editing , coding , tabulation of data is been explained in this ppt.
Normal Labour/ Stages of Labour/ Mechanism of LabourWasim Ak
Â
Normal labor is also termed spontaneous labor, defined as the natural physiological process through which the fetus, placenta, and membranes are expelled from the uterus through the birth canal at term (37 to 42 weeks
Biological screening of herbal drugs: Introduction and Need for
Phyto-Pharmacological Screening, New Strategies for evaluating
Natural Products, In vitro evaluation techniques for Antioxidants, Antimicrobial and Anticancer drugs. In vivo evaluation techniques
for Anti-inflammatory, Antiulcer, Anticancer, Wound healing, Antidiabetic, Hepatoprotective, Cardio protective, Diuretics and
Antifertility, Toxicity studies as per OECD guidelines
Macroeconomics- Movie Location
This will be used as part of your Personal Professional Portfolio once graded.
Objective:
Prepare a presentation or a paper using research, basic comparative analysis, data organization and application of economic information. You will make an informed assessment of an economic climate outside of the United States to accomplish an entertainment industry objective.
Model Attribute Check Company Auto PropertyCeline George
Â
In Odoo, the multi-company feature allows you to manage multiple companies within a single Odoo database instance. Each company can have its own configurations while still sharing common resources such as products, customers, and suppliers.
A workshop hosted by the South African Journal of Science aimed at postgraduate students and early career researchers with little or no experience in writing and publishing journal articles.
2. Processing of data
Processing refers to subjecting the data collected to a process
in which, the accuracy, completeness, uniformity of entries and
consistency of information gathered are examined. It is a very
important stage before the data is analyzed.
Processing of
Data
Editing Coding Classification Tabulation
3. 1. Editing â Editing means to rectify or to set to order or to correct of to
establish sequence. Once the data collection is completed, it is examined
carefully to eliminate any errors of mistakes. It is better if the data
collected is verified even before the data analysis is carried out. So, in
the editing stage mistakes and errors in the data are removed. Data
entered in the questionnaire / schedule are carefully scrutinized. Persons
with the editing responsibility should be trained and experienced in this
job.
Types of Editing
Editing is performed at two stages and depending on that it could be
of two types: Field editing and Centralized editing.
Types of Editing
Field
Editing
Centralized
Editing
4. Field editing
Field editing refers to the performance of the editing immediately in the field
where data is collected. That is, as soon as the investigator collects the data, the
data is collected. The advantage of this is to correct the data at the stage when it is
collected. The nature of editing will depend upon the method of data collection.
For example, suppose in an interview involving common public about their opinion
on the adequacy of buses in a particular route, the investigators does not raise this
questions. But he writes down the notes stating that the people are not satisfied
with the number of buses. This response is only based on the investigatorâs own
opinion and not truly reflecting the public opinion. Such type of interview notes
may be misleading. Therefore, field editing is undertaken within one or two days
of recording the information or collecting the data.
5. Centralized Editing
In this type of editing, editing is done by a person or a team after all
the recorded questionnaires / schedules are collected. So clearly, it is not carried
out on the field itself or immediately after the data are collected. In such
editing, normally the instructions regarding editing are printed and circulated
to the person or the team doing the editing. This is only to ensure that there is
uniformity in editing.
For example, the unit of data collection may indicate that monthly income
should be collected and recorded, but in the field, the investigators would have
collected annual income. Or sometimes, the answer for a particular question
would remain unfilled. Or the code letters given for specifying the answer
would have been ignored. All these corrections are carried out at one stretch in
all the questionnaires or schedules. Sometimes, the respondents may have to be
contacted for clarifying certain points.
6. 2. Coding
Coding is a practice which simplifies recording of answer. When standard
answers for a question could be indicated, each answer is assigned a code. So,
instead on writing the answer in full, the investigator simply writes the code. This
not only saves time but also helps to avoid consuming answer.
For example, suppose a computer hardware engineer is attending a fault in a
computer. The system may be out of order due to several reasons. Say, booting
failure, software corruption, improper cable link, low voltage, memory failure,
etc., the engineer suppose each one of the above causes is coded like A) for booting
failure, B) software corruption C) improper cable link D) low voltage E)memory
failure etc. then in his service report if the engineer writes the code B against the
reason for the failure, it is clearly understood. Otherwise some service engineer
would simply write system not working, which may mean several things.
7. It is advisable to use alphabets or numbers for coding, as these would be
immediately recognized by the investigator. Care should be taken to avoid mixing
alphabets and number for the same answer. Each answer should have a distinct
code.
3. Classification
Classification of data means grouping the data on the basis of some
common characteristics. In other words, when some homogeneity could be
established in the data collected, then each group with similar characteristics
should be segregated. Such arrangement of data in groups or classes is called
classification.
Data analysis becomes easy with classified data : (a) common
characteristics or attributes like sex, literacy, colour, height, weight, age, etc., (b)
geographical regions like north, south, east, west etc., (c) time oriented classification
like yearly data, monthly data, weekly data, daily data etc., (d) value based
classification in which the collected data are grouped.
8. For example, data regarding marks scored by students, the data could be
classified as students between 0-10 marks, 10-20marks, 20-30marks and so on,
⏠reply based classification like number of people who have answered âyesâ to a
question, ânoâ to a question, no opinion to a question, etc.
Once the data is classified, then the frequency of each class is computed
and entered. In this process, tally bars or tally marks are used. Tally bars refers
to small vertical line each representing an occurrence. The tally bars erected for
each class is then counted and the numbers is recorded against each class.
9. 4.Tabulation
Tabulation is the arrangement of classified data in an orderly manner.
This involves creating tables for recoding the data. The process of presenting in an
orderly manner the classified in a table is called tabulation. In other words, it is a
method of presenting the summarized data. Tabulation is very important because
i) it helps to conserve space, ii) it avoids any need for explanation iii) computation
of the data is made easier, iv)comparison of data becomes very simple, v) adequacy
or inadequacy of the data is clearly visible.
A table contains columns and rows. These columns and rows create
small boxes which are called cells. Entries made in each cell of box is understood
with the title of the column and the row. Tables are classified as a) one way table b)
two way table and c) multi â way table.
10. Testing of Hypothesis
Hypothesis means a mere assumption or some supposition
or a possibility to be proved or disproved.
Define Hypothesis
1. âA hypothesis is a statement capable of being tested and thereby
verified or rejectedâ. âRummel and Ballin.
2. âA proposition which can be put to test to determine validityâ.
- Goode and Hatt
11. Types of Hypothesis
i) Descriptive hypothesis: Descriptive hypothesis are propositions that describe the
existence, size, form or distribution of some variables. For example, âThe per
capital income of Indian is lower than that of Chineseâ.
ii) Relational hypothesis: It describe the relationship between two variables. For
example, âFamilies with higher income spend more on recreationâ
iii) Working hypothesis: The working hypothesis indicates the nature of data and
methods of analysis required for the study. Working hypothesis are subject to
modification as the investigation proceeds.
iv) Null Hypothesis: When a hypothesis is stated negatively, it is called a null
hypothesis. A null hypothesis should always be specific. The null hypothesis is the
one which one wishes to disprove. For example âAge of the respondents does not
influence their job satisfactionâ
v) Alternative hypothesis: The set of alternatives to the null hypothesis is referred to as
the alternative hypothesis. Alternative hypothesis is usually the one which one
wishes to prove. For example, âAge of the respondents influences their job
satisfactionâ.
12. vi) Statistical hypothesis: It is a quantitative statement about a population. When
the researcher derives hypothesis from a sample and hopes it to be true for the
entire population it is known as statistical hypothesis. For example, âGroup X is
older than Group Yâ.
vii) Simple hypothesis (or) common sense hypothesis: It states the existence of
certain empirical uniformities. Many empirical uniformities are common in
sociological research. For example, â Fresh students conform to the conventions
set by the seniorsâ.
viii) Composite hypothesis: These hypothesis aim at testing the existence of logically
derived relationship between empirical uniformities obtain. For example,
âMembers of minority groups suffer from oppression psychosisâ.
ix) Explanatory hypothesis: It states the existence of one independent variable
causes or leads to an effect on dependent variable. For example, âYield of
tomato is influenced by the application of fertilizerâ.
14. Procedure of testing a hypothesis
i) Making a formal statement: Construct a formal statement of the null hypothesis
(Ho) and also of the alternative hypothesis (Ha).
ii) Selecting a statistical techniques: There are many important parametric tests,
which are frequently used in hypothesis testing. They are Z-test, t-test, chi-
square test and F-test. The researcher has to select the appropriate test for his
research.
iii) Selecting a significance level: The hypothesis are tested on pre-determined level
of significance. In practice, either 5% level or 1% level of significance is
adopted for accepting or rejecting a hypothesis.
iv) Choosing the two tailed and one tailed tests: The hypothesis indicates whether we
should use a one- tailed test or a two tailed test. It the alternative hypothesis
(Ha) is of the type greater than or of the type lesser than. We use a one tailed
test. On the other hand if the alternative hypothesis is of the type â not equal
toâ then we use a two-tailed test.
15. v)Compute the appropriate statistics from the sample data: A random sample has to be selected as
per the sample design decided, and for the collected data, the appropriate statistic or measure
with reference to the research question, type of hypothesis to be tested and the level of
measurement of the data.
vi) Compute the significance test value: After the sample statistics is calculated, the formula for
the selected significance test is used to obtain the calculated test value.
vii) Obtain the critical test value: We must locate the critical value in the table concerned with the
selected probability distribution for the given level of significance for the appropriate number
of degree of freedom. The critical value so located in the Table is commonly known as Table
value.
viii) Deriving the inference: The calculated value is then compared with the predetermined
critical value. If the calculated value exceeds the critical value at 5% level, then the difference
is considered as significant. On the other hand, if the calculated valued is less than the critical
value at 5% level the difference is considered as insignificant.
eg. The critical value of Z at 5% level is 1.96. if the calculated Z value is 2.72 then the
inference would be that the difference at 5% level is significant and this difference is a real
one.
16. Interpretation
Interpretation refers to drawing inferences, generalization and results
from the collected data after the analysis. Analysis is not complete without
interpretation can not proceed without analysis. Interpretation can be
conceived of as a part of analysis. It is the task of interpreter to find out a link
or a position of the study in the whole analytical framework. It connects the
findings with the available material in a particular area of research.
Define Interpretation
â Scientific interpretation seeks for relationship between the data of a study
and between the study findings and other scientific knowledgeâ. - Jahada and
Cook.
17. Techniques of interpretation
(i) Researcher must give reasonable explanations of the relations which he has found, and
he must interpret the lines of relationship in terms of the underlying processes and
must try to find out the thread of uniformity that lies under the surface layer of his
diversified research findings.
(ii) Extraneous information, if collected during the study, must be considered while
interpreting the final results of research study, for it may prove to be a key factor in
understanding the problem under consideration.
(iii) It is advisable, before embarking upon final interpretation, to consult someone having
insight into the study and who is frank and honest and will not hesitate to point out
omissions and errors in logical argumentation. Such a consultation will result in correct
interpretation and, thus, will enhance the utility of research results.
(iv) Researcher must accomplish the task of interpretation only after considering all
relevant factors affecting the problem to avoid false generalization. He must be in no
hurry while interpreting results, for quite often the conclusions, which appear to be all
right at the beginning may not at all be accurate.