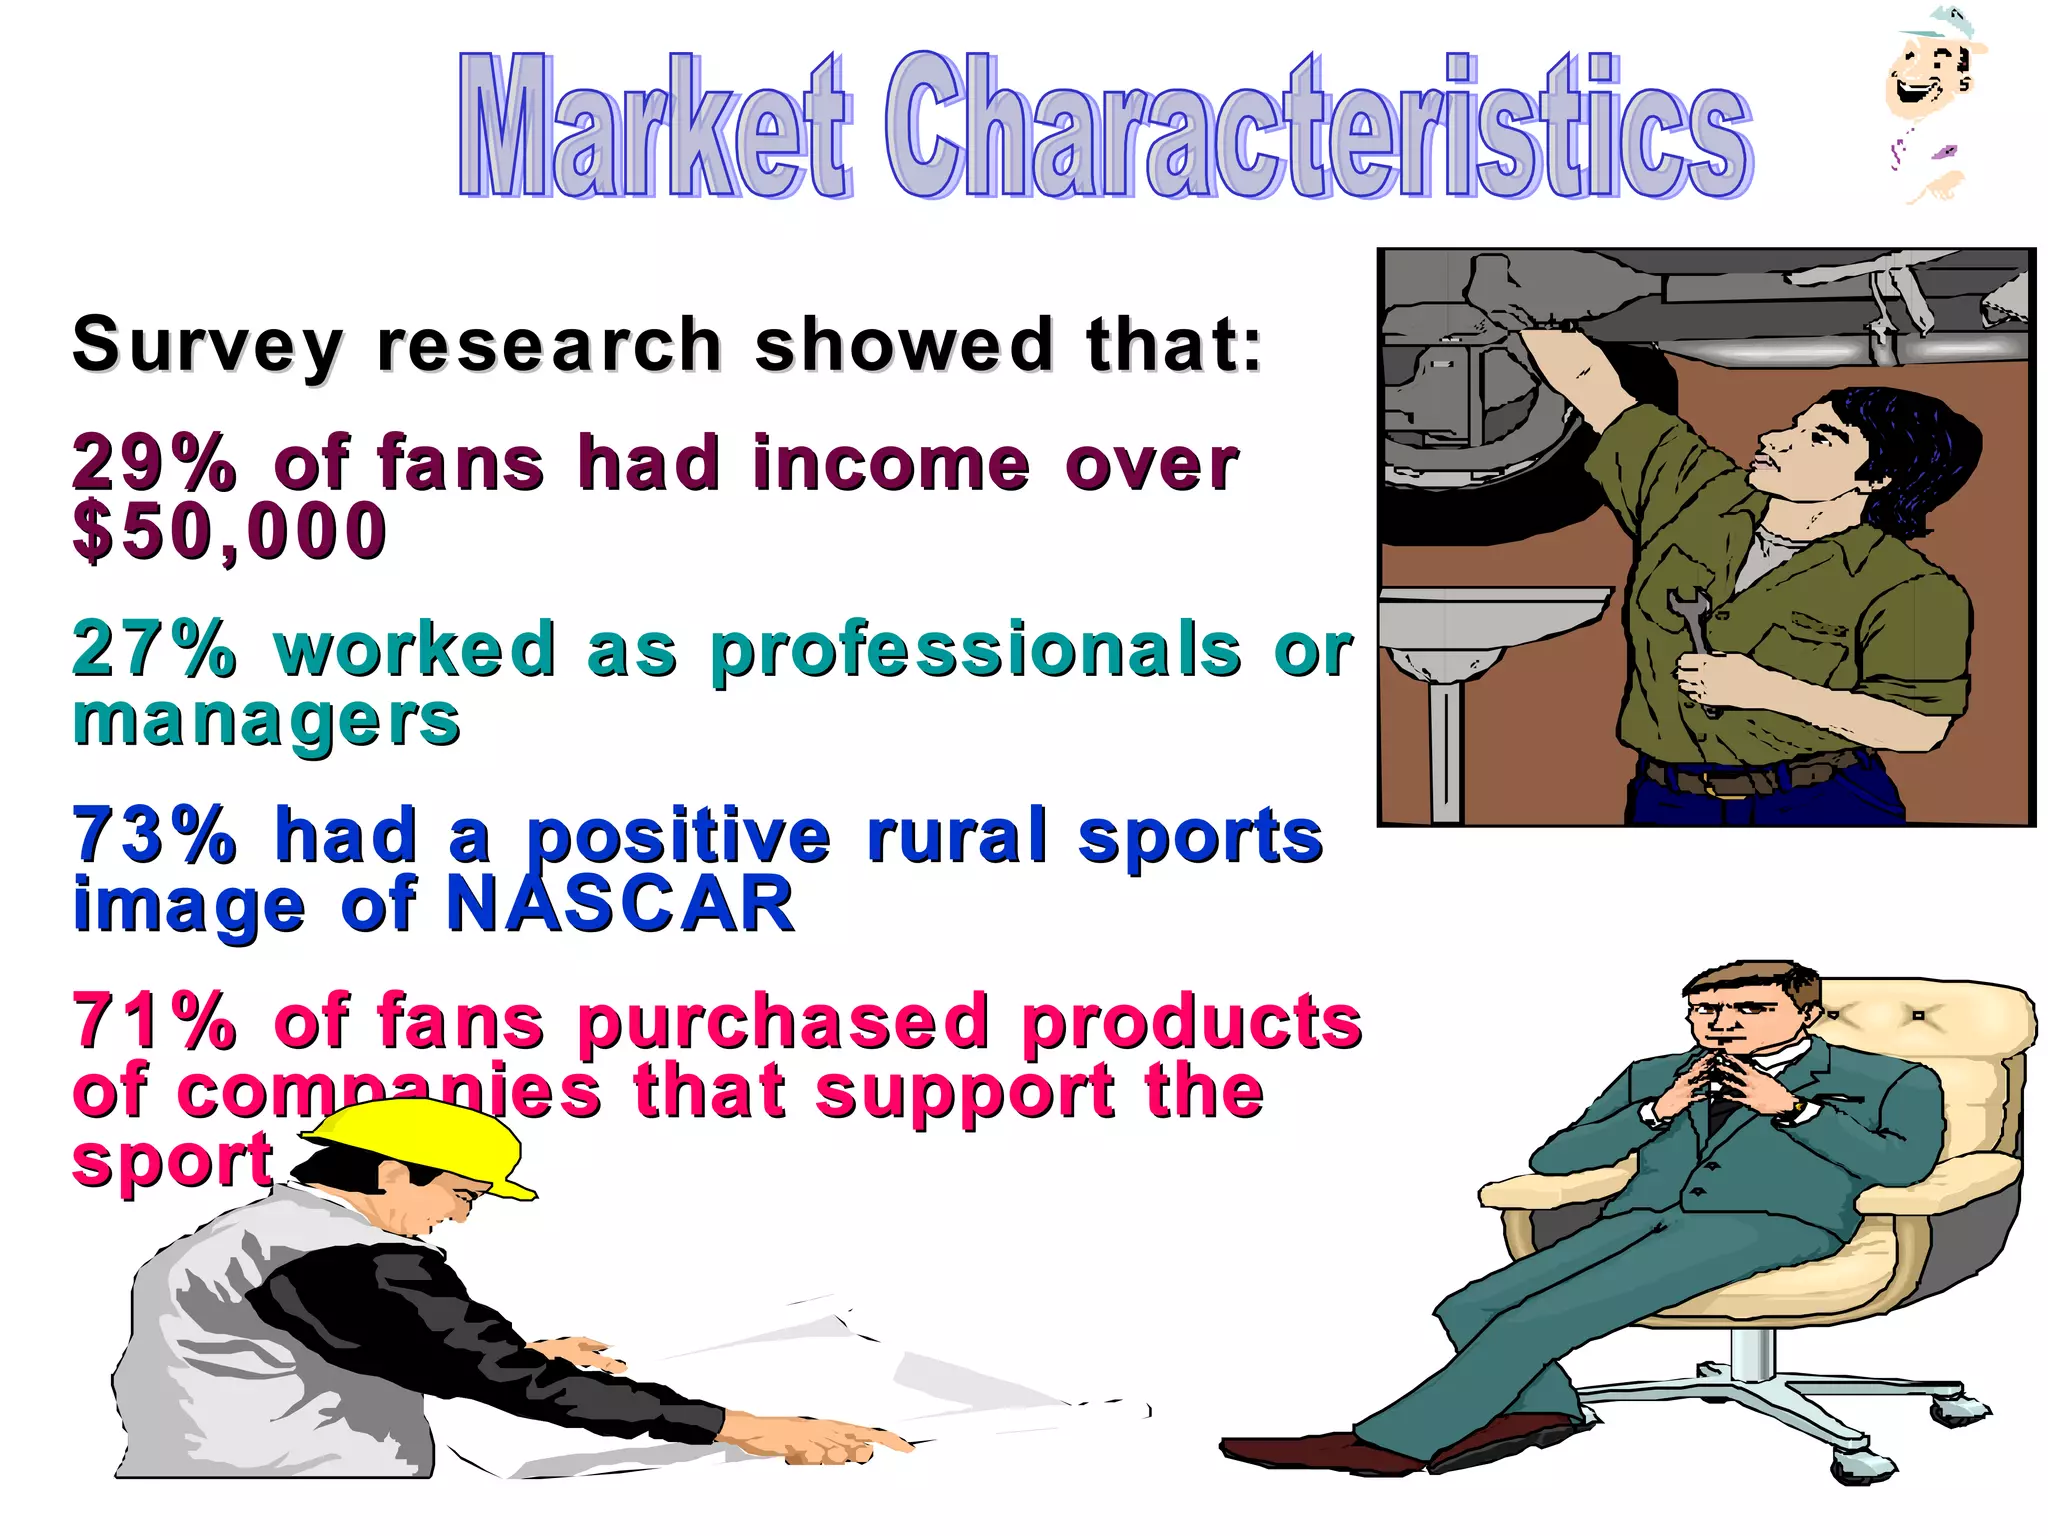
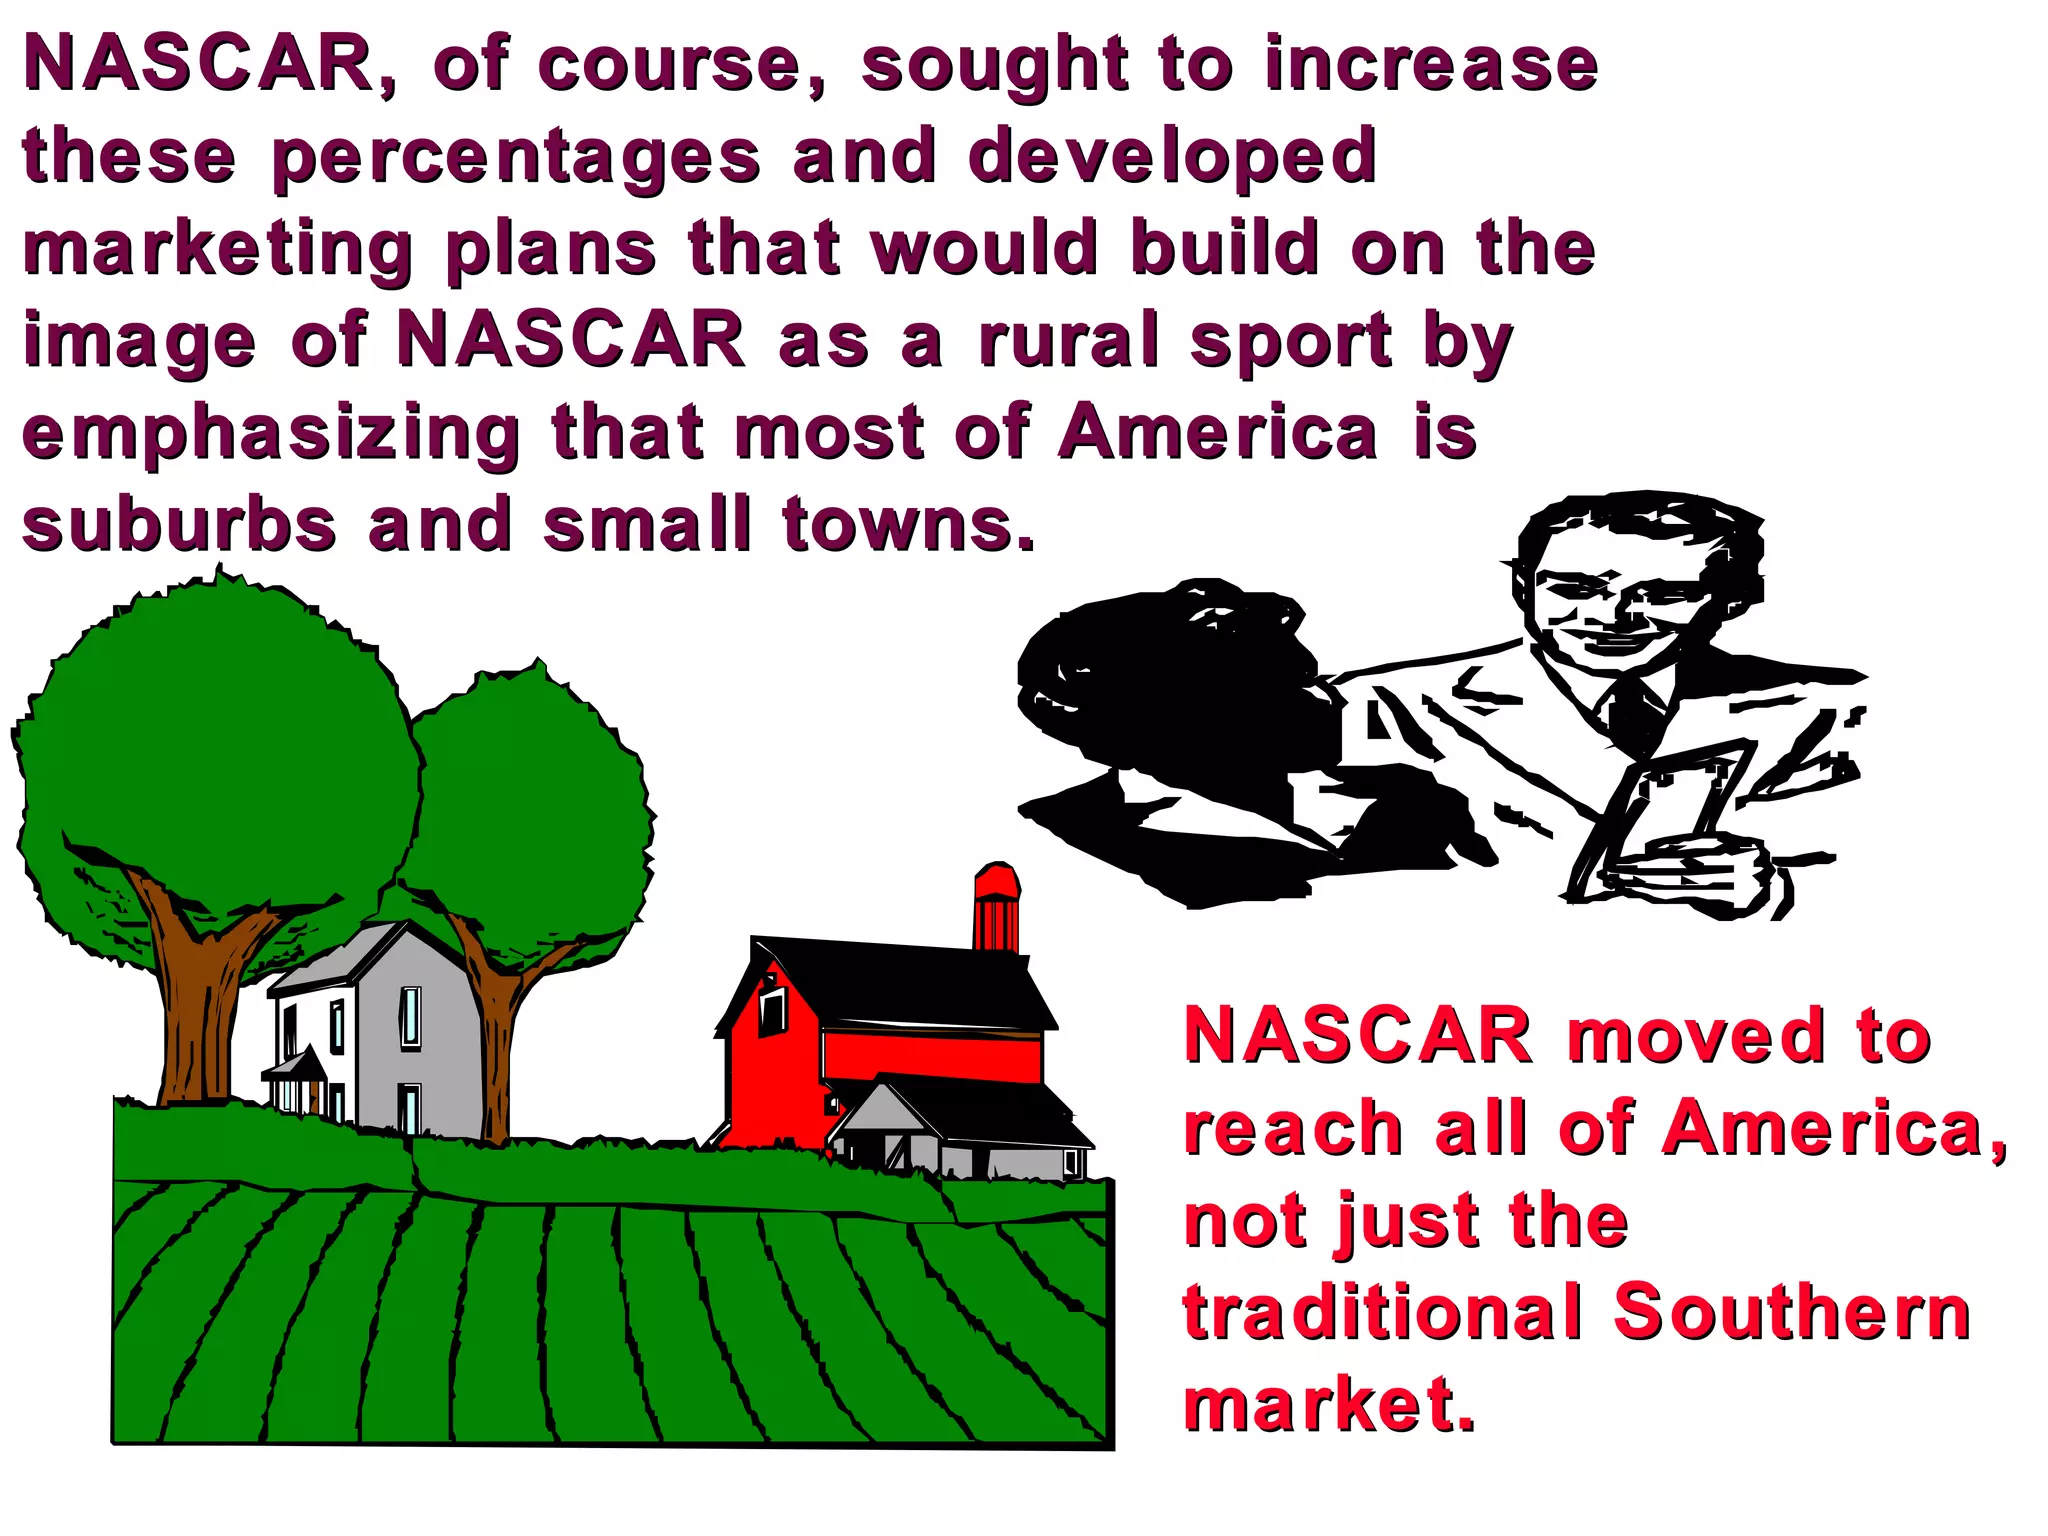
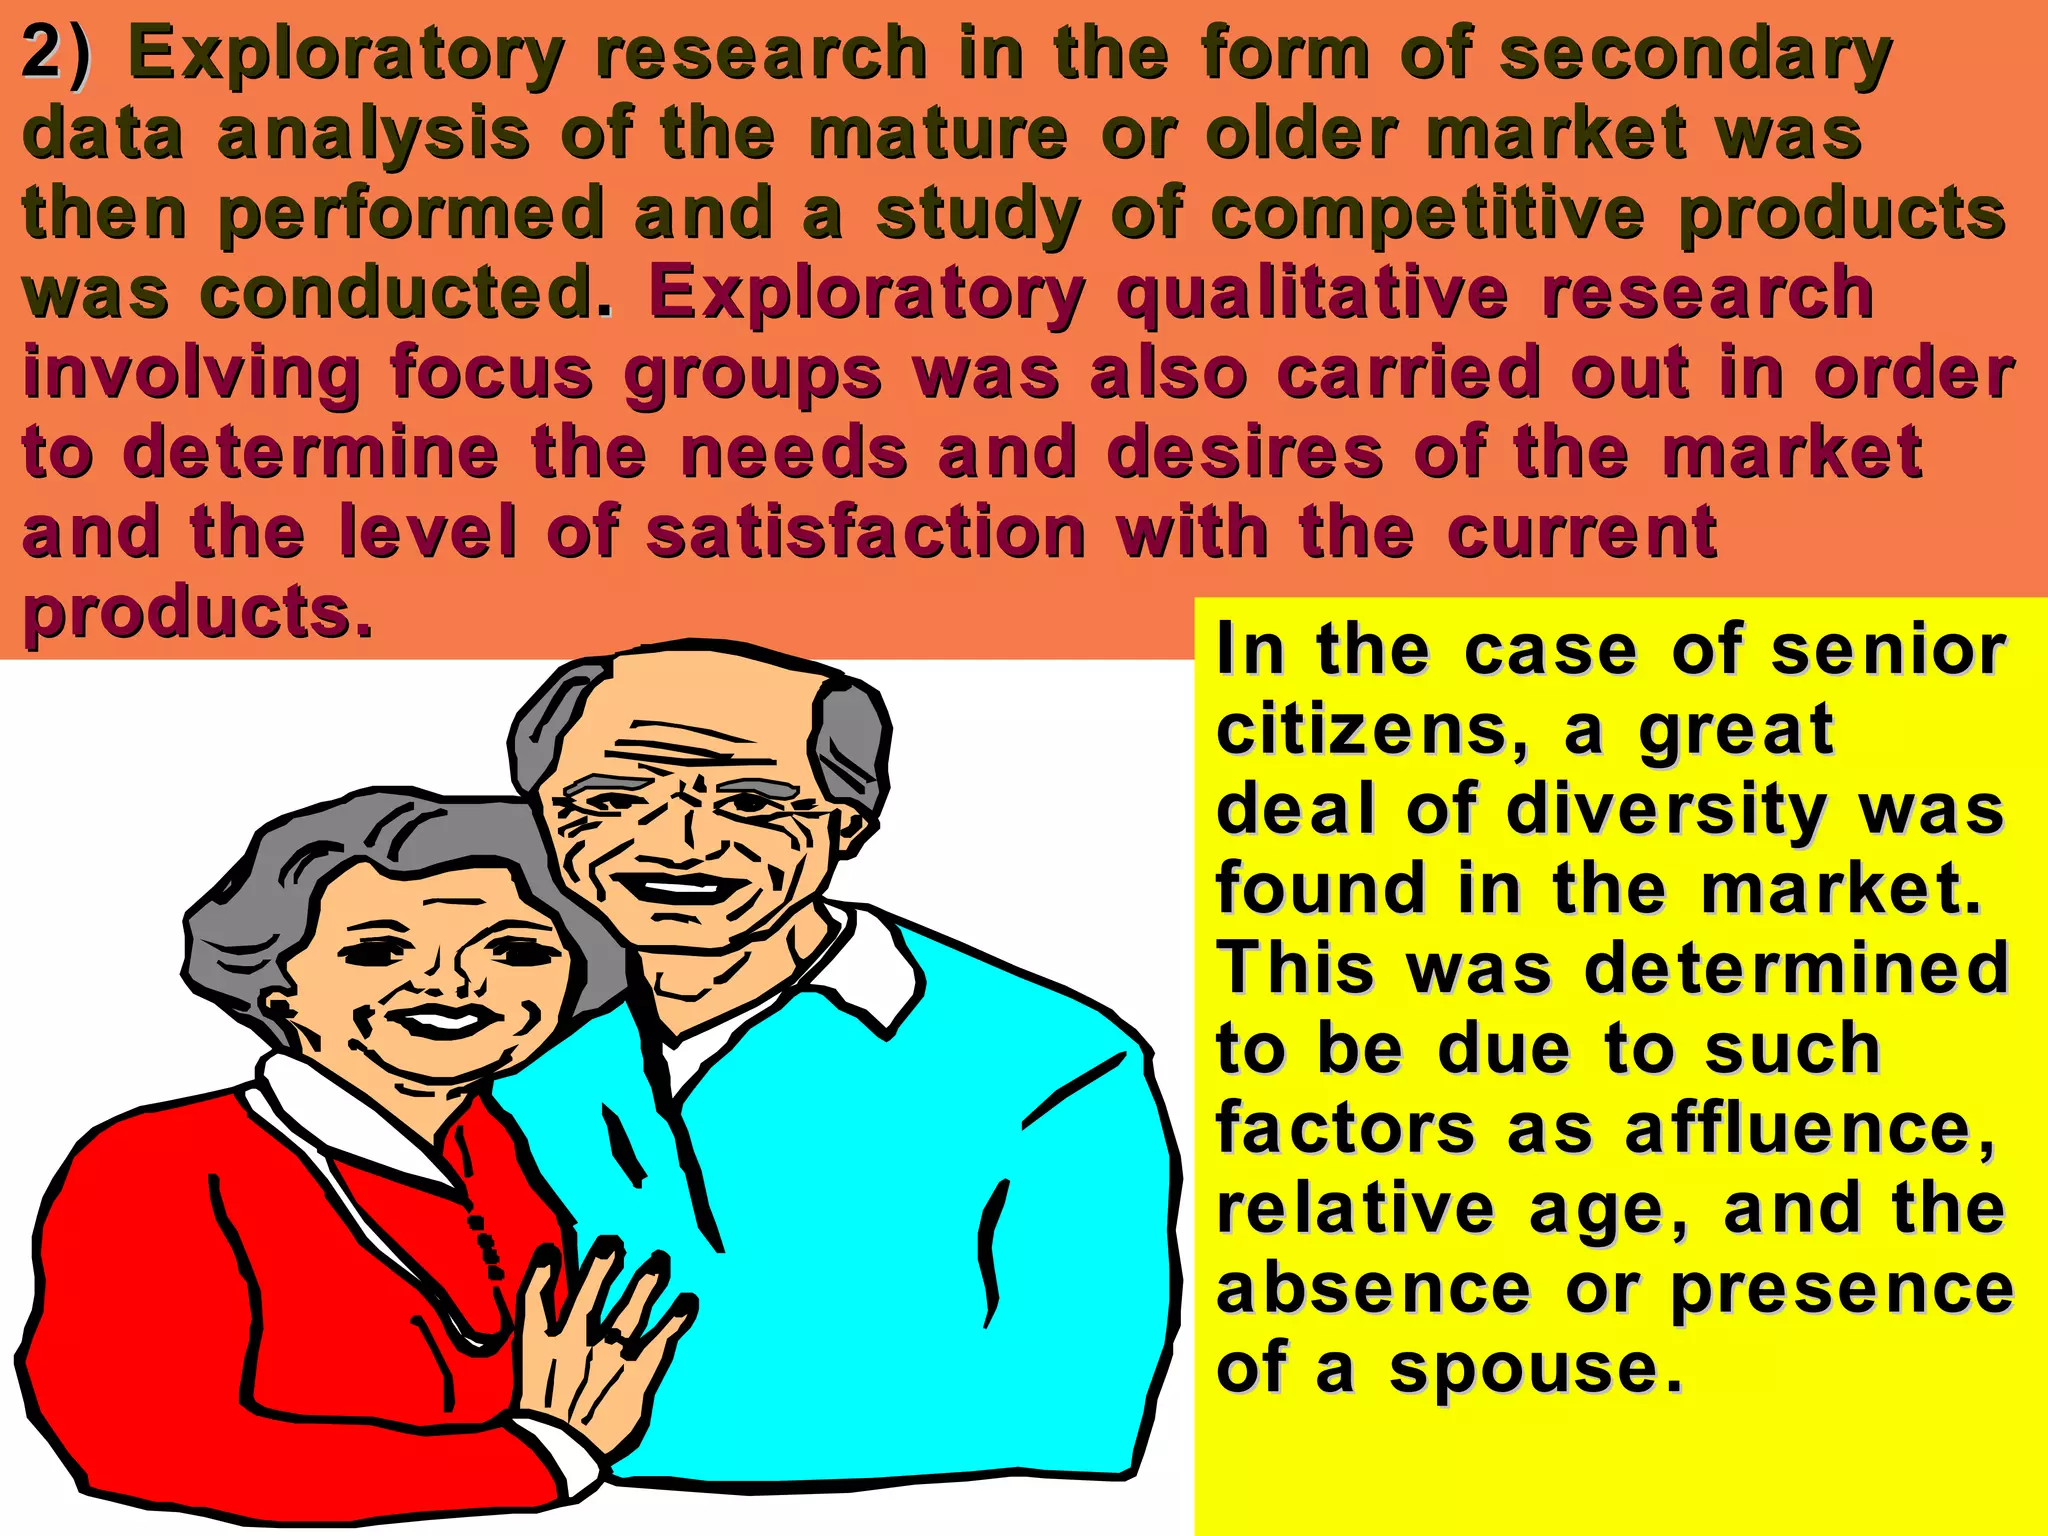
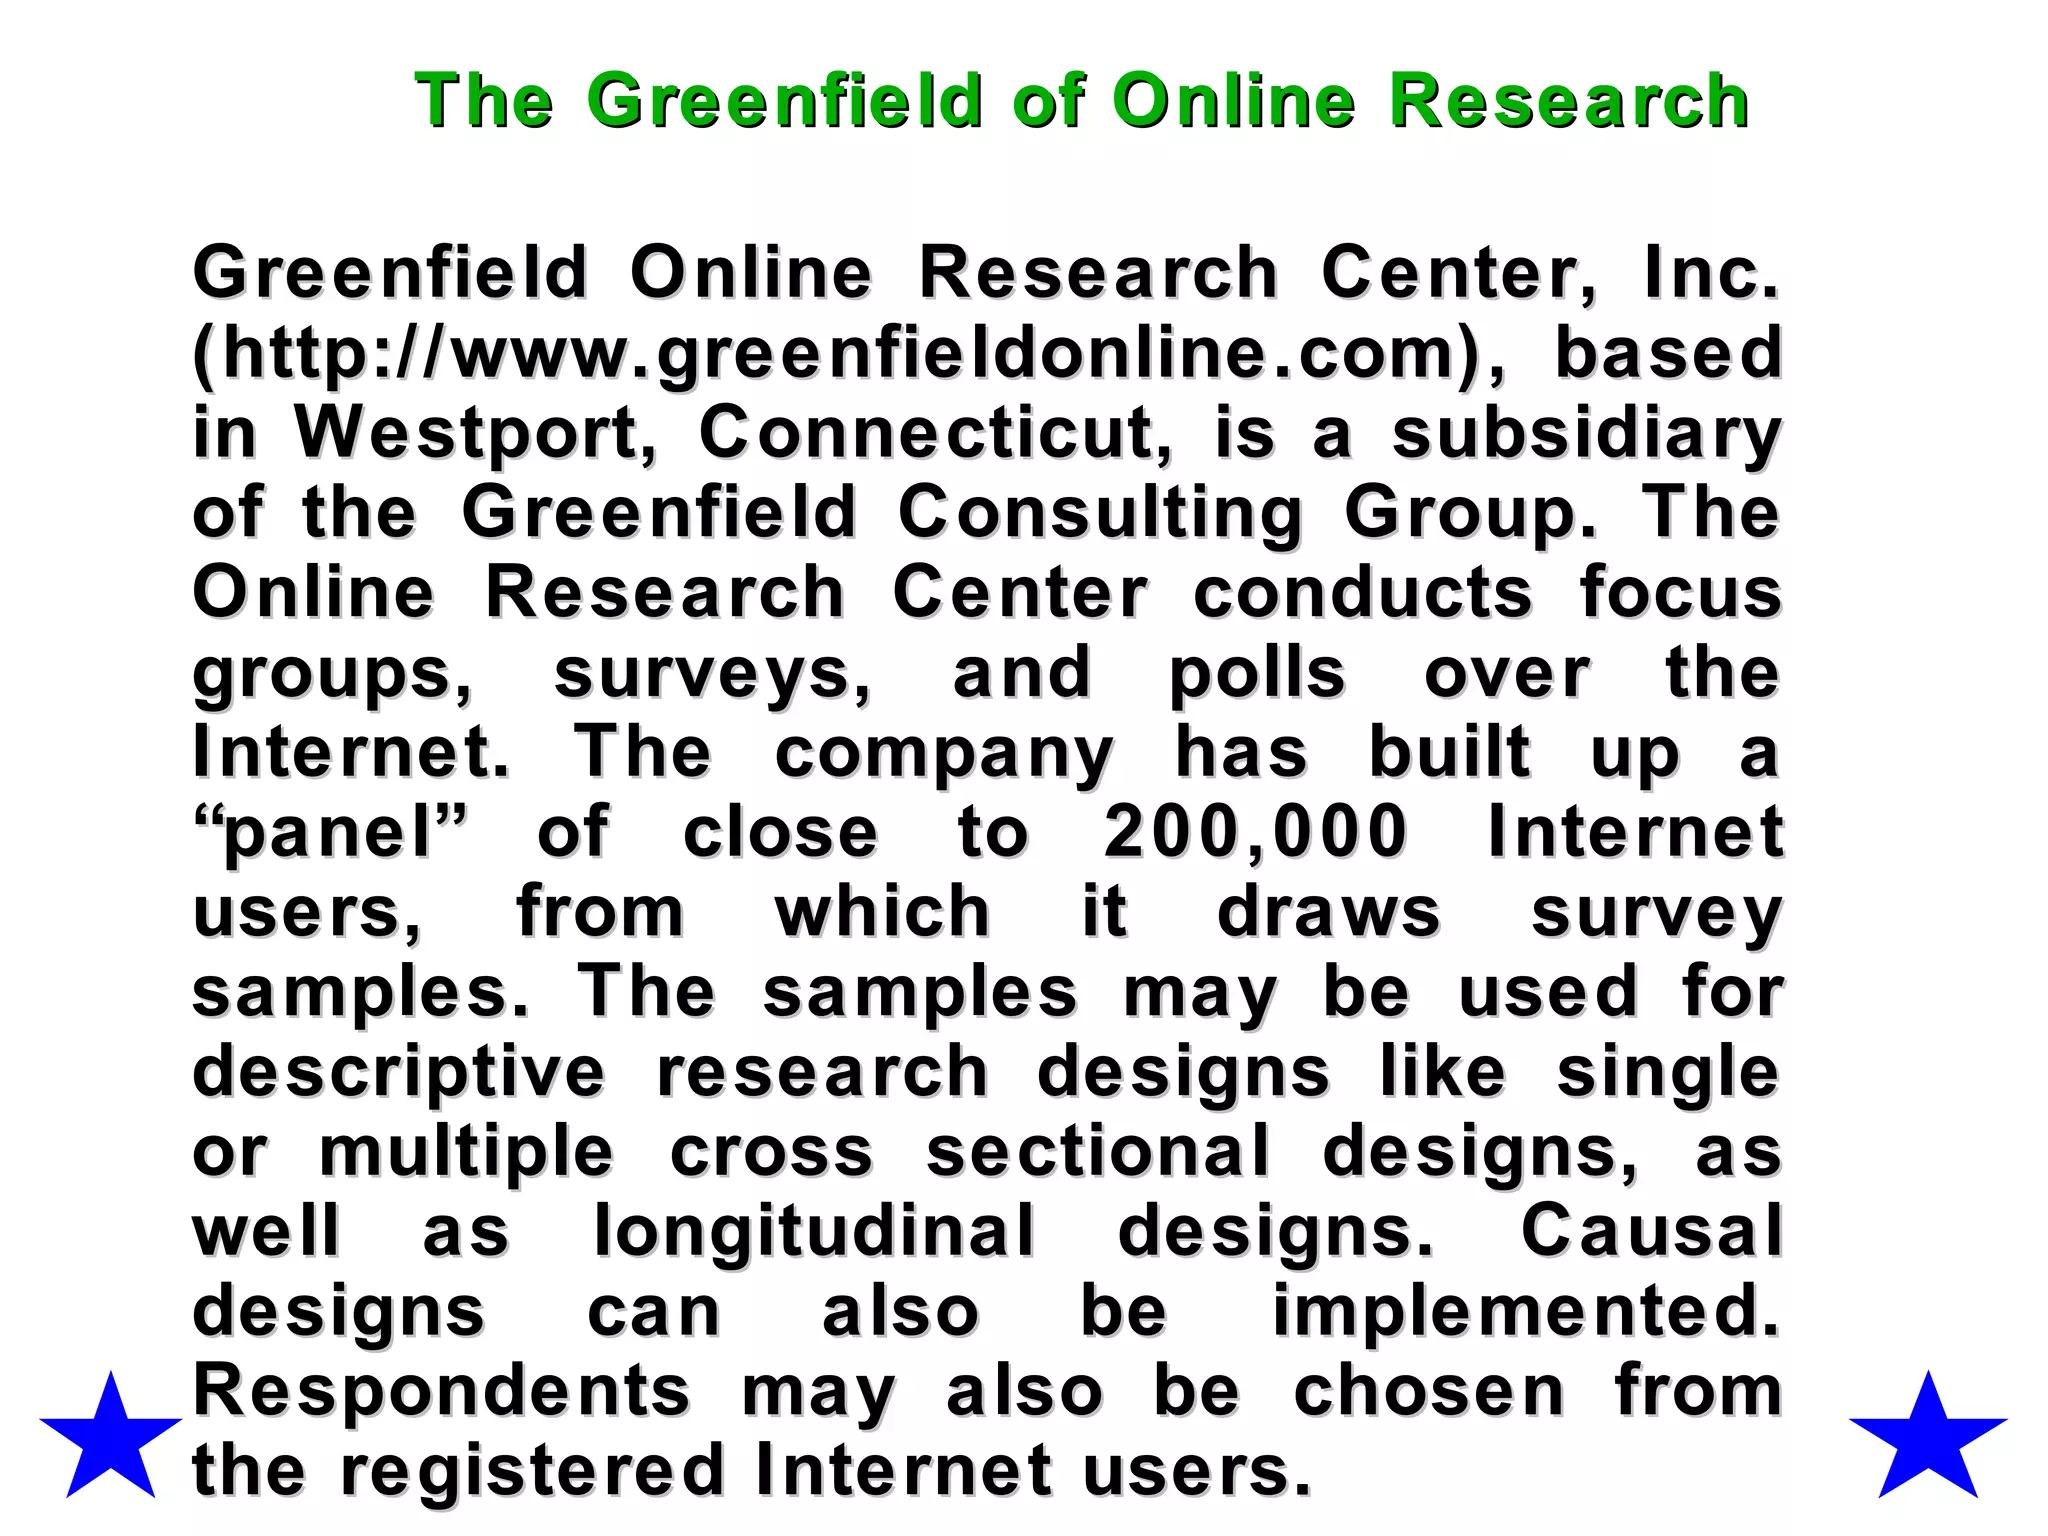
Research DesignResearch Design
Chapter OutlineChapter Outline
1) Overview1) Overview
2) Research Design: Definition2) Research Design: Definition
3) Research Design: Classification3) Research Design: Classification
4) Exploratory Research4) Exploratory Research
5) Descriptive Research5) Descriptive Research
i. Cross-Sectional Designi. Cross-Sectional Design
ii. Longitudinal Designii. Longitudinal Design
iii. Advantages and Disadvantages ofiii. Advantages and Disadvantages of
Longitudinal and Cross-Sectional DesignsLongitudinal and Cross-Sectional Designs
6) Causal Research6) Causal Research
7) Relationships Among Exploratory, Descriptive, and7) Relationships Among Exploratory, Descriptive, and
Causal ResearchCausal Research
8) Potential Sources of Error8) Potential Sources of Error
i. Random Sampling Errori. Random Sampling Error
ii. Non-sampling Errorii. Non-sampling Error
a. Non-response Errora. Non-response Error
b. Response Errorb. Response Error
Chapter Outline (cont.)Chapter Outline (cont.)
definitiondefinition
_ Framework or blueprintFramework or blueprint
_ Details the procedureDetails the procedure
_ ““nuts and bolts ” of implementing thatnuts and bolts ” of implementing that
approach.approach.
Research Design
Conclusive
Research Design
Descriptive
Research
Casual
Research
Cross-Sectional
Design
Longitudinal
Design
Single Cross-
Sectional Design
Multiple Cross-
Sectional Design
Exploratory
Research Design
A Classification of MarketingA Classification of Marketing
Research DesignsResearch Designs
Fig. 3.1Fig. 3.1
TasksTasks
_ Describe the exploratory phase of research.Describe the exploratory phase of research.
_ Define info neededDefine info needed
_ Specify measurement and scaling procedureSpecify measurement and scaling procedure
_ Construct questionnairesConstruct questionnaires
_ Sampling process and size.Sampling process and size.
Objective:
Character-
istics:
Findings /
Results:
Outcome
:
To provide insights and
understanding.
Information needed is
defined only loosely.
Research process is
flexible and unstructured.
Sample is small and
non-representative.
Analysis of primary data
is qualitative.
Tentative.
Generally followed by
further exploratory or
conclusive research.
To test specific hypotheses
and examine relationships.
Information needed is
clearly defined. Research
process is formal and
structured. Sample is large
and representative. Data
analysis is quantitative.
Conclusive.
Findings used as input into
decision making.
ExploratoryExploratory ConclusiveConclusive
Difference between Exploratory and
Conclusive Research
ObjectiveObjective::
CharacteristicCharacteristic
ss::
MethodsMethods::
Discovery ofDiscovery of
ideas andideas and
insightsinsights
Flexible,Flexible,
versatileversatile
Often the frontOften the front
end of totalend of total
researchresearch
designdesign
Expert surveysExpert surveys
Pilot surveysPilot surveys
SecondarySecondary
datadata
Describe marketDescribe market
characteristics orcharacteristics or
functionsfunctions
Marked by theMarked by the
prior formulationprior formulation
of specificof specific
hypotheseshypotheses
Preplanned andPreplanned and
structured designstructured design
Secondary dataSecondary data
SurveysSurveys
PanelsPanels
Observation andObservation and
other dataother data
DetermineDetermine
cause andcause and
effecteffect
relationshipsrelationships
Manipulation ofManipulation of
one or moreone or more
independentindependent
variablesvariables
Control of otherControl of other
mediatingmediating
variablesvariables
ExperimentsExperiments
ExploratoryExploratory DescriptiveDescriptive CausalCausal
A Comparison of Basic Research DesignsA Comparison of Basic Research Designs
8-198-19
20-2920-29
30-3930-39
40-4940-49
50+50+
AgeAge 19601960 19691969 1979197919501950
52.952.9
45.245.2
33.933.9
23.223.2
18.118.1
62.662.6
60.760.7
46.646.6
40.840.8
28.828.8
C1C1
73.273.2
76.076.0
67.767.7
58.658.6
50.050.0
C2C2
81.081.0
75.875.8
71.471.4
67.867.8
51.51.99
C3C3
C8C8
C7C7
C6C6
C5C5
C4C4
C1: cohort born prior to 1900C1: cohort born prior to 1900
C2: cohort born 1901-10C2: cohort born 1901-10
C3: cohort born 1911-20C3: cohort born 1911-20
C4: cohort born 1921-30C4: cohort born 1921-30
C5: cohort born 1931-40C5: cohort born 1931-40
C6: cohort born 1940-49C6: cohort born 1940-49
C7: cohort born 1950-59C7: cohort born 1950-59
C8: cohort born 1960-69C8: cohort born 1960-69
Consumption of Soft Drinks byConsumption of Soft Drinks by
Various Age CohortsVarious Age Cohorts
EvaluatioEvaluatio
n Criterian Criteria
Cross-Cross-
SectionalSectional
DesignDesign
LongitudinalLongitudinal
DesignDesign
Detecting ChangeDetecting Change
Large amount of dataLarge amount of data
collectioncollection
AccuracyAccuracy
Representative SamplingRepresentative Sampling
Response biasResponse bias
--
--
--
++
++
++
++
++
--
--
Note: A “+” indicates a relative advantage overNote: A “+” indicates a relative advantage over
the other design,the other design, whereas a “-” indicates awhereas a “-” indicates a
relative disadvantage.relative disadvantage.
Relative Advantages and Disadvantages ofRelative Advantages and Disadvantages of
Longitudinal and Cross-Sectional DesignsLongitudinal and Cross-Sectional Designs
Brand PurchasedBrand Purchased Time PeriodTime Period
Period 1Period 1 Period 2Period 2
SurveySurvey SurveySurvey
Brand ABrand A 200200 200200
Brand BBrand B 300300 300300
Brand CBrand C 500500 500500
otalotal 10001000 10001000
Cross-Sectional Data MayCross-Sectional Data May
Not Show ChangeNot Show Change
Table 3.5Table 3.5
BrandBrand
PurchasePurchase
d ind in
Period 1Period 1
Brand Purchased in Period 2Brand Purchased in Period 2
Brand ABrand A Brand BBrand B Brand CBrand C TotalTotal
Brand ABrand A
Brand BBrand B
Brand CBrand C
TotalTotal
100100
2525
7575
200200
5050
100100
150150
300300
5050
175175
275275
500500
200200
300300
500500
10001000
Longitudinal Data MayLongitudinal Data May
Show Substantial ChangeShow Substantial Change
Table 3.6Table 3.6
The National Association of Stock Car AutoThe National Association of Stock Car Auto
Racing (NASCAR) in the past has appealed toRacing (NASCAR) in the past has appealed to
Southerners with lower incomes that work inSoutherners with lower incomes that work in
laborer-type jobslaborer-type jobs.. NASCAR, in an attempt toNASCAR, in an attempt to
increase its audience, chose to make-over itsincrease its audience, chose to make-over its
stereotyped image and used exploratory andstereotyped image and used exploratory and
descriptive research todescriptive research to generate ideas forgenerate ideas for
reaching a more affluent market.reaching a more affluent market.
NASCAR Tries to Shed Redneck ImageNASCAR Tries to Shed Redneck Image
Extensive focus groups revealed that:Extensive focus groups revealed that:
(1) NASCAR had a rural sports image,(1) NASCAR had a rural sports image,
(2) that this image was not necessarily(2) that this image was not necessarily
negative, andnegative, and
(3) companies that supported sports(3) companies that supported sports
were viewed positivelywere viewed positively..
NASCAR conducted exploratoryNASCAR conducted exploratory
research to identify ways toresearch to identify ways to
penetrate the non-race market,penetrate the non-race market,
reach younger fans, and build itsreach younger fans, and build its
brand image across the nation.brand image across the nation.
Survey research showed that:Survey research showed that:
29% of fans had income over29% of fans had income over
$50,000$50,000
27% worked as professionals or27% worked as professionals or
managersmanagers
73% had a positive rural sports73% had a positive rural sports
image of NASCARimage of NASCAR
71% of fans purchased products71% of fans purchased products
of companies that support theof companies that support the
sportsport
NASCAR, of course, sought to increaseNASCAR, of course, sought to increase
these percentages and developedthese percentages and developed
marketing plans that would build on themarketing plans that would build on the
image of NASCAR as a rural sport byimage of NASCAR as a rural sport by
emphasizing that most of America isemphasizing that most of America is
suburbs and small towns.suburbs and small towns.
NASCAR moved toNASCAR moved to
reach all of America,reach all of America,
not just thenot just the
traditional Southerntraditional Southern
market.market.
Non-sampling
Error
Non-response
Error
Interviewer
Errors
Respondent
Error
Researcher
Error
Total Error
Random Sampling
Error
•Surrogate Information Error
•Measurement Error
•Population Definition Error
•Sampling Frame Error
•Data Analysis Error
•Respondent Selection Error
•Questioning Error
•Recording Error
•Cheating Error
•Inability Error
•Unwillingness Error
Response
Error
Potential Sources of Error inPotential Sources of Error in
Research DesignsResearch Designs
Marketing Research atMarketing Research at CiticorpCiticorp is typical inis typical in
that it is used to measure consumerthat it is used to measure consumer
awareness of products, monitor theirawareness of products, monitor their
satisfaction and attitudes associated with thesatisfaction and attitudes associated with the
product, track product usage and diagnoseproduct, track product usage and diagnose
problems as they occur. To accomplish theseproblems as they occur. To accomplish these
tasks Citicorp makes extensive use oftasks Citicorp makes extensive use of
exploratory, descriptive, and causal research.exploratory, descriptive, and causal research.
Often it is advantageous to offer specialOften it is advantageous to offer special
financial packages to specific groups offinancial packages to specific groups of
customers. In this case, a financial packagecustomers. In this case, a financial package
is being designed for senior citizens.is being designed for senior citizens.
The followingThe following seven step processseven step process was takenwas taken
Citicorp Banks on Exploratory, Descriptive,Citicorp Banks on Exploratory, Descriptive,
and Causal Researchand Causal Research
1) A taskforce was created to better define the1) A taskforce was created to better define the
market parameters to include all the needs of themarket parameters to include all the needs of the
many Citicorp branches. A final decision wasmany Citicorp branches. A final decision was
made to include Americans 55 years of age ormade to include Americans 55 years of age or
older, retired and in the upper half of the financialolder, retired and in the upper half of the financial
strata of that marketstrata of that market..
2)2) Exploratory research in the form of secondaryExploratory research in the form of secondary
data analysis of the mature or older market wasdata analysis of the mature or older market was
then performed and a study of competitive productsthen performed and a study of competitive products
was conductedwas conducted.. Exploratory qualitative researchExploratory qualitative research
involving focus groups was also carried out in orderinvolving focus groups was also carried out in order
to determine the needs and desires of the marketto determine the needs and desires of the market
and the level of satisfaction with the currentand the level of satisfaction with the current
products.products.
In the case of seniorIn the case of senior
citizens, a greatcitizens, a great
deal of diversity wasdeal of diversity was
found in the market.found in the market.
This was determinedThis was determined
to be due to suchto be due to such
factors as affluence,factors as affluence,
relative age, and therelative age, and the
absence or presenceabsence or presence
of a spouse.of a spouse.
3) The next stage of research was brainstorming.3) The next stage of research was brainstorming.
This involved the formation of many differentThis involved the formation of many different
financial packages aimed for the target market.financial packages aimed for the target market.
In this case, a total of 10 ideas were generated.In this case, a total of 10 ideas were generated.
4) The feasibility of the 10 ideas generated in step
3 was then tested. The ideas were tested on the
basis of whether they were possible in relation to
the business. The following list of questions was
used as a series of hurdles that the ideas had to
pass to continue on to the next step.
• Can the idea be explained in a manner that the
target
market will easily understand it?
• Does the idea fit into the overall strategy of
Citicorp?
•• Is there an available description of a specific
target
market for the proposed product?
• Does the research conducted so far indicate a
potential match for target market needs and is
the
idea perceived to have appeal to this market?
• Is there a feasible outline of the tactics
and strategies for implementing the program?
• Have the financial impact and cost of the
program
been thoroughly evaluated and determined to
be in
line with company practices?
RIP 3.2 Contd.RIP 3.2 Contd.
5) A creative work-plan was then generated.
This plan was to emphasize the competitive
advantage of the proposed product as well as
better delineate the specific features of the
product.
RIP 3.2 Contd.RIP 3.2 Contd.
6) The previous exploratory research was now
followed up with descriptive research in the
form of mall intercept surveys of people in the
target market range. The survey showed that
the list of special features was too long and it
was decided to drop the features more
commonly offered by competitors.
7) Finally, the product was test
marketed in six of the Citicorp
branches within the target
market. Test marketing is a form
of causal research. Given
successful test marketing
results, the product is introduced
nationally.
Greenfield Online Research Center, Inc.Greenfield Online Research Center, Inc.
(http://www.greenfieldonline.com), based(http://www.greenfieldonline.com), based
in Westport, Connecticut, is a subsidiaryin Westport, Connecticut, is a subsidiary
of the Greenfield Consulting Group. Theof the Greenfield Consulting Group. The
Online Research Center conducts focusOnline Research Center conducts focus
groups, surveys, and polls over thegroups, surveys, and polls over the
Internet. The company has built up aInternet. The company has built up a
“panel” of close to 200,000 Internet“panel” of close to 200,000 Internet
users, from which it draws surveyusers, from which it draws survey
samples. The samples may be used forsamples. The samples may be used for
descriptive research designs like singledescriptive research designs like single
or multiple cross sectional designs, asor multiple cross sectional designs, as
well as longitudinal designs. Causalwell as longitudinal designs. Causal
designs can also be implemented.designs can also be implemented.
Respondents may also be chosen fromRespondents may also be chosen from
the registered Internet users.the registered Internet users.
The Greenfield of Online ResearchThe Greenfield of Online Research
Internet users wishing to take part in surveysInternet users wishing to take part in surveys
and other projects begin by registering online atand other projects begin by registering online at
the company’s Web site. The registrationthe company’s Web site. The registration
consists of a “sign-up survey” that asks for e-consists of a “sign-up survey” that asks for e-
mail address, type of computer used, personalmail address, type of computer used, personal
interests and information about the respondent’sinterests and information about the respondent’s
household. Once an Internet user is registered,household. Once an Internet user is registered,
Greenfield Online matches the user withGreenfield Online matches the user with
research studies that are well-suited to his orresearch studies that are well-suited to his or
her interests.her interests.
Incentives to take part in focus groups or specialIncentives to take part in focus groups or special
surveys are offered by the companies whosesurveys are offered by the companies whose
products or services are being researched. Thisproducts or services are being researched. This
incentive is cash or valuable prizes. Incentivesincentive is cash or valuable prizes. Incentives
are also offered to Internet users to encourageare also offered to Internet users to encourage
them to register with Greenfield’s Internet panel.them to register with Greenfield’s Internet panel.
New registrants automatically qualify for prizesNew registrants automatically qualify for prizes

Research design

  • 1.
  • 2.
    Chapter OutlineChapter Outline 1)Overview1) Overview 2) Research Design: Definition2) Research Design: Definition 3) Research Design: Classification3) Research Design: Classification 4) Exploratory Research4) Exploratory Research 5) Descriptive Research5) Descriptive Research i. Cross-Sectional Designi. Cross-Sectional Design ii. Longitudinal Designii. Longitudinal Design iii. Advantages and Disadvantages ofiii. Advantages and Disadvantages of Longitudinal and Cross-Sectional DesignsLongitudinal and Cross-Sectional Designs 6) Causal Research6) Causal Research 7) Relationships Among Exploratory, Descriptive, and7) Relationships Among Exploratory, Descriptive, and Causal ResearchCausal Research
  • 3.
    8) Potential Sourcesof Error8) Potential Sources of Error i. Random Sampling Errori. Random Sampling Error ii. Non-sampling Errorii. Non-sampling Error a. Non-response Errora. Non-response Error b. Response Errorb. Response Error Chapter Outline (cont.)Chapter Outline (cont.)
  • 4.
    definitiondefinition _ Framework orblueprintFramework or blueprint _ Details the procedureDetails the procedure _ ““nuts and bolts ” of implementing thatnuts and bolts ” of implementing that approach.approach.
  • 5.
    Research Design Conclusive Research Design Descriptive Research Casual Research Cross-Sectional Design Longitudinal Design SingleCross- Sectional Design Multiple Cross- Sectional Design Exploratory Research Design A Classification of MarketingA Classification of Marketing Research DesignsResearch Designs Fig. 3.1Fig. 3.1
  • 6.
    TasksTasks _ Describe theexploratory phase of research.Describe the exploratory phase of research. _ Define info neededDefine info needed _ Specify measurement and scaling procedureSpecify measurement and scaling procedure _ Construct questionnairesConstruct questionnaires _ Sampling process and size.Sampling process and size.
  • 7.
    Objective: Character- istics: Findings / Results: Outcome : To provideinsights and understanding. Information needed is defined only loosely. Research process is flexible and unstructured. Sample is small and non-representative. Analysis of primary data is qualitative. Tentative. Generally followed by further exploratory or conclusive research. To test specific hypotheses and examine relationships. Information needed is clearly defined. Research process is formal and structured. Sample is large and representative. Data analysis is quantitative. Conclusive. Findings used as input into decision making. ExploratoryExploratory ConclusiveConclusive Difference between Exploratory and Conclusive Research
  • 8.
    ObjectiveObjective:: CharacteristicCharacteristic ss:: MethodsMethods:: Discovery ofDiscovery of ideasandideas and insightsinsights Flexible,Flexible, versatileversatile Often the frontOften the front end of totalend of total researchresearch designdesign Expert surveysExpert surveys Pilot surveysPilot surveys SecondarySecondary datadata Describe marketDescribe market characteristics orcharacteristics or functionsfunctions Marked by theMarked by the prior formulationprior formulation of specificof specific hypotheseshypotheses Preplanned andPreplanned and structured designstructured design Secondary dataSecondary data SurveysSurveys PanelsPanels Observation andObservation and other dataother data DetermineDetermine cause andcause and effecteffect relationshipsrelationships Manipulation ofManipulation of one or moreone or more independentindependent variablesvariables Control of otherControl of other mediatingmediating variablesvariables ExperimentsExperiments ExploratoryExploratory DescriptiveDescriptive CausalCausal A Comparison of Basic Research DesignsA Comparison of Basic Research Designs
  • 9.
    8-198-19 20-2920-29 30-3930-39 40-4940-49 50+50+ AgeAge 19601960 196919691979197919501950 52.952.9 45.245.2 33.933.9 23.223.2 18.118.1 62.662.6 60.760.7 46.646.6 40.840.8 28.828.8 C1C1 73.273.2 76.076.0 67.767.7 58.658.6 50.050.0 C2C2 81.081.0 75.875.8 71.471.4 67.867.8 51.51.99 C3C3 C8C8 C7C7 C6C6 C5C5 C4C4 C1: cohort born prior to 1900C1: cohort born prior to 1900 C2: cohort born 1901-10C2: cohort born 1901-10 C3: cohort born 1911-20C3: cohort born 1911-20 C4: cohort born 1921-30C4: cohort born 1921-30 C5: cohort born 1931-40C5: cohort born 1931-40 C6: cohort born 1940-49C6: cohort born 1940-49 C7: cohort born 1950-59C7: cohort born 1950-59 C8: cohort born 1960-69C8: cohort born 1960-69 Consumption of Soft Drinks byConsumption of Soft Drinks by Various Age CohortsVarious Age Cohorts
  • 10.
    EvaluatioEvaluatio n Criterian Criteria Cross-Cross- SectionalSectional DesignDesign LongitudinalLongitudinal DesignDesign DetectingChangeDetecting Change Large amount of dataLarge amount of data collectioncollection AccuracyAccuracy Representative SamplingRepresentative Sampling Response biasResponse bias -- -- -- ++ ++ ++ ++ ++ -- -- Note: A “+” indicates a relative advantage overNote: A “+” indicates a relative advantage over the other design,the other design, whereas a “-” indicates awhereas a “-” indicates a relative disadvantage.relative disadvantage. Relative Advantages and Disadvantages ofRelative Advantages and Disadvantages of Longitudinal and Cross-Sectional DesignsLongitudinal and Cross-Sectional Designs
  • 11.
    Brand PurchasedBrand PurchasedTime PeriodTime Period Period 1Period 1 Period 2Period 2 SurveySurvey SurveySurvey Brand ABrand A 200200 200200 Brand BBrand B 300300 300300 Brand CBrand C 500500 500500 otalotal 10001000 10001000 Cross-Sectional Data MayCross-Sectional Data May Not Show ChangeNot Show Change Table 3.5Table 3.5
  • 12.
    BrandBrand PurchasePurchase d ind in Period1Period 1 Brand Purchased in Period 2Brand Purchased in Period 2 Brand ABrand A Brand BBrand B Brand CBrand C TotalTotal Brand ABrand A Brand BBrand B Brand CBrand C TotalTotal 100100 2525 7575 200200 5050 100100 150150 300300 5050 175175 275275 500500 200200 300300 500500 10001000 Longitudinal Data MayLongitudinal Data May Show Substantial ChangeShow Substantial Change Table 3.6Table 3.6
  • 13.
    The National Associationof Stock Car AutoThe National Association of Stock Car Auto Racing (NASCAR) in the past has appealed toRacing (NASCAR) in the past has appealed to Southerners with lower incomes that work inSoutherners with lower incomes that work in laborer-type jobslaborer-type jobs.. NASCAR, in an attempt toNASCAR, in an attempt to increase its audience, chose to make-over itsincrease its audience, chose to make-over its stereotyped image and used exploratory andstereotyped image and used exploratory and descriptive research todescriptive research to generate ideas forgenerate ideas for reaching a more affluent market.reaching a more affluent market. NASCAR Tries to Shed Redneck ImageNASCAR Tries to Shed Redneck Image
  • 14.
    Extensive focus groupsrevealed that:Extensive focus groups revealed that: (1) NASCAR had a rural sports image,(1) NASCAR had a rural sports image, (2) that this image was not necessarily(2) that this image was not necessarily negative, andnegative, and (3) companies that supported sports(3) companies that supported sports were viewed positivelywere viewed positively.. NASCAR conducted exploratoryNASCAR conducted exploratory research to identify ways toresearch to identify ways to penetrate the non-race market,penetrate the non-race market, reach younger fans, and build itsreach younger fans, and build its brand image across the nation.brand image across the nation.
  • 15.
    Survey research showedthat:Survey research showed that: 29% of fans had income over29% of fans had income over $50,000$50,000 27% worked as professionals or27% worked as professionals or managersmanagers 73% had a positive rural sports73% had a positive rural sports image of NASCARimage of NASCAR 71% of fans purchased products71% of fans purchased products of companies that support theof companies that support the sportsport
  • 16.
    NASCAR, of course,sought to increaseNASCAR, of course, sought to increase these percentages and developedthese percentages and developed marketing plans that would build on themarketing plans that would build on the image of NASCAR as a rural sport byimage of NASCAR as a rural sport by emphasizing that most of America isemphasizing that most of America is suburbs and small towns.suburbs and small towns. NASCAR moved toNASCAR moved to reach all of America,reach all of America, not just thenot just the traditional Southerntraditional Southern market.market.
  • 17.
    Non-sampling Error Non-response Error Interviewer Errors Respondent Error Researcher Error Total Error Random Sampling Error •SurrogateInformation Error •Measurement Error •Population Definition Error •Sampling Frame Error •Data Analysis Error •Respondent Selection Error •Questioning Error •Recording Error •Cheating Error •Inability Error •Unwillingness Error Response Error Potential Sources of Error inPotential Sources of Error in Research DesignsResearch Designs
  • 18.
    Marketing Research atMarketingResearch at CiticorpCiticorp is typical inis typical in that it is used to measure consumerthat it is used to measure consumer awareness of products, monitor theirawareness of products, monitor their satisfaction and attitudes associated with thesatisfaction and attitudes associated with the product, track product usage and diagnoseproduct, track product usage and diagnose problems as they occur. To accomplish theseproblems as they occur. To accomplish these tasks Citicorp makes extensive use oftasks Citicorp makes extensive use of exploratory, descriptive, and causal research.exploratory, descriptive, and causal research. Often it is advantageous to offer specialOften it is advantageous to offer special financial packages to specific groups offinancial packages to specific groups of customers. In this case, a financial packagecustomers. In this case, a financial package is being designed for senior citizens.is being designed for senior citizens. The followingThe following seven step processseven step process was takenwas taken Citicorp Banks on Exploratory, Descriptive,Citicorp Banks on Exploratory, Descriptive, and Causal Researchand Causal Research
  • 19.
    1) A taskforcewas created to better define the1) A taskforce was created to better define the market parameters to include all the needs of themarket parameters to include all the needs of the many Citicorp branches. A final decision wasmany Citicorp branches. A final decision was made to include Americans 55 years of age ormade to include Americans 55 years of age or older, retired and in the upper half of the financialolder, retired and in the upper half of the financial strata of that marketstrata of that market..
  • 20.
    2)2) Exploratory researchin the form of secondaryExploratory research in the form of secondary data analysis of the mature or older market wasdata analysis of the mature or older market was then performed and a study of competitive productsthen performed and a study of competitive products was conductedwas conducted.. Exploratory qualitative researchExploratory qualitative research involving focus groups was also carried out in orderinvolving focus groups was also carried out in order to determine the needs and desires of the marketto determine the needs and desires of the market and the level of satisfaction with the currentand the level of satisfaction with the current products.products. In the case of seniorIn the case of senior citizens, a greatcitizens, a great deal of diversity wasdeal of diversity was found in the market.found in the market. This was determinedThis was determined to be due to suchto be due to such factors as affluence,factors as affluence, relative age, and therelative age, and the absence or presenceabsence or presence of a spouse.of a spouse.
  • 21.
    3) The nextstage of research was brainstorming.3) The next stage of research was brainstorming. This involved the formation of many differentThis involved the formation of many different financial packages aimed for the target market.financial packages aimed for the target market. In this case, a total of 10 ideas were generated.In this case, a total of 10 ideas were generated.
  • 22.
    4) The feasibilityof the 10 ideas generated in step 3 was then tested. The ideas were tested on the basis of whether they were possible in relation to the business. The following list of questions was used as a series of hurdles that the ideas had to pass to continue on to the next step. • Can the idea be explained in a manner that the target market will easily understand it? • Does the idea fit into the overall strategy of Citicorp?
  • 23.
    •• Is therean available description of a specific target market for the proposed product? • Does the research conducted so far indicate a potential match for target market needs and is the idea perceived to have appeal to this market? • Is there a feasible outline of the tactics and strategies for implementing the program? • Have the financial impact and cost of the program been thoroughly evaluated and determined to be in line with company practices? RIP 3.2 Contd.RIP 3.2 Contd.
  • 24.
    5) A creativework-plan was then generated. This plan was to emphasize the competitive advantage of the proposed product as well as better delineate the specific features of the product. RIP 3.2 Contd.RIP 3.2 Contd. 6) The previous exploratory research was now followed up with descriptive research in the form of mall intercept surveys of people in the target market range. The survey showed that the list of special features was too long and it was decided to drop the features more commonly offered by competitors.
  • 25.
    7) Finally, theproduct was test marketed in six of the Citicorp branches within the target market. Test marketing is a form of causal research. Given successful test marketing results, the product is introduced nationally.
  • 26.
    Greenfield Online ResearchCenter, Inc.Greenfield Online Research Center, Inc. (http://www.greenfieldonline.com), based(http://www.greenfieldonline.com), based in Westport, Connecticut, is a subsidiaryin Westport, Connecticut, is a subsidiary of the Greenfield Consulting Group. Theof the Greenfield Consulting Group. The Online Research Center conducts focusOnline Research Center conducts focus groups, surveys, and polls over thegroups, surveys, and polls over the Internet. The company has built up aInternet. The company has built up a “panel” of close to 200,000 Internet“panel” of close to 200,000 Internet users, from which it draws surveyusers, from which it draws survey samples. The samples may be used forsamples. The samples may be used for descriptive research designs like singledescriptive research designs like single or multiple cross sectional designs, asor multiple cross sectional designs, as well as longitudinal designs. Causalwell as longitudinal designs. Causal designs can also be implemented.designs can also be implemented. Respondents may also be chosen fromRespondents may also be chosen from the registered Internet users.the registered Internet users. The Greenfield of Online ResearchThe Greenfield of Online Research
  • 27.
    Internet users wishingto take part in surveysInternet users wishing to take part in surveys and other projects begin by registering online atand other projects begin by registering online at the company’s Web site. The registrationthe company’s Web site. The registration consists of a “sign-up survey” that asks for e-consists of a “sign-up survey” that asks for e- mail address, type of computer used, personalmail address, type of computer used, personal interests and information about the respondent’sinterests and information about the respondent’s household. Once an Internet user is registered,household. Once an Internet user is registered, Greenfield Online matches the user withGreenfield Online matches the user with research studies that are well-suited to his orresearch studies that are well-suited to his or her interests.her interests. Incentives to take part in focus groups or specialIncentives to take part in focus groups or special surveys are offered by the companies whosesurveys are offered by the companies whose products or services are being researched. Thisproducts or services are being researched. This incentive is cash or valuable prizes. Incentivesincentive is cash or valuable prizes. Incentives are also offered to Internet users to encourageare also offered to Internet users to encourage them to register with Greenfield’s Internet panel.them to register with Greenfield’s Internet panel. New registrants automatically qualify for prizesNew registrants automatically qualify for prizes