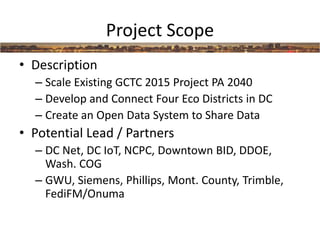
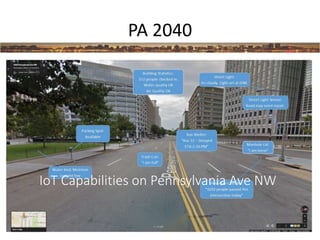
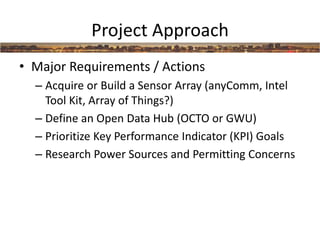
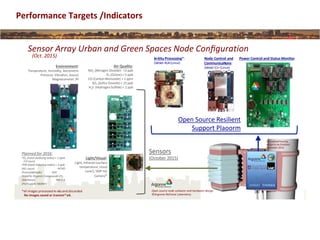
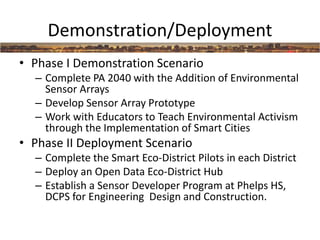
Global City Teams Challenge
2016 Kickoff
November 12-13, 2015
Report Out: Smart Eco-Districts DC
Project Scope
• Description
– Scale Existing GCTC 2015 Project PA 2040
– Develop and Connect Four Eco Districts in DC
– Create an Open Data System to Share Data
• Potential Lead / Partners
– DC Net, DC IoT, NCPC, Downtown BID, DDOE,
Wash. COG
– GWU, Siemens, Phillips, Mont. County, Trimble,
FediFM/Onuma
IoT Capabilities on Pennsylvania Ave NW
PA 2040
Pennsylvania Avenue West of the White House – Concept Plan
Courtesy of KGP Design Studio
PA 2040
Project Approach
• Major Requirements / Actions
– Acquire or Build a Sensor Array (anyComm, Intel
Tool Kit, Array of Things?)
– Define an Open Data Hub (OCTO or GWU)
– Prioritize Key Performance Indicator (KPI) Goals
– Research Power Sources and Permitting Concerns
Project Approach
• Major Requirements / Actions
– Acquire or Build a Sensor Array (anyComm, Intel
Tool Kit, Array of Things?)
– Define an Open Data Hub (OCTO or GWU)
– Prioritize Key Performance Indicator (KPI) Goals
– Research Power Sources and Permitting Concerns
Performance Targets /Indicators
• Performance Targets/KPIs
– Reduce Building Energy Use (EUI’s) by X%
– Improve Air Quality Across the City
• Measurement Methods for Performance/KPIs
– EUI’s based on Existing Building performance Data
– Environment: Temperature, Humidity, Barometric
Pressure, Sound, Air Quality:
– NO2 (Nitrogen Dioxide): <2 ppb
– O3 (Ozone) < 5 ppb CO (Carbon Monoxide) < 1 ppm
SO2 (Sulfur Dioxide) < 15 ppb H2S (Hydrogen Sulfide)
< 2 ppb
Performance Targets /Indicators
Data Gathering Existing Conditions Data
Performance Targets /Indicators
Single Building Energy Analysis Sheets
Power Control and Status MonitorNode Control and
CommunicaNons:
Odroid-‐C1+(Linux)
In-‐Situ Processing*:
Odroid-‐XU4(Linux)
Air Quality:
NO2 (Nitrogen Dioxide): <2 ppb
O3 (Ozone) < 5 ppb
CO (Carbon Monoxide) < 1 ppm
SO2 (Sulfur Dioxide) < 15 ppb
H2S (Hydrogen Sulfide) < 2 ppb
Environment:
Temperature, Humidity, Barometric
Pressure, VibraKon, Sound,
Magnetometer, RF
*all images processed in-‐situand discarded
No images saved or transmi*ed.
Light/Visual:
Light, Infrared (surface
temperature, cloud
cover), 5MP HD
Camera*
Conceptual housing
designto be finalized
November 2015.
Sensors
(October 2015)
Open Source Resilient
Support Plaoorm
Sensor Array Urban and Green Spaces Node Configuration
(Oct. 2015)
Planned for 2016:
TOX (total oxidizing index) < 1 ppm
(CO equiv)
TOR (total reducing index) < 2 ppb
(NO2 equiv) HCHO
(Formaldehyde) VOC
(VolaFle Organic Compound) CH4
(Methane) PM 2.5
(ParFculate MaWer)
Open source node soXware and hardware design
©Argonne NaFonal Laboratory
Performance Targets /Indicators
Open Data Building Dash Board
Demonstration/Deployment
• Phase I Demonstration Scenario
– Complete PA 2040 with the Addition of Environmental
Sensor Arrays
– Develop Sensor Array Prototype
– Work with Educators to Teach Environmental Activism
through the Implementation of Smart Cities
• Phase II Deployment Scenario
– Complete the Smart Eco-District Pilots in each District
– Deploy an Open Data Eco-District Hub
– Establish a Sensor Developer Program at Phelps HS,
DCPS for Engineering Design and Construction.

Report Out: Smart Eco-Districts DC

  • 1.
    Global City TeamsChallenge 2016 Kickoff November 12-13, 2015 Report Out: Smart Eco-Districts DC
  • 2.
    Project Scope • Description –Scale Existing GCTC 2015 Project PA 2040 – Develop and Connect Four Eco Districts in DC – Create an Open Data System to Share Data • Potential Lead / Partners – DC Net, DC IoT, NCPC, Downtown BID, DDOE, Wash. COG – GWU, Siemens, Phillips, Mont. County, Trimble, FediFM/Onuma
  • 3.
    IoT Capabilities onPennsylvania Ave NW PA 2040
  • 4.
    Pennsylvania Avenue Westof the White House – Concept Plan Courtesy of KGP Design Studio PA 2040
  • 5.
    Project Approach • MajorRequirements / Actions – Acquire or Build a Sensor Array (anyComm, Intel Tool Kit, Array of Things?) – Define an Open Data Hub (OCTO or GWU) – Prioritize Key Performance Indicator (KPI) Goals – Research Power Sources and Permitting Concerns
  • 6.
    Project Approach • MajorRequirements / Actions – Acquire or Build a Sensor Array (anyComm, Intel Tool Kit, Array of Things?) – Define an Open Data Hub (OCTO or GWU) – Prioritize Key Performance Indicator (KPI) Goals – Research Power Sources and Permitting Concerns
  • 7.
    Performance Targets /Indicators •Performance Targets/KPIs – Reduce Building Energy Use (EUI’s) by X% – Improve Air Quality Across the City • Measurement Methods for Performance/KPIs – EUI’s based on Existing Building performance Data – Environment: Temperature, Humidity, Barometric Pressure, Sound, Air Quality: – NO2 (Nitrogen Dioxide): <2 ppb – O3 (Ozone) < 5 ppb CO (Carbon Monoxide) < 1 ppm SO2 (Sulfur Dioxide) < 15 ppb H2S (Hydrogen Sulfide) < 2 ppb
  • 8.
    Performance Targets /Indicators DataGathering Existing Conditions Data
  • 9.
    Performance Targets /Indicators SingleBuilding Energy Analysis Sheets
  • 10.
    Power Control andStatus MonitorNode Control and CommunicaNons: Odroid-‐C1+(Linux) In-‐Situ Processing*: Odroid-‐XU4(Linux) Air Quality: NO2 (Nitrogen Dioxide): <2 ppb O3 (Ozone) < 5 ppb CO (Carbon Monoxide) < 1 ppm SO2 (Sulfur Dioxide) < 15 ppb H2S (Hydrogen Sulfide) < 2 ppb Environment: Temperature, Humidity, Barometric Pressure, VibraKon, Sound, Magnetometer, RF *all images processed in-‐situand discarded No images saved or transmi*ed. Light/Visual: Light, Infrared (surface temperature, cloud cover), 5MP HD Camera* Conceptual housing designto be finalized November 2015. Sensors (October 2015) Open Source Resilient Support Plaoorm Sensor Array Urban and Green Spaces Node Configuration (Oct. 2015) Planned for 2016: TOX (total oxidizing index) < 1 ppm (CO equiv) TOR (total reducing index) < 2 ppb (NO2 equiv) HCHO (Formaldehyde) VOC (VolaFle Organic Compound) CH4 (Methane) PM 2.5 (ParFculate MaWer) Open source node soXware and hardware design ©Argonne NaFonal Laboratory Performance Targets /Indicators
  • 11.
  • 12.
    Performance Targets /Indicators OpenData Building Dash Board
  • 13.
    Demonstration/Deployment • Phase IDemonstration Scenario – Complete PA 2040 with the Addition of Environmental Sensor Arrays – Develop Sensor Array Prototype – Work with Educators to Teach Environmental Activism through the Implementation of Smart Cities • Phase II Deployment Scenario – Complete the Smart Eco-District Pilots in each District – Deploy an Open Data Eco-District Hub – Establish a Sensor Developer Program at Phelps HS, DCPS for Engineering Design and Construction.