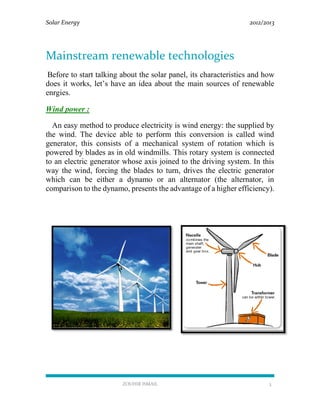
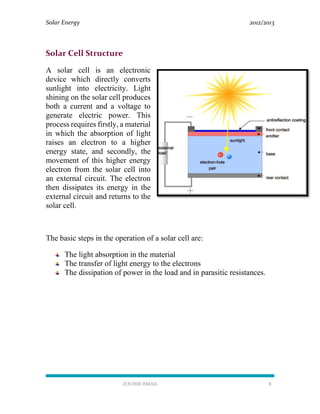
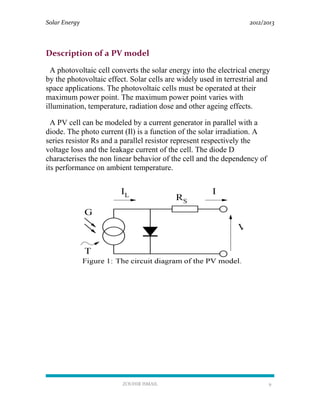
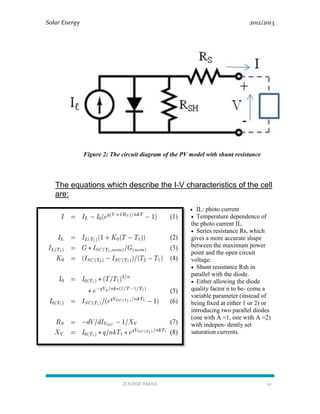
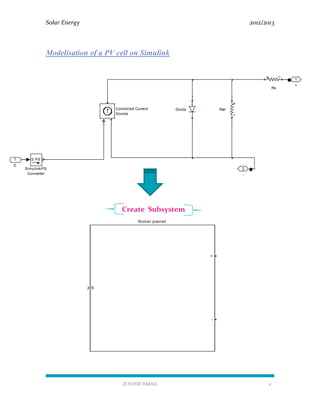
ZOUHIR ISMAIL | ERASMUS REPORT | 2012/2013
Solar Energy
MODELING OF PHOTOVOLAIC PANELS
Solar Energy 2012/2013
ZOUHIR ISMAIL 1
Summary
Introduction ………………………………………………………………………….………………2
Mainstream renewable technologies ………………….…………………………………3
Wind power………………………………………………… …………………3
Hydropower………………………………………………………………………4
Biomass……………………………………………………………………………6
Solar energy……………………………………………… ……………………6
History of Photovoltaics …………………….…………………………………………………7
Objectives of my project…………….…………………………………………………………7
Solar cell structure…………….…………………………………………………..…………….8
Description of PV model………….………………………………………………….………9
Objectives of my project…………….…………………………………………………………8
Areas of operating PV model……………………………………………………………….14
V-I cures…………………………………………………………………………………..………....15
V-I curves for different radiations………………………………………………………15
V-P curves for different radiations………………………………………………………16
V-I curves for different temperatures………….………………………………………17
V-P curves for different temperatures……………………………………………..…18
Influence of series resistances………………………………………..……………………19
Influence of shunt resistances…………………………………………………………..…21
From modules to array……………………….……………………………….………………23
Serie/Parallel association…………………………………………………………23
Serie association……………………………………………..………………………24
Parallel association…………………………..………………………………………25
How to maximize energy (MPPT)………………………………..…………………………………………26
Conclusion……………………………………………………………………………………………………………...28
Bibliography……………………………………………………………………………………………………………29
Solar Energy 2012/2013
ZOUHIR ISMAIL 2
INTRODUCTION
The use of renewable energy sources, such as solar, wind and
hydraulic energies, is very old; they have been used since many centuries
before our time but humans were more interested in using fossil fuels due
to the low price of petroleum, so the renewable enegies were abandoned.
During recent years, due to the increase in fossil fuel prices and the
environmental problems caused by the use of conventional fuels, we are
reverting back to renewable energy sources.
Energy is called renewable because it is produced from inexhaustible
resources. It has long been exploited fossil fuels or "energy stock": oil,
coal, gas, primarily uranium. Clean, they improve the management of
local resources and create jobs. One of these is solar power.
In my project, i will focus on the solar energy and how does it work
by using a software « Matlab » which will allow me to model PV panels
and study their characterisitcs.
Solar Energy 2012/2013
ZOUHIR ISMAIL 3
Mainstream renewable technologies
Before to start talking about the solar panel, its characteristics and how
does it works, let’s have an idea about the main sources of renewable
enrgies.
Wind power :
An easy method to produce electricity is wind energy: the supplied by
the wind. The device able to perform this conversion is called wind
generator, this consists of a mechanical system of rotation which is
powered by blades as in old windmills. This rotary system is connected
to an electric generator whose axis joined to the driving system. In this
way the wind, forcing the blades to turn, drives the electric generator
which can be either a dynamo or an alternator (the alternator, in
comparison to the dynamo, presents the advantage of a higher efficiency).
Solar Energy 2012/2013
ZOUHIR ISMAIL 4
Hydropower :
Hydropower is a very low-emission energy greenhouse gas emissions.
This renewable energy source uses the movement of water powered by
the sun and gravity through the water cycle, tides and ocean currents.
They use the waterfalls, natural (waterfalls) or artificial (hydroelectric
dams), the flow of rivers and ocean currents (tidal thermohaline
circulation ...), hydropower plants produce mechanical energy converted
mostly to electricity.
The hydraulic energy represents 19% of total electricity production in the
world and 13% in France. This is the most used renewable energy source.
However, all the world's hydroelectric potential has not yet been
exploited.
Solar Energy 2012/2013
ZOUHIR ISMAIL 5
Biomass :
Biomass is the second renewable energy in
the world. It produces electricity, heat via
combustion of wastes and residues of plant
and animal organic matter.Through the
process of photosythesis, plants capture the
sun's energy. When the plants are burnt, they
release the sun's energy they contain. In this
way, biomass functions as a sort of natural
battery for storing solar energy.
Solar Energy
Photovoltaic solar energy comes from the
conversion of sunlight into electricity in
semiconductor materials such as silicon or
covered with a thin metallic layer. These
photosensitive materials have the property
of releasing their electrons under the
influence of external energy. This is the
photovoltaic effect. A photovoltaic solar
generator consists of photovoltaic modules themselves compound of
interconnected photovoltaic cells.
Solar Energy 2012/2013
ZOUHIR ISMAIL 6
Solar Energy
History of photovoltaics panels :
Photovoltaics is the process of converting sunlight directly into
electricity using solar cells. Today it is a rapidly growing and increasingly
important renewable alternative to conventional fossil fuel electricity
generation, but compared to other electricity generating technologies, it
is a relative newcomer, with the first practical photovoltaic devices
demonstrated in the 1950s. Research and development of photovoltaics
received its first major boost from the space industry in the 1960s which
required a power supply separate from "grid" power for satellite
applications. These space solar cells were several thousand times more
expensive than they are today and the perceived need for an electricity
generation method apart from grid power was still a decade away, but
solar cells became an interesting scientific variation to the rapidly
expanding silicon transistor development with several potentially
specialized niche markets. It took the oil crisis in the 1970s to focus world
attention on the desirability of alternate energy sources for terrestrial use,
which in turn promoted the investigation of photovoltaics as a means of
generating terrestrial power. Although the oil crisis proved short-lived
and the financial incentive to develop solar cells abated, solar cells had
entered the arena as a power generating technology. Their application and
advantage to the "remote" power supply area was quickly recognized and
prompted the development of terrestrial photovoltaics industry. Small
scale transportable applications (such as calculators and watches) were
utilised and remote power applications began to benefit from
photovoltaics.
In the 1980s research into silicon solar cells paid off and solar cells began
to increase their efficiency. In 1985 silicon solar cells achieved the
milestone of 20% efficiency. Over the next decade, the photovoltaic
industry experienced steady growth rates of between 15% and 20%,
largely promoted by the remote power supply market. The year 1997 saw
Solar Energy 2012/2013
ZOUHIR ISMAIL 7
a growth rate of 38% and today solar cells are recognized not only as a
means for providing power and increased quality of life to those who do
not have grid access, but they are also a means of significantly
diminishing the impact of environmental damage caused by conventional
electricity generation in advanced industrial countries.
Objectives of my project :
Describe model of PV cell
Characterize V-I & V-P curves for different radiations G.
Characterize V-I & V-P curves for different temperatures T.
Study the influence Rs.
Study the influence of parrallel resistance Rsh.
Associate cells.
Propose algorythms to maximize energy.
Solar Energy 2012/2013
ZOUHIR ISMAIL 8
Solar Cell Structure
A solar cell is an electronic
device which directly converts
sunlight into electricity. Light
shining on the solar cell produces
both a current and a voltage to
generate electric power. This
process requires firstly, a material
in which the absorption of light
raises an electron to a higher
energy state, and secondly, the
movement of this higher energy
electron from the solar cell into
an external circuit. The electron
then dissipates its energy in the
external circuit and returns to the
solar cell.
The basic steps in the operation of a solar cell are:
The light absorption in the material
The transfer of light energy to the electrons
The dissipation of power in the load and in parasitic resistances.
Solar Energy 2012/2013
ZOUHIR ISMAIL 9
Description of a PV model
A photovoltaic cell converts the solar energy into the electrical energy
by the photovoltaic effect. Solar cells are widely used in terrestrial and
space applications. The photovoltaic cells must be operated at their
maximum power point. The maximum power point varies with
illumination, temperature, radiation dose and other ageing effects.
A PV cell can be modeled by a current generator in parallel with a
diode. The photo current (Il) is a function of the solar irradiation. A
series resistor Rs and a parallel resistor represent respectively the
voltage loss and the leakage current of the cell. The diode D
characterises the non linear behavior of the cell and the dependency of
its performance on ambient temperature.
Solar Energy 2012/2013
ZOUHIR ISMAIL 10
Figure 2: The circuit diagram of the PV model with shunt resistance
The equations which describe the I-V characteristics of the cell
are:
 IL: photo current
 Temperature dependence of
the photo current IL.
 Series resistance Rs, which
gives a more accurate shape
between the maximum power
point and the open circuit
voltage.
 Shunt resistance Rsh in
parallel with the diode.
 Either allowing the diode
quality factor n to be- come a
variable parameter (instead of
being fixed at either 1 or 2) or
introducing two parallel diodes
(one with A =1, one with A =2)
with indepen- dently set
saturation currents.
Solar Energy 2012/2013
ZOUHIR ISMAIL 11
Modelisation of a PV cell on Simulink
Create Subsystem
2
-
1
+
PSS
Simulink-PS
Converter
Rsh
Rs
+-
DiodeControlled Current
Source
1
E
E
+
-
Solar panel
Solar Energy 2012/2013
ZOUHIR ISMAIL 12
==> We will simulate the model of the solar panel to verify its characteristics.
Figure 3 : Modeling of PV panel on Matlab/Simulink
Objectives :
 Characterise V-I & V-P curves for different radiations G.
 Characterise V-I & V-P curves for different temperatures
Solar Energy 2012/2013
ZOUHIR ISMAIL 13
In the above representation of I-V characteristic, a sign convention is used, which
takes as positive the current generated by the cell when the sun is shining and a positive
voltage is applied on the cell’s terminals. A real solar cell can be characterized by the
following fundamental parameters:
- Short Circuit Current: It is the
greatest value of the current generated
by a cell. It is produced under short
circuit conditions: V = 0
- Open circuit voltage: Corresponds
to the voltage drop across the diode
(p-n junction), when it is traversed by
the photocurrent Iph (namely ID=Iph)
when the generator current is I = 0. It reflects the voltage of the cell in the night,
- Maximum power point:Is the operating point A (Vmax, Imax) at which the power
dissipated in the resistive load is maximum: Pmax = Imax * Vmax
- Maximum efficiency: Is the ratio between the maximum power and the incident light
power
Figure 4 : Characteristics I-V of PV cell
Solar Energy 2012/2013
ZOUHIR ISMAIL 14
Areas of operation of solar module
AREA 1 AREA 2 AREA3
Figure 5 : Different operating areas
AREA 1 : the current remains constant regardless of the voltage,
PV generator operates as a current generator
AREA 2 : it’s the best area for the operation of the generator, where the point optimal
(characterized by a maximum power) can be determined.
AREA 3 : that zone is characterized by a change in current corresponding to
voltage nearly constant, in which case the generator is similar to a voltage
generator.
0 5 10 15 20 25
0
0.5
1
1.5
2
2.5
3
3.5
4
Current(A)
V-I curves for G=1000W/m²
Voltage (V)
Solar Energy 2012/2013
ZOUHIR ISMAIL 15
1) V-P curves for differents radiations
Figure 6 : Variation of current with different radiations
This simulation allows the appearance of values given by the manufacturers and those
features that are found on the model. From this simulation, we have:
Power max = 59,83 W and Voc= 17.1 V ===> Simulation
Power max = 60 W and Voc= 17,1 V ===> Manufacturers
The simulation results and those found on the label manufacturers
are almost the same.
0 5 10 15 20 25
0
10
20
30
40
50
60
X: 17.1
Y: 59.83
Voltage (V)
Power(W)
V-P curves for different radiations
400W/m²
600W/m²
800W/m²
1000W/m²
Solar Energy 2012/2013
ZOUHIR ISMAIL 16
2) V-I curves for differents radiations
Figure 7 : Variation of power output with different radiations
It can be observed from this figure that the short circuit current
decreases with decrease when the the radiation is increased.
Regarding the maximum power output of a photovoltaic cell, it is
clear that when the irradiance is higher, the cell generates more
power.
Obviously, irradiance has a large effect on short-circuit current.
0 5 10 15 20 25
0
0.5
1
1.5
2
2.5
3
3.5
4
Current(A)
Voltage (V)
V-I curves for different radiations
400W/m²
600W/m²
800W/m²
1000W/m²
Solar Energy 2012/2013
ZOUHIR ISMAIL 17
1) V-I curves for differents temperatures
Figure 8 : Variation of current output with different temperatures
If the temperature increases with a constant radiation, the open circuit
voltage Voc decreases with temperature. Increase the temperature 
Voc is low. The influence of temperature on Isc can be neglected in
most cases.
0 5 10 15 20 25
0
0.5
1
1.5
2
2.5
3
3.5
4
Voltage (V)
Current(A)
V-I curves for different temperatures
The
temperature increases
Solar Energy 2012/2013
ZOUHIR ISMAIL 18
2) V-P curves for differents temperatures
Figure 9 : Variation of power output with different temperatures
This figure displays the response of a solar cell to varying
temperature. You have to know that Contrary to popular belief, the
efficiency of a solar cell decreases with increasing temperature. The
reason for this, is that a higher temperature increases the conductivity of
the semiconductor.
0 5 10 15 20 25
0
10
20
30
40
50
60
V-P curves for different temperatures
Voltage (V)
Power(W)
The
temperature
increases
Solar Energy 2012/2013
ZOUHIR ISMAIL 19
Radiations and temperatures are the two main parameters that
modify the characteristics of PV cells. These parameters should be
carefully considered when setting up solar panels.
The influence of Series Resistances
Series resistance in a solar cell has three causes: firstly, the
movement of current through the emitter and base of the solar cell;
secondly, the contact resistance between the metal contact and the
silicon; and finally the resistance of the top and rear metal contacts. The
main impact of series resistance is to reduce the fill factor, although
excessively high values may also reduce the short-circuit current.
Figure 10 : Schematic of a solar cell with series resistance.
For the simulation, I increase the value of Rs :
Rs
2.5 * Rs
3.5 * Rs
20 * Rs
Solar Energy 2012/2013
ZOUHIR ISMAIL 20
Figure 11 : Influence of Serie Resistance
The series resistance react on the slope of the characteristic I-V in the
area where PV generator operates as a voltage generator. It does not affect
the open-circuit voltage, and when R is too high, it decreases the value of
curent short-circuit.
0 5 10 15 20 25
0
0.5
1
1.5
2
2.5
3
3.5
4
Voltage (V)
Current(A)
Influence on Rs
rs
2.5rs
3.5rs
20rs
Solar Energy 2012/2013
ZOUHIR ISMAIL 21
The influence of Shunt Resistances
Significant power losses caused by the presence of a shunt
resistance, RSH, are typically due to manufacturing defects, rather than
poor solar cell design. Low shunt resistance causes power losses in solar
cells by providing an alternate current path for the light-generated current.
Such a diversion reduces the amount of current flowing through the solar
cell junction and reduces the voltage from the solar cell. The effect of a
shunt resistance is particularly severe at low light levels, since there will
be less light-generated current. The loss of this current to the shunt
therefore has a larger impact. In addition, at lower voltages where the
effective resistance of the solar cell is high, the impact of a resistance in
parallel is large.
Figure 14 : Circuit diagram of a solar cell including the shunt resistance.
Solar Energy 2012/2013
ZOUHIR ISMAIL 22
Figure 15 : Influence of Shunt Resistance
In general, the shunt resistance is elevated, its effect is noticed
especially in the part of the current generation.
The effect of the shunt resistor on the curve results in a slight
decrease in the open circuit voltage and an increase of the slope of the
curve in the cell area corresponding to operation as a current source.
0 5 10 15 20 25
0
0.5
1
1.5
2
2.5
3
3.5
4
Voltage (V)
Current(A)
Influence of Rsh
1000 Ohms
150 Ohms
20 Ohms
Solar Energy 2012/2013
ZOUHIR ISMAIL 23
From Modules to Arrays
A PV module consists of a number of interconnected solar cells
(typically 36 connected in series) encapsulated into a single, long-lasting,
stable unit.
Serie/Parallel Association  When highpower is needed
0 5 10 15 20 25 30 35 40 45
0
1
2
3
4
5
6
7
8
Current(A)
Voltage (V)
V-I curves for serie/parallel association
1 solar panel
4 solar panels (serie/parallel)
Solar Energy 2012/2013
ZOUHIR ISMAIL 24
Association in serie  at any given current (which flows through each of
themodules), the total voltage is just the sum of the individual module voltages
Matlab Simulation
0 5 10 15 20 25 30 35 40 45
0
0.5
1
1.5
2
2.5
3
3.5
4
Voltage (V)
Current(A)
V-I curves for serie association
1 Solar panel
2 solar panels
Solar Energy 2012/2013
ZOUHIR ISMAIL 25
Association in parallel  at any given voltage, the I–V curve of the parallel
combination is just the sum of the individual module currents at that voltage.
0 5 10 15 20 25
0
1
2
3
4
5
6
7
8
Voltage (V)
Current(A)
I-V cures for parallel association
1 Solar panel
2 solar panels
Solar Energy 2012/2013
ZOUHIR ISMAIL 26
How to maximise Energy
Solar cells have a complex relationship between solar irradiation,
temperature and total resistance that produces a non-linear output
efficiency which can be analyzed based on the I-V curve.
To get the maximum possible power from one or more photovoltaic
devices, typically solar panels though optical power transmission systems
can benefit from similar technology we use a technique called : Maximum
power point tracking (MPPT)
Maximum power point trackers may implement different algorithms
and switch between them based on the operating conditions of the
array and one of this algorithm :
Perturb and Observe
The concept behind the “perturb and observe” method is to modify the
operating voltage or current of the photovoltaic panel until you obtain
maximum power from it. For example, if increasing the voltage to a cell
increases the power output of a cell, the system increases the operating
voltage until the power output begins to decrease. Once this happens, the
voltage is decreased to get back to the maximum power output value. This
process continues until the maximum power point is reached. Thus, the
power output value oscillates around a maximum power value until it
stabilizes. Perturb and observe is the most commonly used MPPT method
due to its ease of implementation.
Solar Energy 2012/2013
ZOUHIR ISMAIL 27
Figure 15 : Algorithm of P&O method
One of the major drawbacks of the perturb and observe method is that
the power obtained oscillates around the maximum power point in
steady state operation. Also, this algorithm can track in the wrong
direction under rapidly varying irradiance levels.
Solar Energy 2012/2013
ZOUHIR ISMAIL 28
Conclusion
The work presented in this report concerns the modeling of a
photovoltaic panel. The study is based on the impact of various
parameters on I (V) and P (V) characteristics of a system of photovoltaic
panels.
The solar cell acts as a generator:
- Current generator
- Voltage generator
The characteristic of I (V) is influenced by many parameters:
temperatures, radiations, serie resistance, shunt resistance.
I found from the result that in the association of cells in series, for a
constant current, the voltage increases, and in association of cells in
parallel, for a constant voltage, the current increases.
In another phase, I was looking for the maximum power that can be
extracted from a photovoltaic panel. Indeed, the production of electric
energy using a photovoltaic panel has an optimum operating point. This
optimum point has the characteristic to change with the temperature and
illumination.
I want to thank Roberto Villafafila for monitoring and assistance has given me and the people
who work in international relations office who gave me this chance to live a great experience,
an experience I'd retried the coming years.
Solar Energy 2012/2013
ZOUHIR ISMAIL 29
Bibliography
http://pveducation.org/
http://www.intechopen.com/books/new-developments-in-renewable-
energy/modeling-of-photovoltaic-cell-using-free-software-application-for-training-
and-design-circuit-in-pho
http://users.utcluj.ro/~atn/papers/ATN_1_2008_8.pdf
http://etd.ohiolink.edu/send-
pdf.cgi/Dzimano%20Gwinyai%20J.pdf?osu1228307443
http://www.google.fr/imgres?hl=fr&biw=1366&bih=664&tbm=isch&tbnid=HRv
8LOiKjH-
EwM:&imgrefurl=http://provemploi.blog.regionsjob.com/index.php/post/2009/04/
30/Le-secteur-de-l%25E2%2580%2599%25C3%25A9nergie-renouvelable-
embauche-en-
masse&docid=ucSyuR8PLXM4AM&imgurl=http://provemploi.blog.regionsjob.co
m/public/energie-
renouvelable.jpg&w=335&h=335&ei=OzzEUcKlOeKU0AXm7oH4BQ&zoom=1
&iact=hc&vpx=305&vpy=241&dur=32&hovh=225&hovw=225&tx=150&ty=12
3&page=1&tbnh=145&tbnw=149&start=0&ndsp=20&ved=1t:429,r:2,s:0,i:167
http://www.google.fr/imgres?um=1&hl=fr&biw=1366&bih=664&tbm=isch&tbni
d=IH2YNzauWCvXzM:&imgrefurl=http://www.alternative-energy-
news.info/technology/hydro/&docid=DaJJBccwebH7JM&imgurl=http://www.alte
rnative-energy-news.info/images/technical/hydro-
power.jpg&w=550&h=411&ei=fTzEUeT5IsqT0QWG4IDwAw&zoom=1&iact=hc
&vpx=12&vpy=267&dur=300&hovh=175&hovw=235&tx=134&ty=134&page=
1&tbnh=149&tbnw=200&start=0&ndsp=20&ved=1t:429,r:0,s:0,i:146
Solar Energy 2012/2013
ZOUHIR ISMAIL 30
http://ecee.colorado.edu/~ecen4517/materials/refs/MPPT/FemiaP%26O2005.pdf
http://www.ni.com/white-paper/8106/en/
http://www.google.fr/imgres?um=1&sa=N&biw=1366&bih=664&hl=fr&tbm=isc
h&tbnid=Bt7ujT4NkGJHPM:&imgrefurl=http://energie-solaire.confort-
domicile.com/energie-solaire/dossier/779/techniques-pour-capter-l-energie-
solaire.html&docid=FN0Hn-mNqI1TQM&imgurl=http://energie-solaire.confort-
domicile.com/album/iStock_000009912571XSmall.jpg&w=426&h=282&ei=5D3E
Uem0Icqw0AWFg4CgCg&zoom=1&iact=hc&vpx=115&vpy=267&dur=245&ho
vh=140&hovw=212&tx=224&ty=97&page=2&tbnh=140&tbnw=212&start=21
&ndsp=28&ved=1t:429,r:43,s:0,i:297

Report

  • 1.
    ZOUHIR ISMAIL |ERASMUS REPORT | 2012/2013 Solar Energy MODELING OF PHOTOVOLAIC PANELS
  • 2.
    Solar Energy 2012/2013 ZOUHIRISMAIL 1 Summary Introduction ………………………………………………………………………….………………2 Mainstream renewable technologies ………………….…………………………………3 Wind power………………………………………………… …………………3 Hydropower………………………………………………………………………4 Biomass……………………………………………………………………………6 Solar energy……………………………………………… ……………………6 History of Photovoltaics …………………….…………………………………………………7 Objectives of my project…………….…………………………………………………………7 Solar cell structure…………….…………………………………………………..…………….8 Description of PV model………….………………………………………………….………9 Objectives of my project…………….…………………………………………………………8 Areas of operating PV model……………………………………………………………….14 V-I cures…………………………………………………………………………………..………....15 V-I curves for different radiations………………………………………………………15 V-P curves for different radiations………………………………………………………16 V-I curves for different temperatures………….………………………………………17 V-P curves for different temperatures……………………………………………..…18 Influence of series resistances………………………………………..……………………19 Influence of shunt resistances…………………………………………………………..…21 From modules to array……………………….……………………………….………………23 Serie/Parallel association…………………………………………………………23 Serie association……………………………………………..………………………24 Parallel association…………………………..………………………………………25 How to maximize energy (MPPT)………………………………..…………………………………………26 Conclusion……………………………………………………………………………………………………………...28 Bibliography……………………………………………………………………………………………………………29
  • 3.
    Solar Energy 2012/2013 ZOUHIRISMAIL 2 INTRODUCTION The use of renewable energy sources, such as solar, wind and hydraulic energies, is very old; they have been used since many centuries before our time but humans were more interested in using fossil fuels due to the low price of petroleum, so the renewable enegies were abandoned. During recent years, due to the increase in fossil fuel prices and the environmental problems caused by the use of conventional fuels, we are reverting back to renewable energy sources. Energy is called renewable because it is produced from inexhaustible resources. It has long been exploited fossil fuels or "energy stock": oil, coal, gas, primarily uranium. Clean, they improve the management of local resources and create jobs. One of these is solar power. In my project, i will focus on the solar energy and how does it work by using a software « Matlab » which will allow me to model PV panels and study their characterisitcs.
  • 4.
    Solar Energy 2012/2013 ZOUHIRISMAIL 3 Mainstream renewable technologies Before to start talking about the solar panel, its characteristics and how does it works, let’s have an idea about the main sources of renewable enrgies. Wind power : An easy method to produce electricity is wind energy: the supplied by the wind. The device able to perform this conversion is called wind generator, this consists of a mechanical system of rotation which is powered by blades as in old windmills. This rotary system is connected to an electric generator whose axis joined to the driving system. In this way the wind, forcing the blades to turn, drives the electric generator which can be either a dynamo or an alternator (the alternator, in comparison to the dynamo, presents the advantage of a higher efficiency).
  • 5.
    Solar Energy 2012/2013 ZOUHIRISMAIL 4 Hydropower : Hydropower is a very low-emission energy greenhouse gas emissions. This renewable energy source uses the movement of water powered by the sun and gravity through the water cycle, tides and ocean currents. They use the waterfalls, natural (waterfalls) or artificial (hydroelectric dams), the flow of rivers and ocean currents (tidal thermohaline circulation ...), hydropower plants produce mechanical energy converted mostly to electricity. The hydraulic energy represents 19% of total electricity production in the world and 13% in France. This is the most used renewable energy source. However, all the world's hydroelectric potential has not yet been exploited.
  • 6.
    Solar Energy 2012/2013 ZOUHIRISMAIL 5 Biomass : Biomass is the second renewable energy in the world. It produces electricity, heat via combustion of wastes and residues of plant and animal organic matter.Through the process of photosythesis, plants capture the sun's energy. When the plants are burnt, they release the sun's energy they contain. In this way, biomass functions as a sort of natural battery for storing solar energy. Solar Energy Photovoltaic solar energy comes from the conversion of sunlight into electricity in semiconductor materials such as silicon or covered with a thin metallic layer. These photosensitive materials have the property of releasing their electrons under the influence of external energy. This is the photovoltaic effect. A photovoltaic solar generator consists of photovoltaic modules themselves compound of interconnected photovoltaic cells.
  • 7.
    Solar Energy 2012/2013 ZOUHIRISMAIL 6 Solar Energy History of photovoltaics panels : Photovoltaics is the process of converting sunlight directly into electricity using solar cells. Today it is a rapidly growing and increasingly important renewable alternative to conventional fossil fuel electricity generation, but compared to other electricity generating technologies, it is a relative newcomer, with the first practical photovoltaic devices demonstrated in the 1950s. Research and development of photovoltaics received its first major boost from the space industry in the 1960s which required a power supply separate from "grid" power for satellite applications. These space solar cells were several thousand times more expensive than they are today and the perceived need for an electricity generation method apart from grid power was still a decade away, but solar cells became an interesting scientific variation to the rapidly expanding silicon transistor development with several potentially specialized niche markets. It took the oil crisis in the 1970s to focus world attention on the desirability of alternate energy sources for terrestrial use, which in turn promoted the investigation of photovoltaics as a means of generating terrestrial power. Although the oil crisis proved short-lived and the financial incentive to develop solar cells abated, solar cells had entered the arena as a power generating technology. Their application and advantage to the "remote" power supply area was quickly recognized and prompted the development of terrestrial photovoltaics industry. Small scale transportable applications (such as calculators and watches) were utilised and remote power applications began to benefit from photovoltaics. In the 1980s research into silicon solar cells paid off and solar cells began to increase their efficiency. In 1985 silicon solar cells achieved the milestone of 20% efficiency. Over the next decade, the photovoltaic industry experienced steady growth rates of between 15% and 20%, largely promoted by the remote power supply market. The year 1997 saw
  • 8.
    Solar Energy 2012/2013 ZOUHIRISMAIL 7 a growth rate of 38% and today solar cells are recognized not only as a means for providing power and increased quality of life to those who do not have grid access, but they are also a means of significantly diminishing the impact of environmental damage caused by conventional electricity generation in advanced industrial countries. Objectives of my project : Describe model of PV cell Characterize V-I & V-P curves for different radiations G. Characterize V-I & V-P curves for different temperatures T. Study the influence Rs. Study the influence of parrallel resistance Rsh. Associate cells. Propose algorythms to maximize energy.
  • 9.
    Solar Energy 2012/2013 ZOUHIRISMAIL 8 Solar Cell Structure A solar cell is an electronic device which directly converts sunlight into electricity. Light shining on the solar cell produces both a current and a voltage to generate electric power. This process requires firstly, a material in which the absorption of light raises an electron to a higher energy state, and secondly, the movement of this higher energy electron from the solar cell into an external circuit. The electron then dissipates its energy in the external circuit and returns to the solar cell. The basic steps in the operation of a solar cell are: The light absorption in the material The transfer of light energy to the electrons The dissipation of power in the load and in parasitic resistances.
  • 10.
    Solar Energy 2012/2013 ZOUHIRISMAIL 9 Description of a PV model A photovoltaic cell converts the solar energy into the electrical energy by the photovoltaic effect. Solar cells are widely used in terrestrial and space applications. The photovoltaic cells must be operated at their maximum power point. The maximum power point varies with illumination, temperature, radiation dose and other ageing effects. A PV cell can be modeled by a current generator in parallel with a diode. The photo current (Il) is a function of the solar irradiation. A series resistor Rs and a parallel resistor represent respectively the voltage loss and the leakage current of the cell. The diode D characterises the non linear behavior of the cell and the dependency of its performance on ambient temperature.
  • 11.
    Solar Energy 2012/2013 ZOUHIRISMAIL 10 Figure 2: The circuit diagram of the PV model with shunt resistance The equations which describe the I-V characteristics of the cell are:  IL: photo current  Temperature dependence of the photo current IL.  Series resistance Rs, which gives a more accurate shape between the maximum power point and the open circuit voltage.  Shunt resistance Rsh in parallel with the diode.  Either allowing the diode quality factor n to be- come a variable parameter (instead of being fixed at either 1 or 2) or introducing two parallel diodes (one with A =1, one with A =2) with indepen- dently set saturation currents.
  • 12.
    Solar Energy 2012/2013 ZOUHIRISMAIL 11 Modelisation of a PV cell on Simulink Create Subsystem 2 - 1 + PSS Simulink-PS Converter Rsh Rs +- DiodeControlled Current Source 1 E E + - Solar panel
  • 13.
    Solar Energy 2012/2013 ZOUHIRISMAIL 12 ==> We will simulate the model of the solar panel to verify its characteristics. Figure 3 : Modeling of PV panel on Matlab/Simulink Objectives :  Characterise V-I & V-P curves for different radiations G.  Characterise V-I & V-P curves for different temperatures
  • 14.
    Solar Energy 2012/2013 ZOUHIRISMAIL 13 In the above representation of I-V characteristic, a sign convention is used, which takes as positive the current generated by the cell when the sun is shining and a positive voltage is applied on the cell’s terminals. A real solar cell can be characterized by the following fundamental parameters: - Short Circuit Current: It is the greatest value of the current generated by a cell. It is produced under short circuit conditions: V = 0 - Open circuit voltage: Corresponds to the voltage drop across the diode (p-n junction), when it is traversed by the photocurrent Iph (namely ID=Iph) when the generator current is I = 0. It reflects the voltage of the cell in the night, - Maximum power point:Is the operating point A (Vmax, Imax) at which the power dissipated in the resistive load is maximum: Pmax = Imax * Vmax - Maximum efficiency: Is the ratio between the maximum power and the incident light power Figure 4 : Characteristics I-V of PV cell
  • 15.
    Solar Energy 2012/2013 ZOUHIRISMAIL 14 Areas of operation of solar module AREA 1 AREA 2 AREA3 Figure 5 : Different operating areas AREA 1 : the current remains constant regardless of the voltage, PV generator operates as a current generator AREA 2 : it’s the best area for the operation of the generator, where the point optimal (characterized by a maximum power) can be determined. AREA 3 : that zone is characterized by a change in current corresponding to voltage nearly constant, in which case the generator is similar to a voltage generator. 0 5 10 15 20 25 0 0.5 1 1.5 2 2.5 3 3.5 4 Current(A) V-I curves for G=1000W/m² Voltage (V)
  • 16.
    Solar Energy 2012/2013 ZOUHIRISMAIL 15 1) V-P curves for differents radiations Figure 6 : Variation of current with different radiations This simulation allows the appearance of values given by the manufacturers and those features that are found on the model. From this simulation, we have: Power max = 59,83 W and Voc= 17.1 V ===> Simulation Power max = 60 W and Voc= 17,1 V ===> Manufacturers The simulation results and those found on the label manufacturers are almost the same. 0 5 10 15 20 25 0 10 20 30 40 50 60 X: 17.1 Y: 59.83 Voltage (V) Power(W) V-P curves for different radiations 400W/m² 600W/m² 800W/m² 1000W/m²
  • 17.
    Solar Energy 2012/2013 ZOUHIRISMAIL 16 2) V-I curves for differents radiations Figure 7 : Variation of power output with different radiations It can be observed from this figure that the short circuit current decreases with decrease when the the radiation is increased. Regarding the maximum power output of a photovoltaic cell, it is clear that when the irradiance is higher, the cell generates more power. Obviously, irradiance has a large effect on short-circuit current. 0 5 10 15 20 25 0 0.5 1 1.5 2 2.5 3 3.5 4 Current(A) Voltage (V) V-I curves for different radiations 400W/m² 600W/m² 800W/m² 1000W/m²
  • 18.
    Solar Energy 2012/2013 ZOUHIRISMAIL 17 1) V-I curves for differents temperatures Figure 8 : Variation of current output with different temperatures If the temperature increases with a constant radiation, the open circuit voltage Voc decreases with temperature. Increase the temperature  Voc is low. The influence of temperature on Isc can be neglected in most cases. 0 5 10 15 20 25 0 0.5 1 1.5 2 2.5 3 3.5 4 Voltage (V) Current(A) V-I curves for different temperatures The temperature increases
  • 19.
    Solar Energy 2012/2013 ZOUHIRISMAIL 18 2) V-P curves for differents temperatures Figure 9 : Variation of power output with different temperatures This figure displays the response of a solar cell to varying temperature. You have to know that Contrary to popular belief, the efficiency of a solar cell decreases with increasing temperature. The reason for this, is that a higher temperature increases the conductivity of the semiconductor. 0 5 10 15 20 25 0 10 20 30 40 50 60 V-P curves for different temperatures Voltage (V) Power(W) The temperature increases
  • 20.
    Solar Energy 2012/2013 ZOUHIRISMAIL 19 Radiations and temperatures are the two main parameters that modify the characteristics of PV cells. These parameters should be carefully considered when setting up solar panels. The influence of Series Resistances Series resistance in a solar cell has three causes: firstly, the movement of current through the emitter and base of the solar cell; secondly, the contact resistance between the metal contact and the silicon; and finally the resistance of the top and rear metal contacts. The main impact of series resistance is to reduce the fill factor, although excessively high values may also reduce the short-circuit current. Figure 10 : Schematic of a solar cell with series resistance. For the simulation, I increase the value of Rs : Rs 2.5 * Rs 3.5 * Rs 20 * Rs
  • 21.
    Solar Energy 2012/2013 ZOUHIRISMAIL 20 Figure 11 : Influence of Serie Resistance The series resistance react on the slope of the characteristic I-V in the area where PV generator operates as a voltage generator. It does not affect the open-circuit voltage, and when R is too high, it decreases the value of curent short-circuit. 0 5 10 15 20 25 0 0.5 1 1.5 2 2.5 3 3.5 4 Voltage (V) Current(A) Influence on Rs rs 2.5rs 3.5rs 20rs
  • 22.
    Solar Energy 2012/2013 ZOUHIRISMAIL 21 The influence of Shunt Resistances Significant power losses caused by the presence of a shunt resistance, RSH, are typically due to manufacturing defects, rather than poor solar cell design. Low shunt resistance causes power losses in solar cells by providing an alternate current path for the light-generated current. Such a diversion reduces the amount of current flowing through the solar cell junction and reduces the voltage from the solar cell. The effect of a shunt resistance is particularly severe at low light levels, since there will be less light-generated current. The loss of this current to the shunt therefore has a larger impact. In addition, at lower voltages where the effective resistance of the solar cell is high, the impact of a resistance in parallel is large. Figure 14 : Circuit diagram of a solar cell including the shunt resistance.
  • 23.
    Solar Energy 2012/2013 ZOUHIRISMAIL 22 Figure 15 : Influence of Shunt Resistance In general, the shunt resistance is elevated, its effect is noticed especially in the part of the current generation. The effect of the shunt resistor on the curve results in a slight decrease in the open circuit voltage and an increase of the slope of the curve in the cell area corresponding to operation as a current source. 0 5 10 15 20 25 0 0.5 1 1.5 2 2.5 3 3.5 4 Voltage (V) Current(A) Influence of Rsh 1000 Ohms 150 Ohms 20 Ohms
  • 24.
    Solar Energy 2012/2013 ZOUHIRISMAIL 23 From Modules to Arrays A PV module consists of a number of interconnected solar cells (typically 36 connected in series) encapsulated into a single, long-lasting, stable unit. Serie/Parallel Association  When highpower is needed 0 5 10 15 20 25 30 35 40 45 0 1 2 3 4 5 6 7 8 Current(A) Voltage (V) V-I curves for serie/parallel association 1 solar panel 4 solar panels (serie/parallel)
  • 25.
    Solar Energy 2012/2013 ZOUHIRISMAIL 24 Association in serie  at any given current (which flows through each of themodules), the total voltage is just the sum of the individual module voltages Matlab Simulation 0 5 10 15 20 25 30 35 40 45 0 0.5 1 1.5 2 2.5 3 3.5 4 Voltage (V) Current(A) V-I curves for serie association 1 Solar panel 2 solar panels
  • 26.
    Solar Energy 2012/2013 ZOUHIRISMAIL 25 Association in parallel  at any given voltage, the I–V curve of the parallel combination is just the sum of the individual module currents at that voltage. 0 5 10 15 20 25 0 1 2 3 4 5 6 7 8 Voltage (V) Current(A) I-V cures for parallel association 1 Solar panel 2 solar panels
  • 27.
    Solar Energy 2012/2013 ZOUHIRISMAIL 26 How to maximise Energy Solar cells have a complex relationship between solar irradiation, temperature and total resistance that produces a non-linear output efficiency which can be analyzed based on the I-V curve. To get the maximum possible power from one or more photovoltaic devices, typically solar panels though optical power transmission systems can benefit from similar technology we use a technique called : Maximum power point tracking (MPPT) Maximum power point trackers may implement different algorithms and switch between them based on the operating conditions of the array and one of this algorithm : Perturb and Observe The concept behind the “perturb and observe” method is to modify the operating voltage or current of the photovoltaic panel until you obtain maximum power from it. For example, if increasing the voltage to a cell increases the power output of a cell, the system increases the operating voltage until the power output begins to decrease. Once this happens, the voltage is decreased to get back to the maximum power output value. This process continues until the maximum power point is reached. Thus, the power output value oscillates around a maximum power value until it stabilizes. Perturb and observe is the most commonly used MPPT method due to its ease of implementation.
  • 28.
    Solar Energy 2012/2013 ZOUHIRISMAIL 27 Figure 15 : Algorithm of P&O method One of the major drawbacks of the perturb and observe method is that the power obtained oscillates around the maximum power point in steady state operation. Also, this algorithm can track in the wrong direction under rapidly varying irradiance levels.
  • 29.
    Solar Energy 2012/2013 ZOUHIRISMAIL 28 Conclusion The work presented in this report concerns the modeling of a photovoltaic panel. The study is based on the impact of various parameters on I (V) and P (V) characteristics of a system of photovoltaic panels. The solar cell acts as a generator: - Current generator - Voltage generator The characteristic of I (V) is influenced by many parameters: temperatures, radiations, serie resistance, shunt resistance. I found from the result that in the association of cells in series, for a constant current, the voltage increases, and in association of cells in parallel, for a constant voltage, the current increases. In another phase, I was looking for the maximum power that can be extracted from a photovoltaic panel. Indeed, the production of electric energy using a photovoltaic panel has an optimum operating point. This optimum point has the characteristic to change with the temperature and illumination. I want to thank Roberto Villafafila for monitoring and assistance has given me and the people who work in international relations office who gave me this chance to live a great experience, an experience I'd retried the coming years.
  • 30.
    Solar Energy 2012/2013 ZOUHIRISMAIL 29 Bibliography http://pveducation.org/ http://www.intechopen.com/books/new-developments-in-renewable- energy/modeling-of-photovoltaic-cell-using-free-software-application-for-training- and-design-circuit-in-pho http://users.utcluj.ro/~atn/papers/ATN_1_2008_8.pdf http://etd.ohiolink.edu/send- pdf.cgi/Dzimano%20Gwinyai%20J.pdf?osu1228307443 http://www.google.fr/imgres?hl=fr&biw=1366&bih=664&tbm=isch&tbnid=HRv 8LOiKjH- EwM:&imgrefurl=http://provemploi.blog.regionsjob.com/index.php/post/2009/04/ 30/Le-secteur-de-l%25E2%2580%2599%25C3%25A9nergie-renouvelable- embauche-en- masse&docid=ucSyuR8PLXM4AM&imgurl=http://provemploi.blog.regionsjob.co m/public/energie- renouvelable.jpg&w=335&h=335&ei=OzzEUcKlOeKU0AXm7oH4BQ&zoom=1 &iact=hc&vpx=305&vpy=241&dur=32&hovh=225&hovw=225&tx=150&ty=12 3&page=1&tbnh=145&tbnw=149&start=0&ndsp=20&ved=1t:429,r:2,s:0,i:167 http://www.google.fr/imgres?um=1&hl=fr&biw=1366&bih=664&tbm=isch&tbni d=IH2YNzauWCvXzM:&imgrefurl=http://www.alternative-energy- news.info/technology/hydro/&docid=DaJJBccwebH7JM&imgurl=http://www.alte rnative-energy-news.info/images/technical/hydro- power.jpg&w=550&h=411&ei=fTzEUeT5IsqT0QWG4IDwAw&zoom=1&iact=hc &vpx=12&vpy=267&dur=300&hovh=175&hovw=235&tx=134&ty=134&page= 1&tbnh=149&tbnw=200&start=0&ndsp=20&ved=1t:429,r:0,s:0,i:146
  • 31.
    Solar Energy 2012/2013 ZOUHIRISMAIL 30 http://ecee.colorado.edu/~ecen4517/materials/refs/MPPT/FemiaP%26O2005.pdf http://www.ni.com/white-paper/8106/en/ http://www.google.fr/imgres?um=1&sa=N&biw=1366&bih=664&hl=fr&tbm=isc h&tbnid=Bt7ujT4NkGJHPM:&imgrefurl=http://energie-solaire.confort- domicile.com/energie-solaire/dossier/779/techniques-pour-capter-l-energie- solaire.html&docid=FN0Hn-mNqI1TQM&imgurl=http://energie-solaire.confort- domicile.com/album/iStock_000009912571XSmall.jpg&w=426&h=282&ei=5D3E Uem0Icqw0AWFg4CgCg&zoom=1&iact=hc&vpx=115&vpy=267&dur=245&ho vh=140&hovw=212&tx=224&ty=97&page=2&tbnh=140&tbnw=212&start=21 &ndsp=28&ved=1t:429,r:43,s:0,i:297