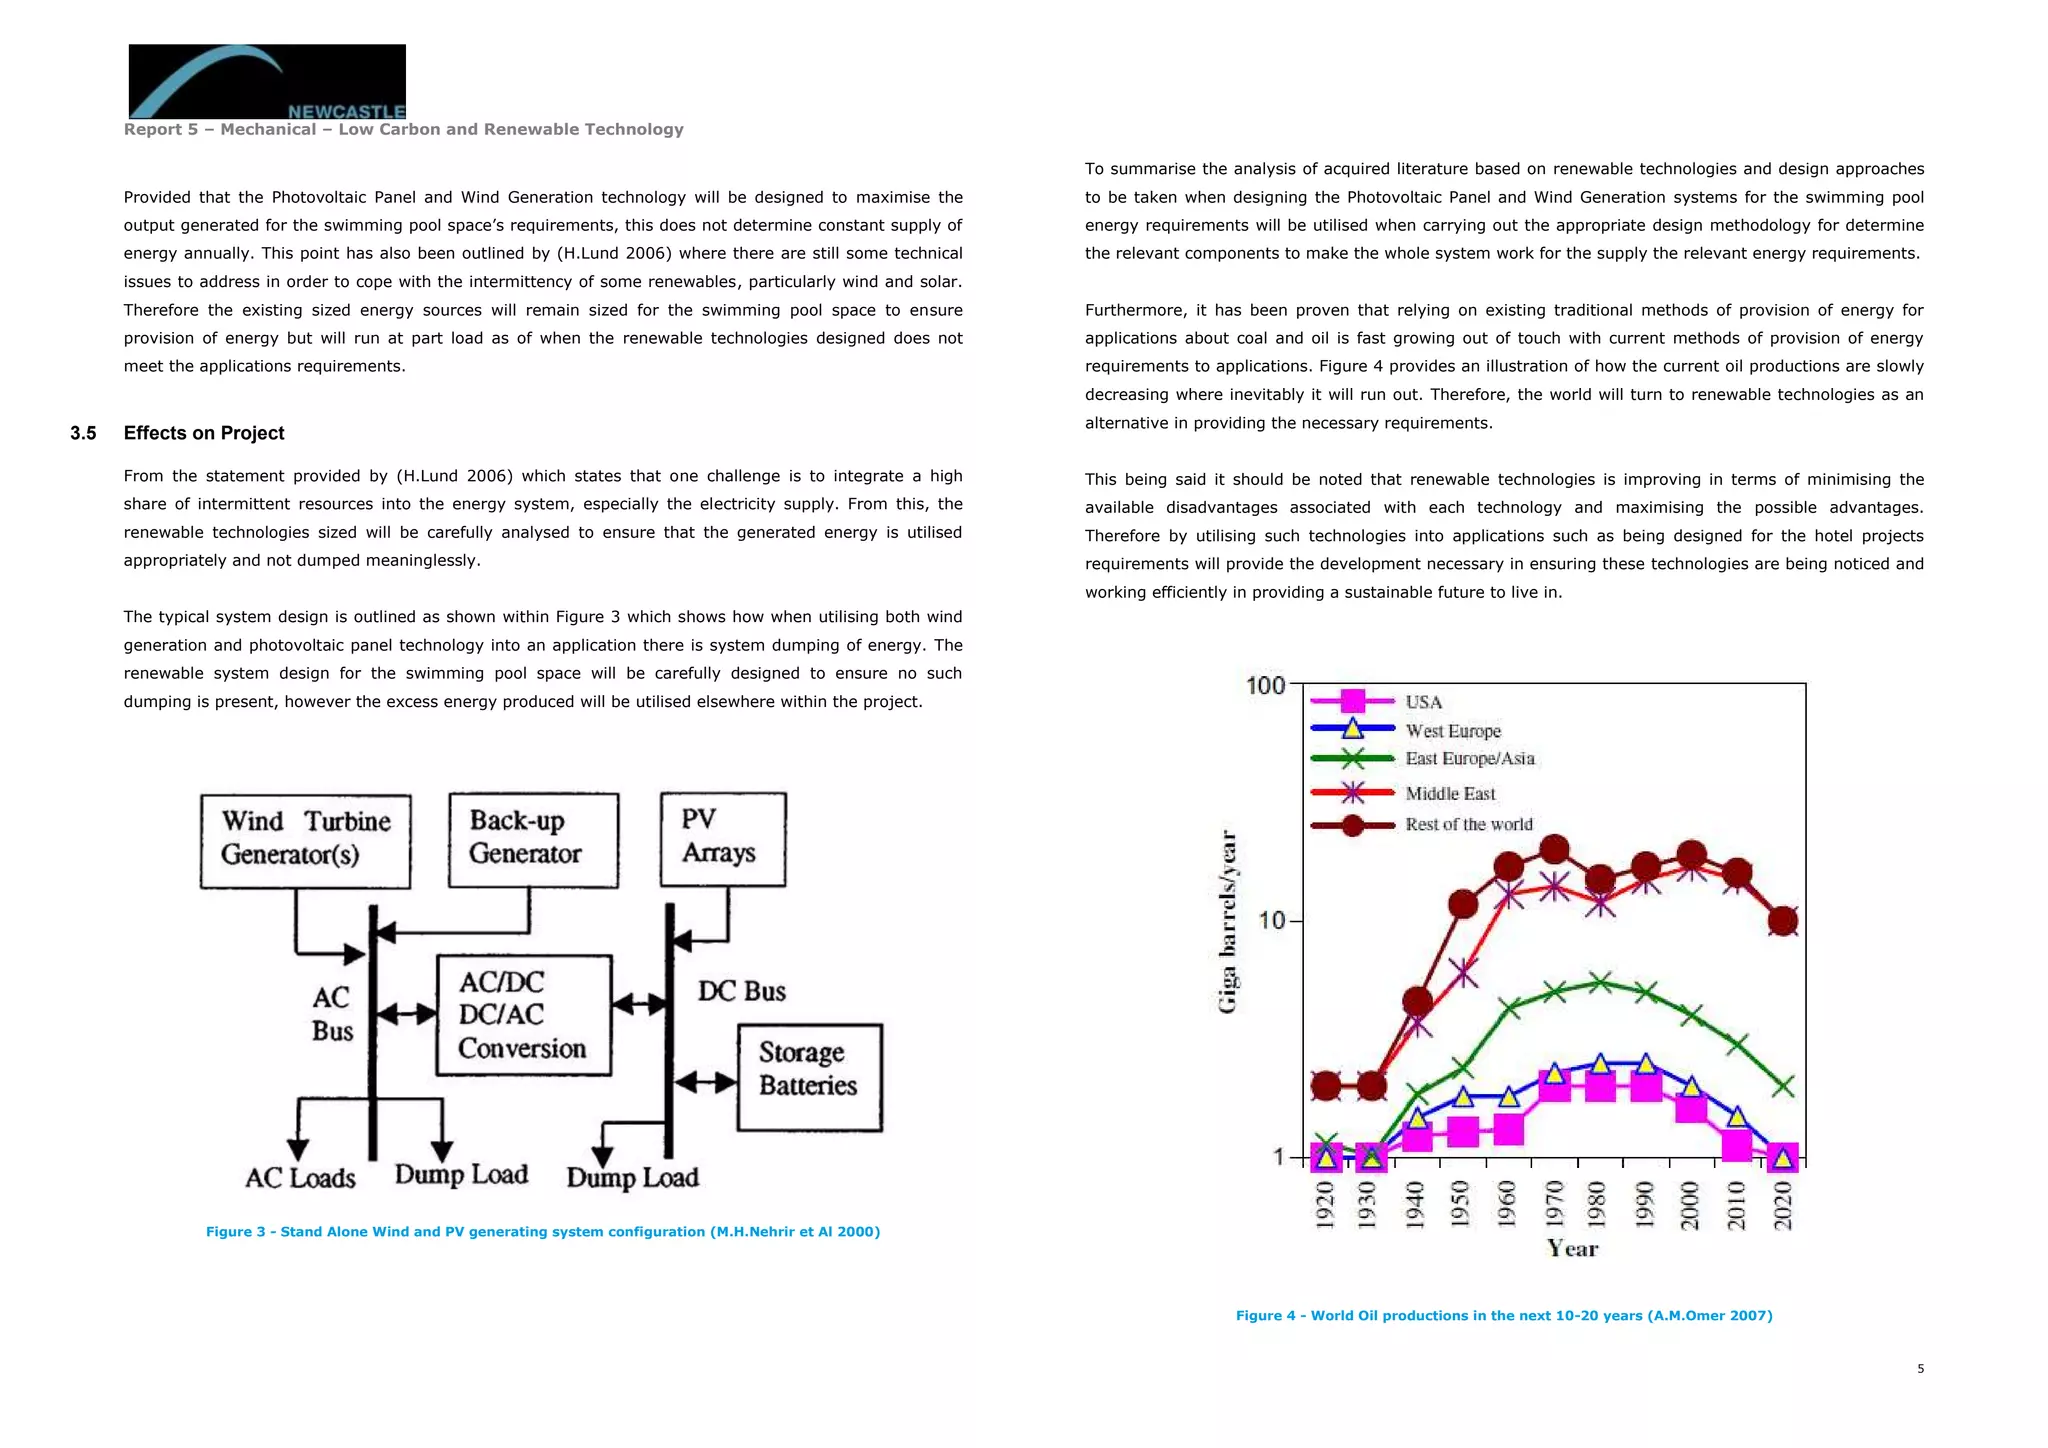
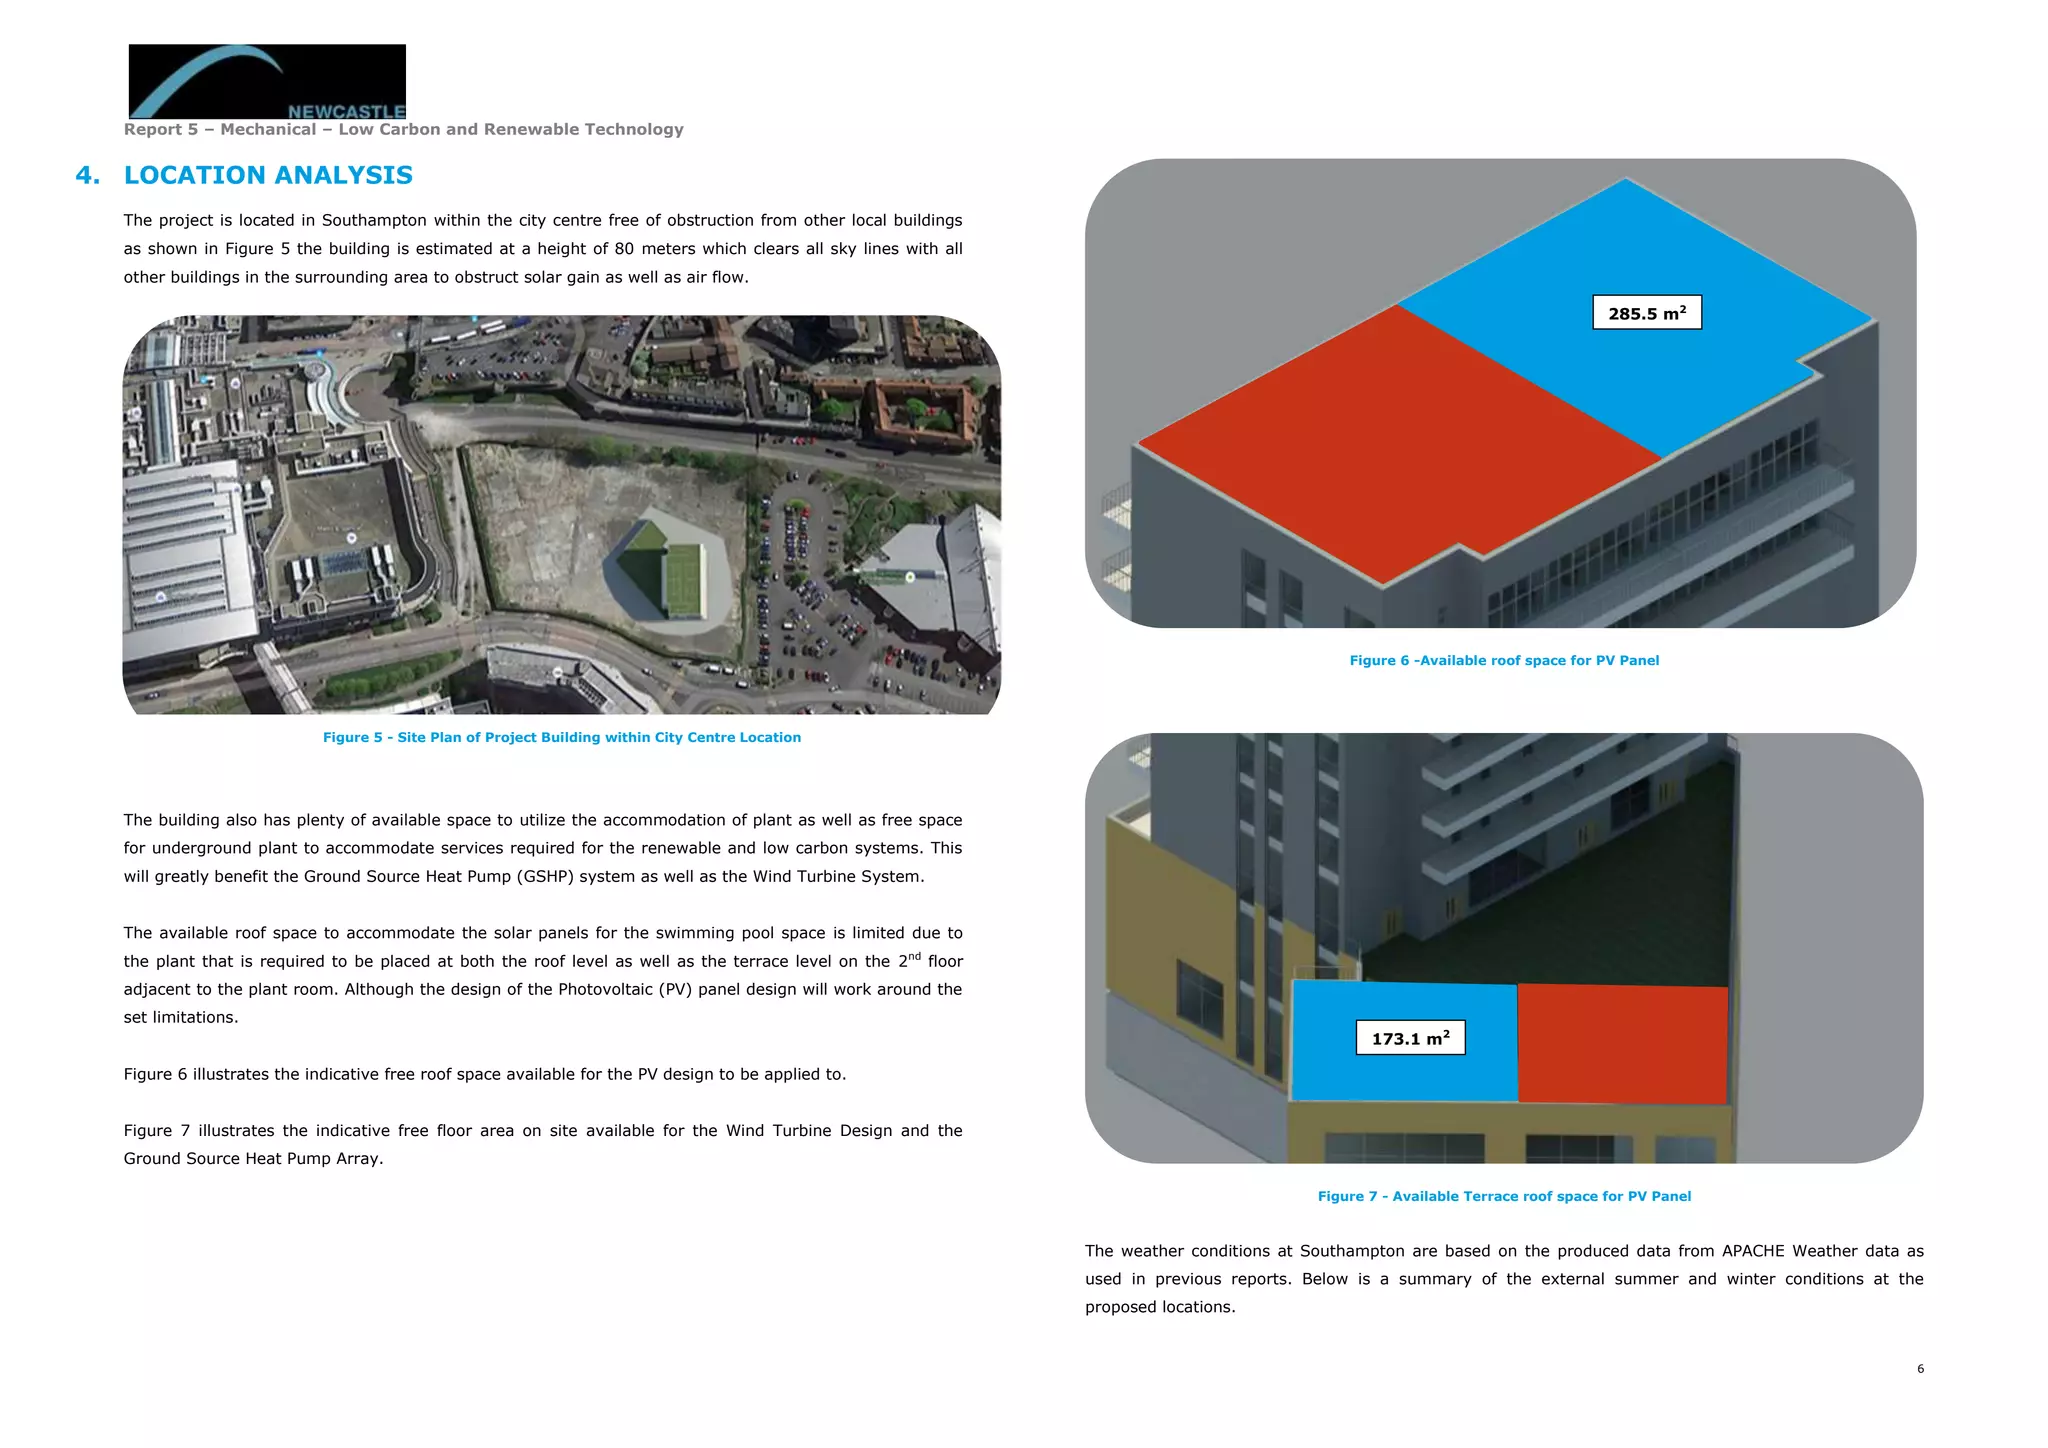
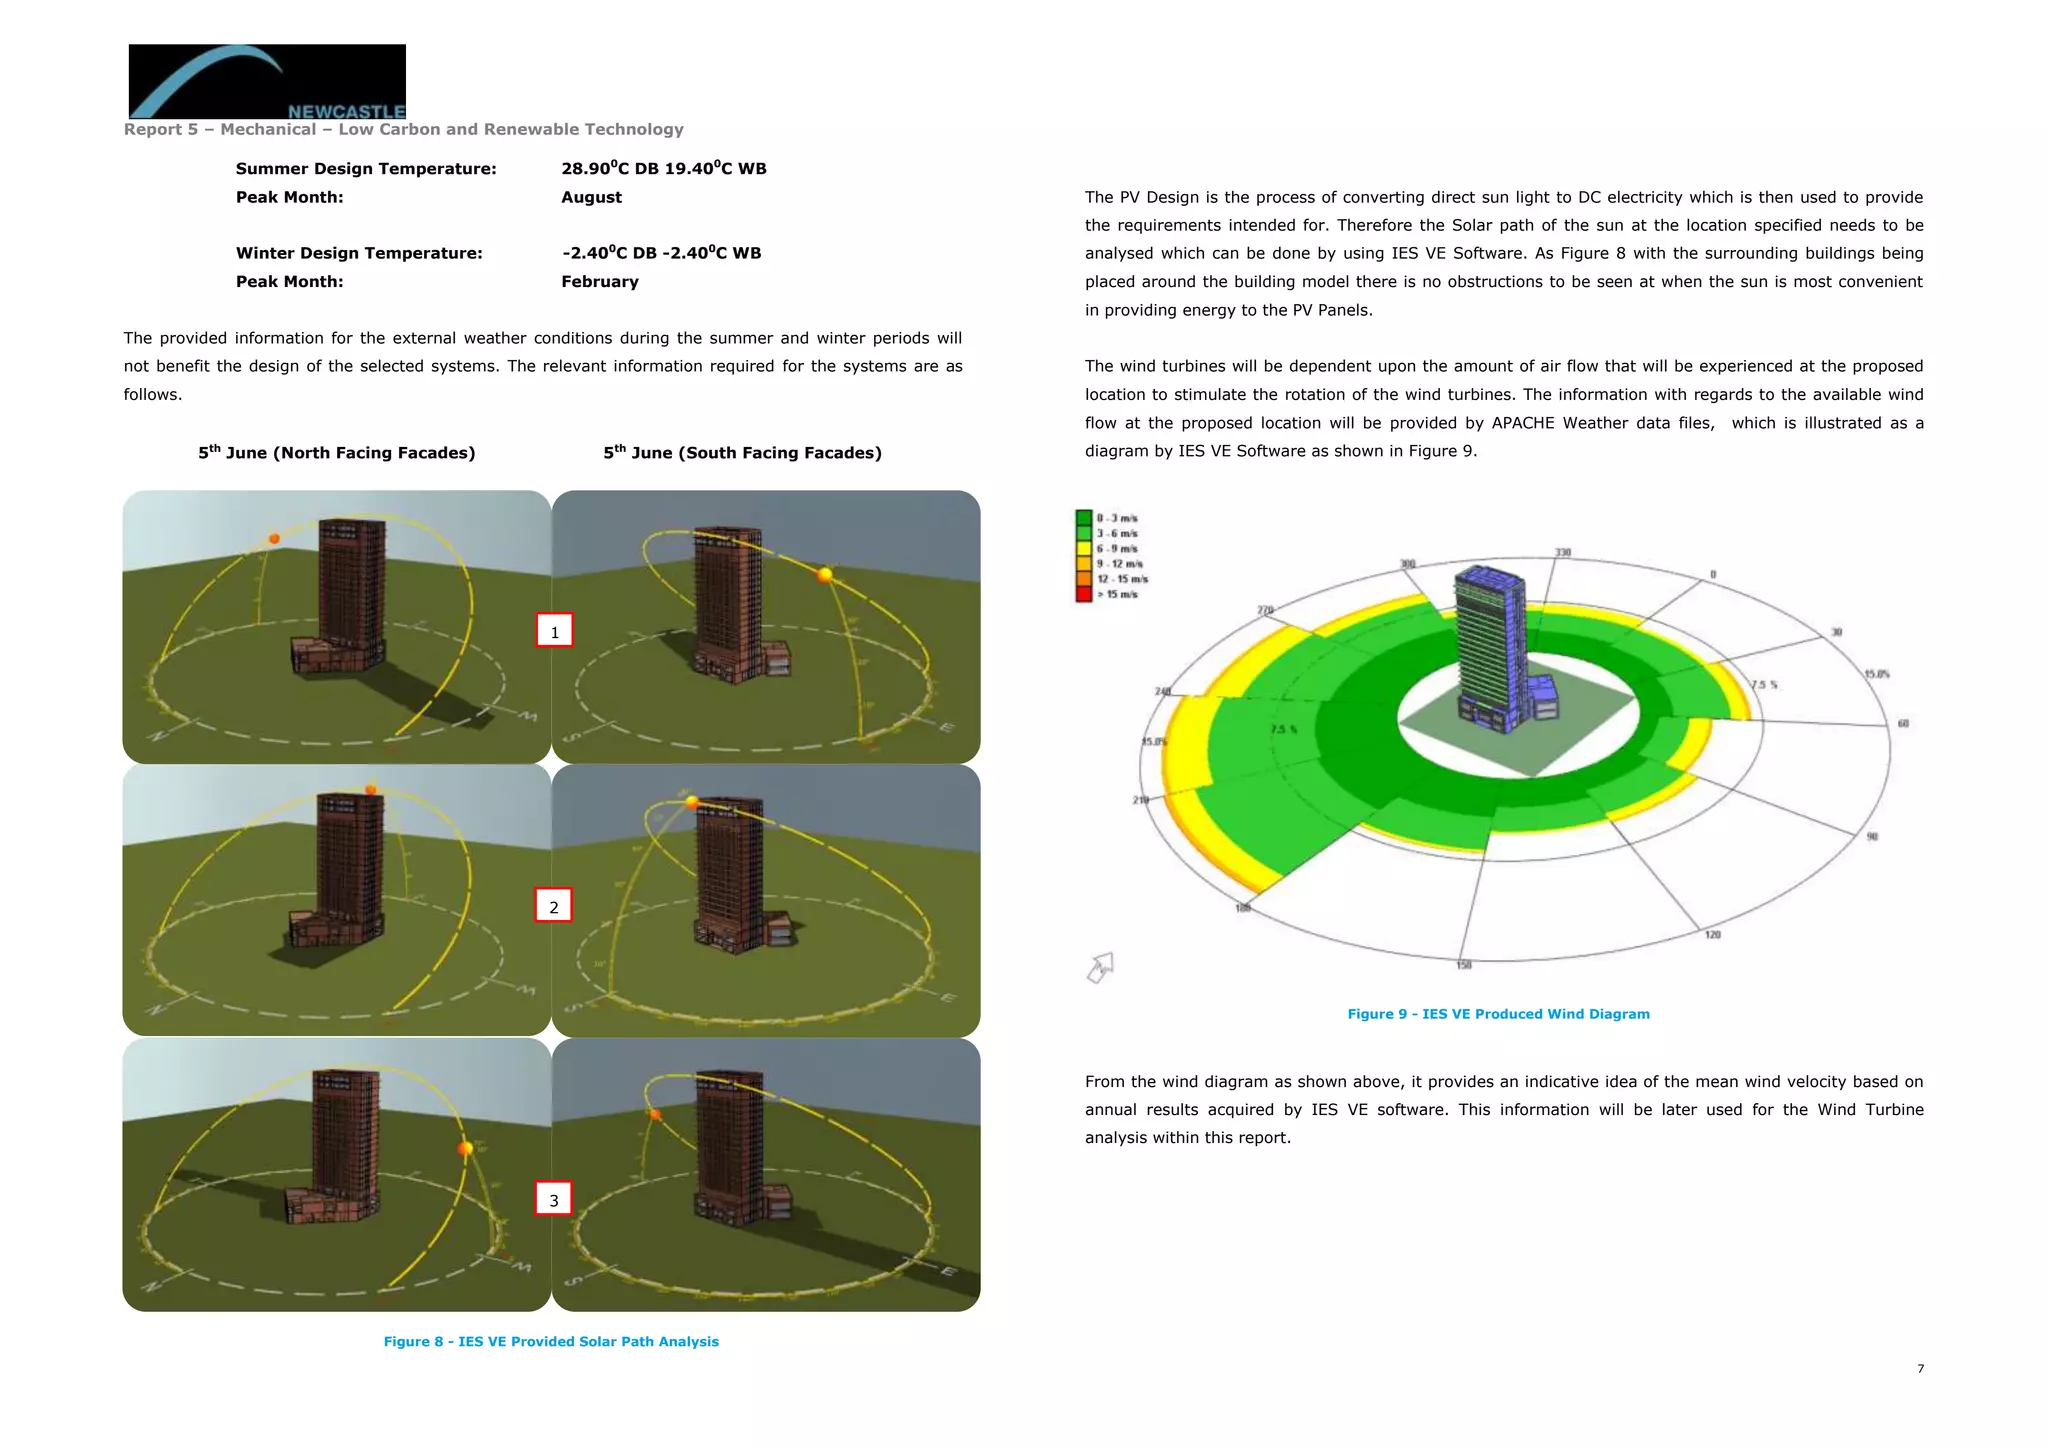
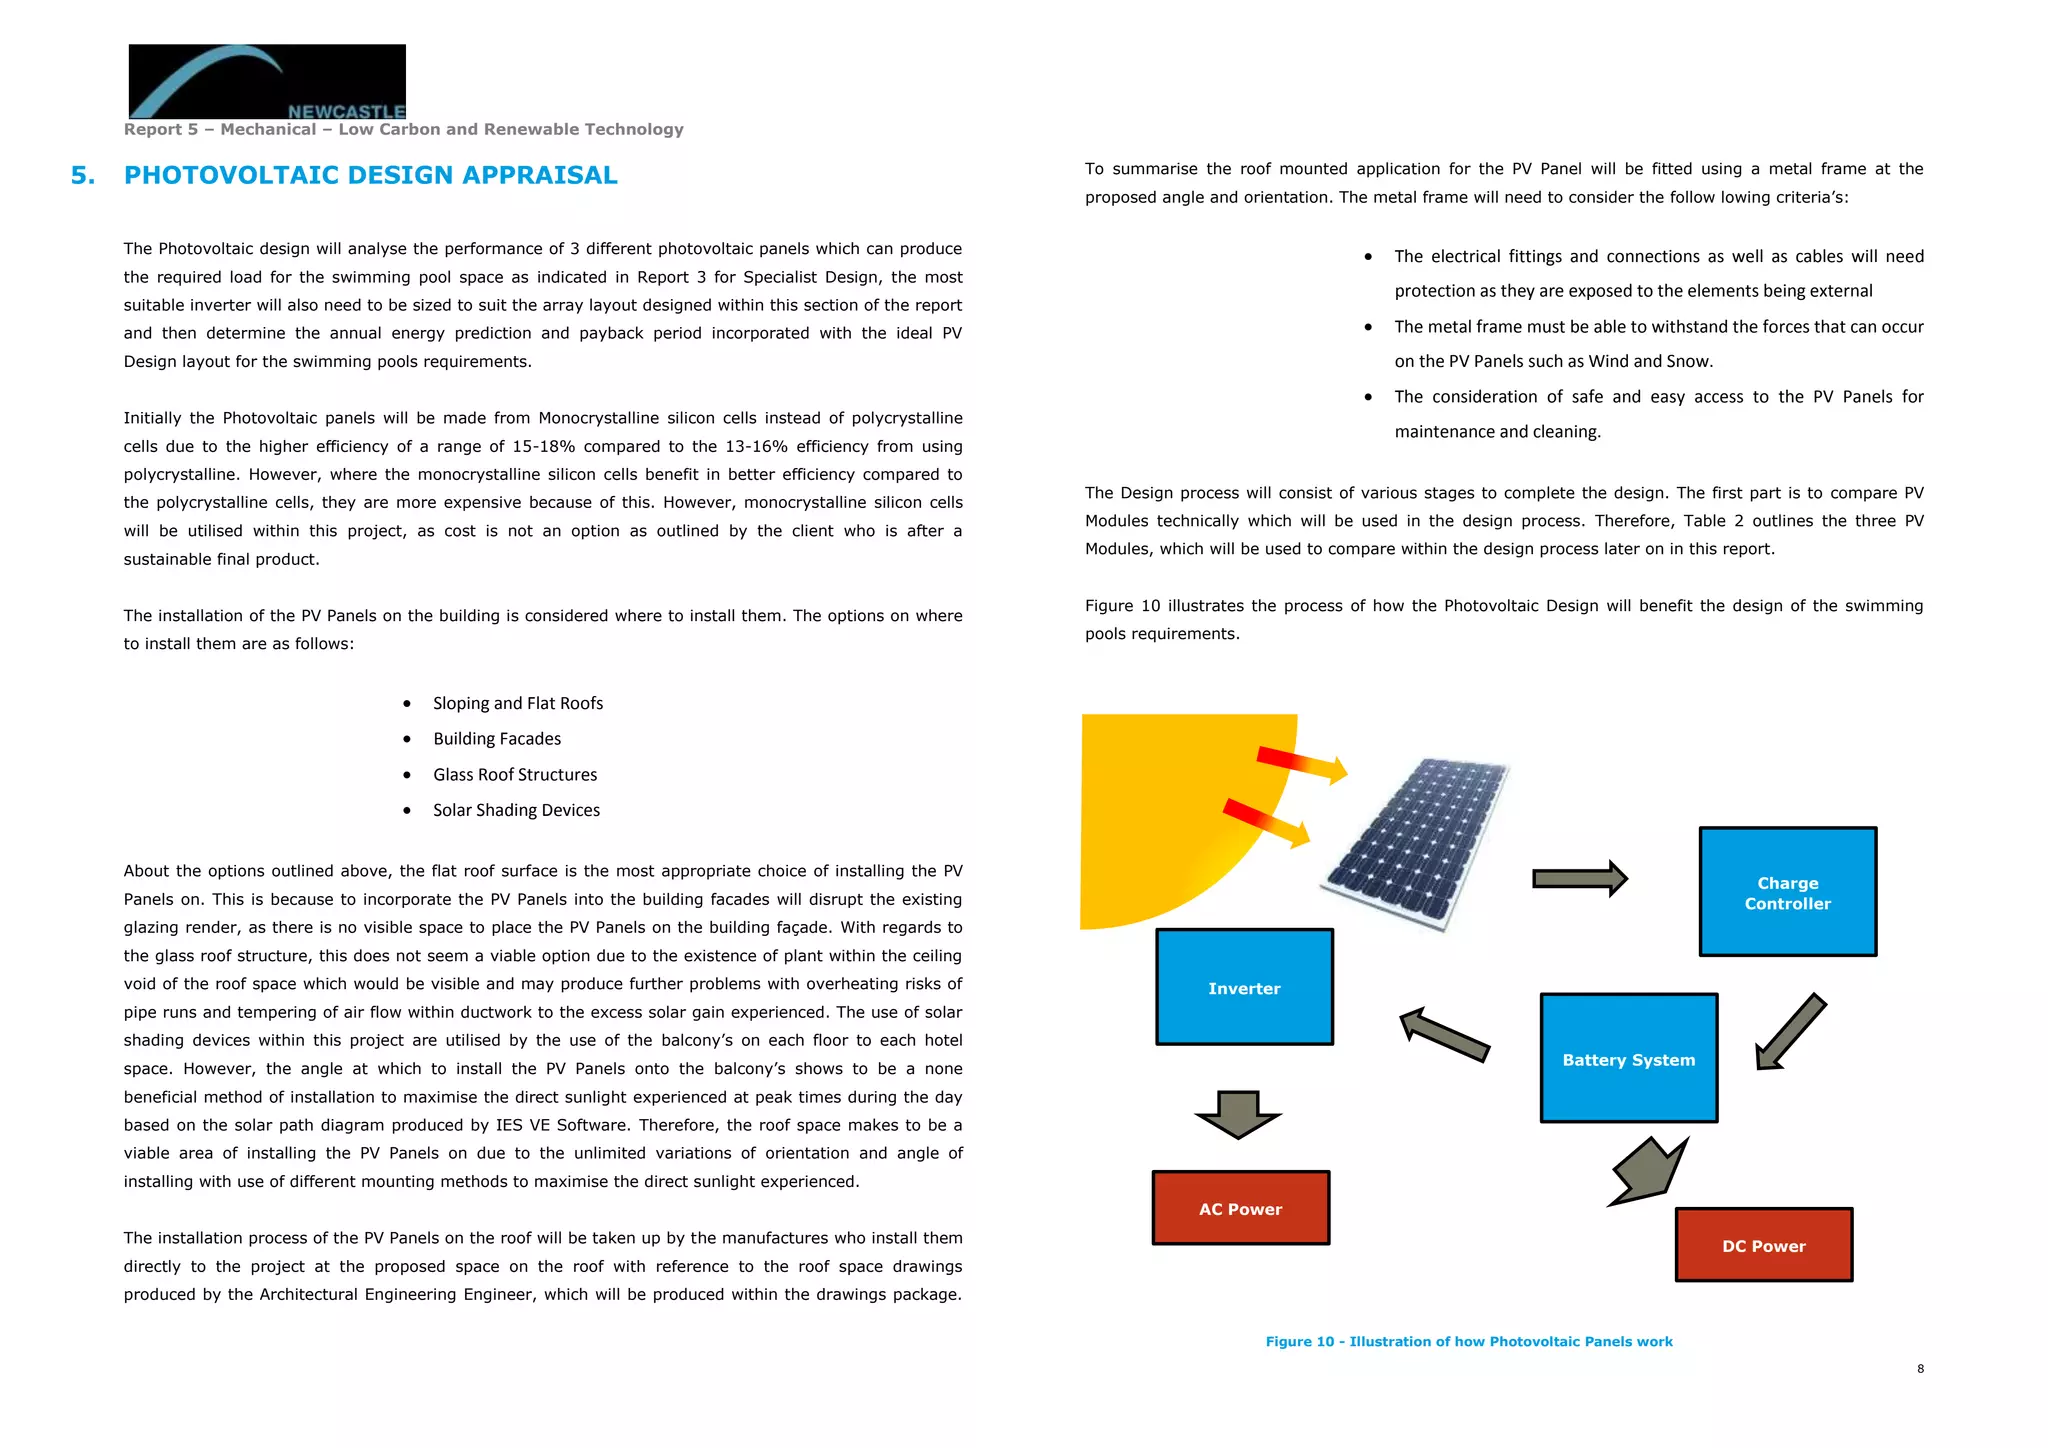
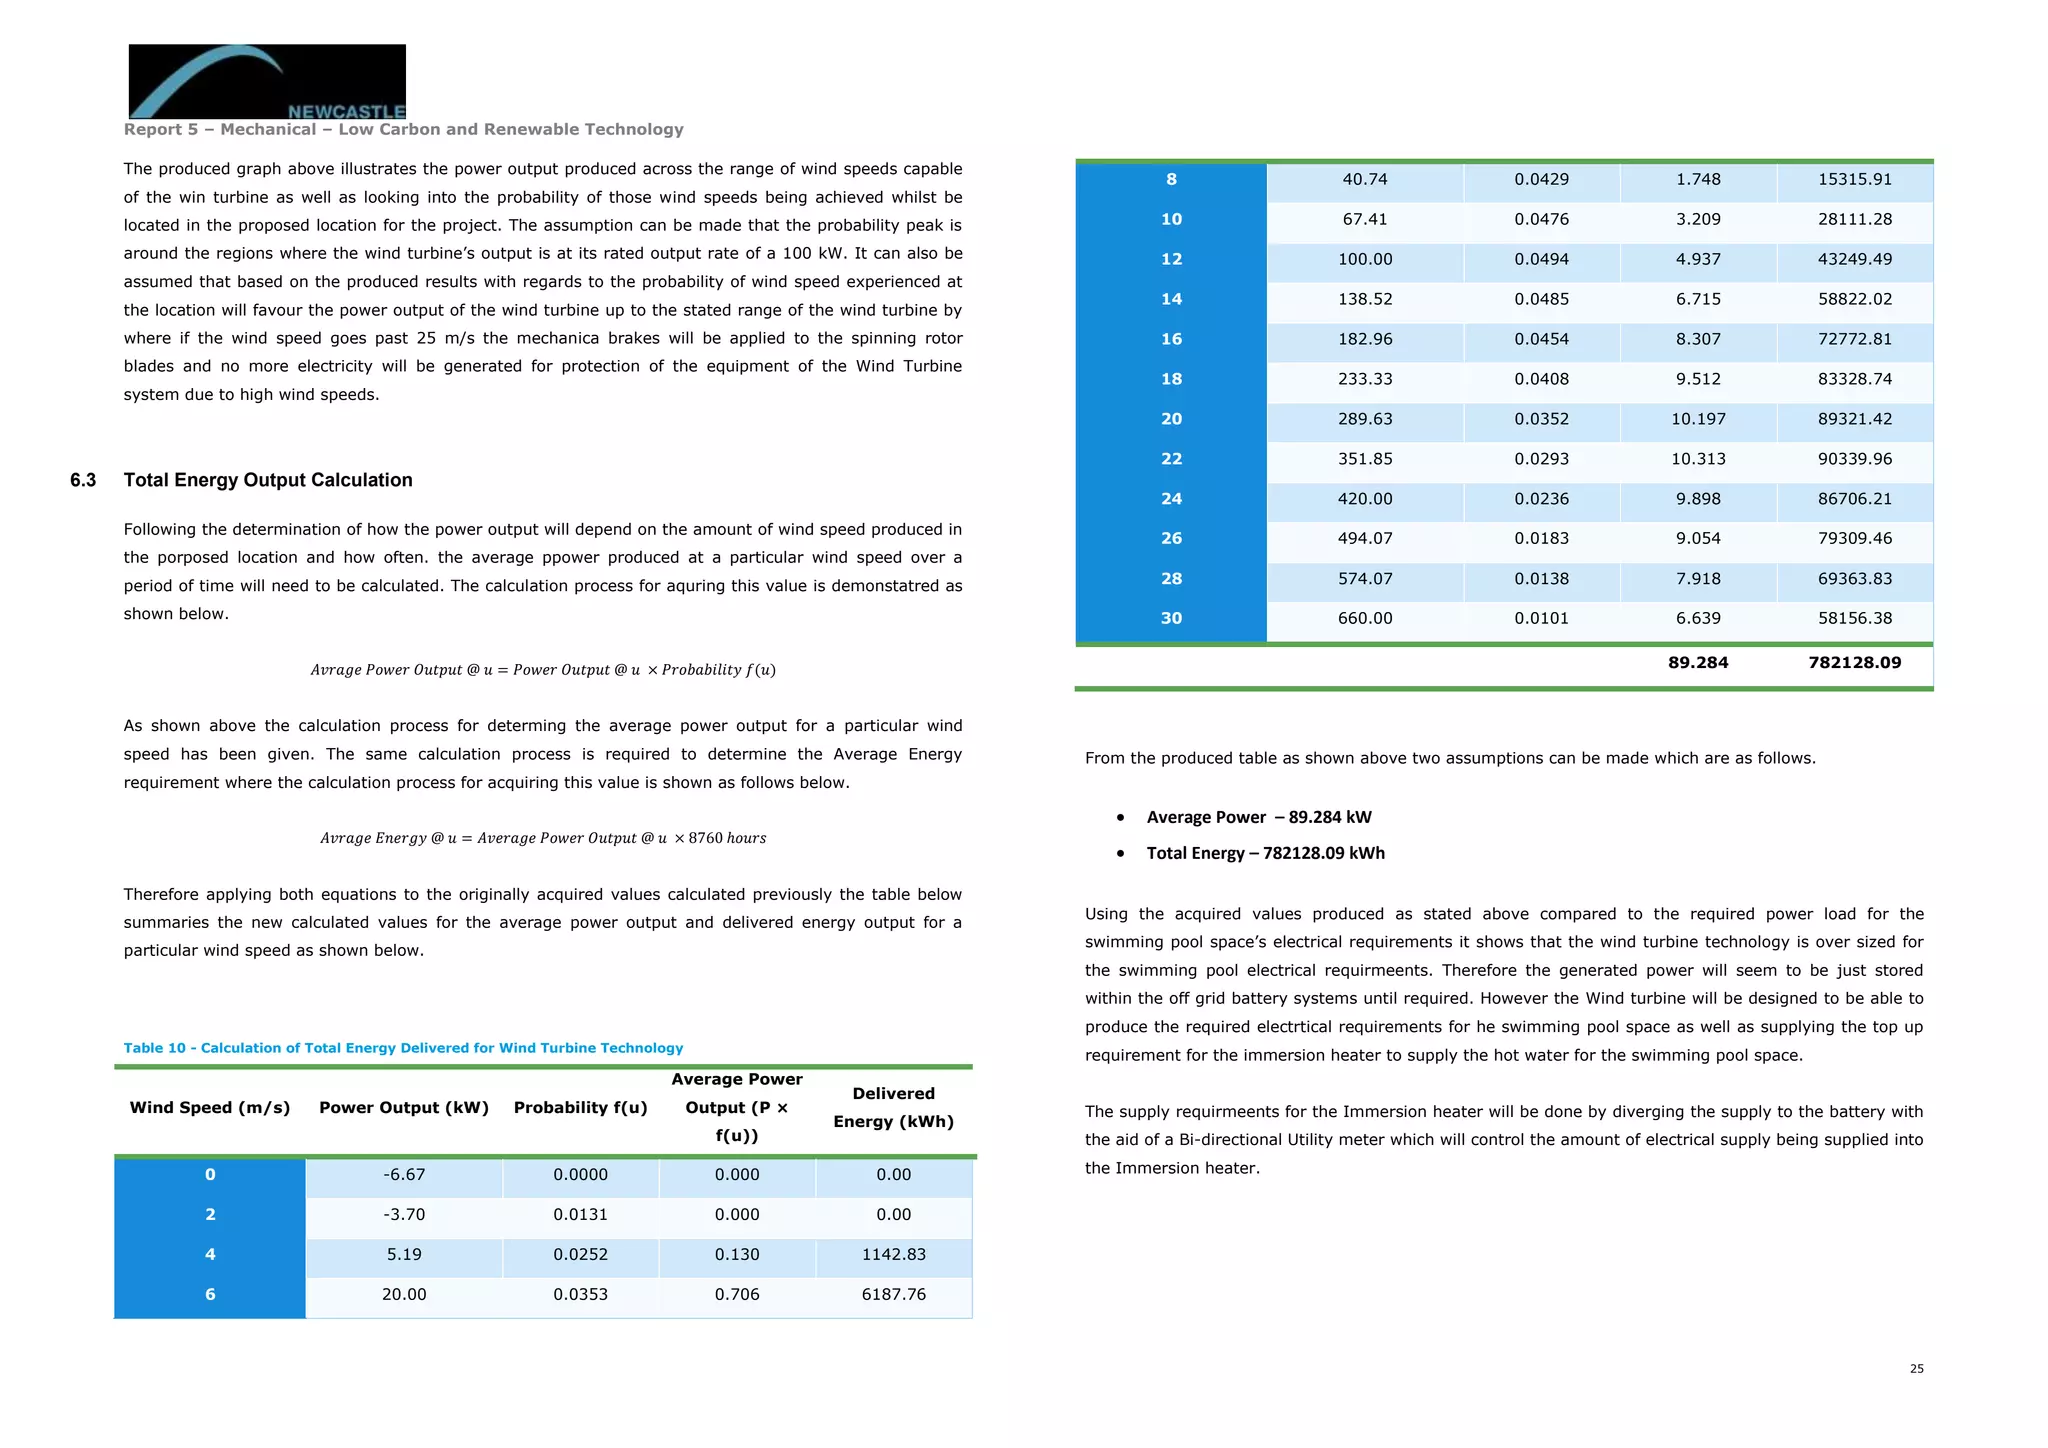
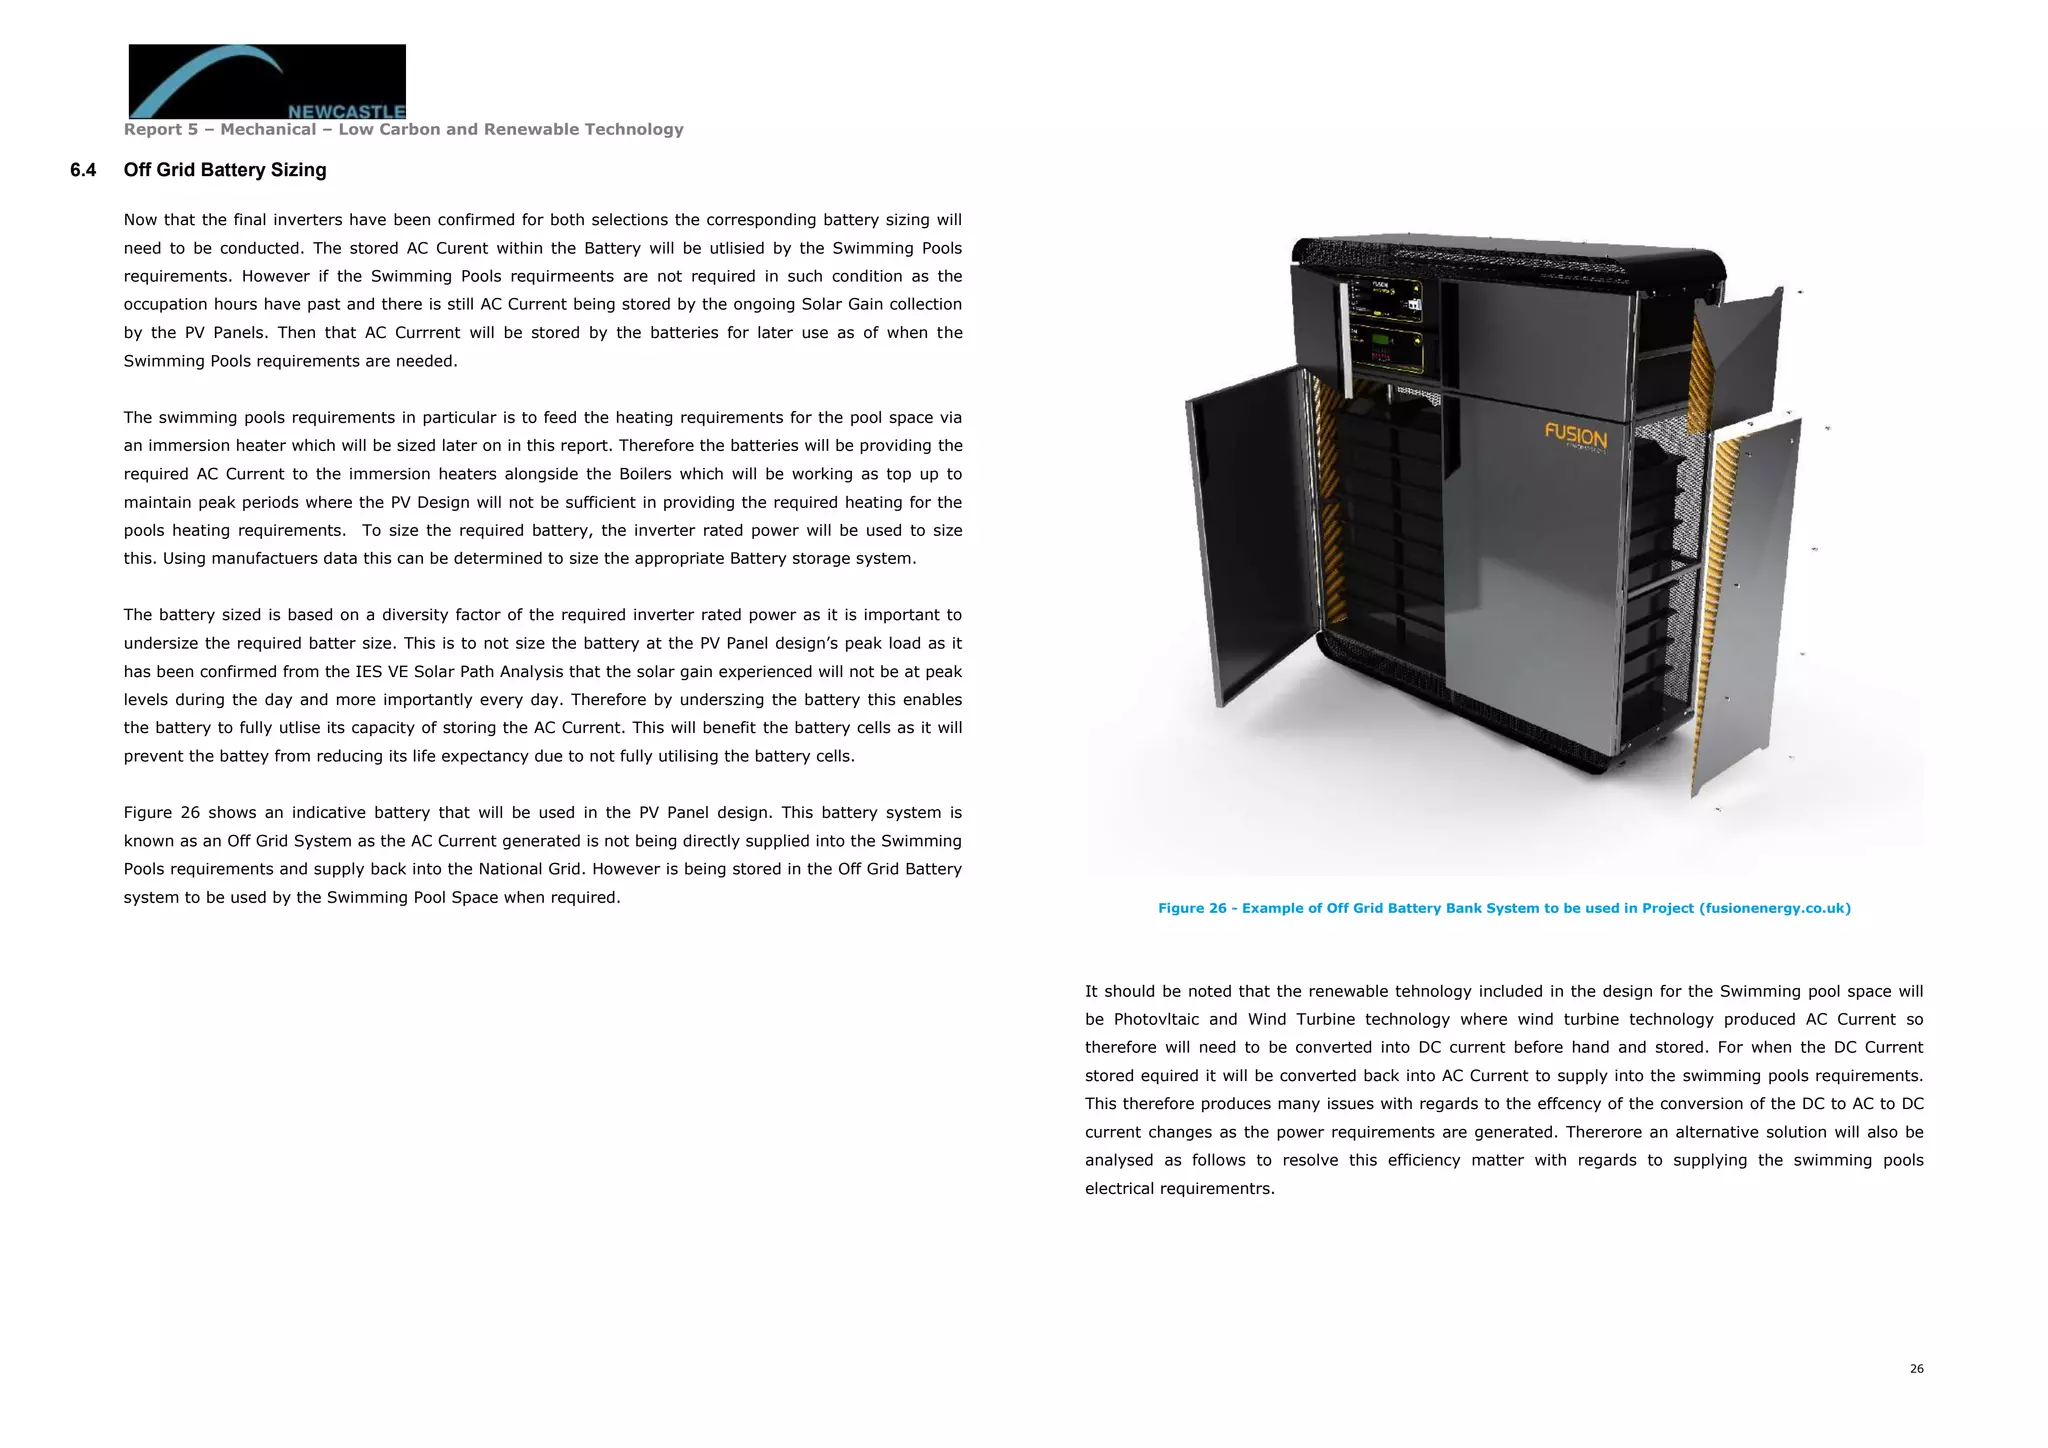
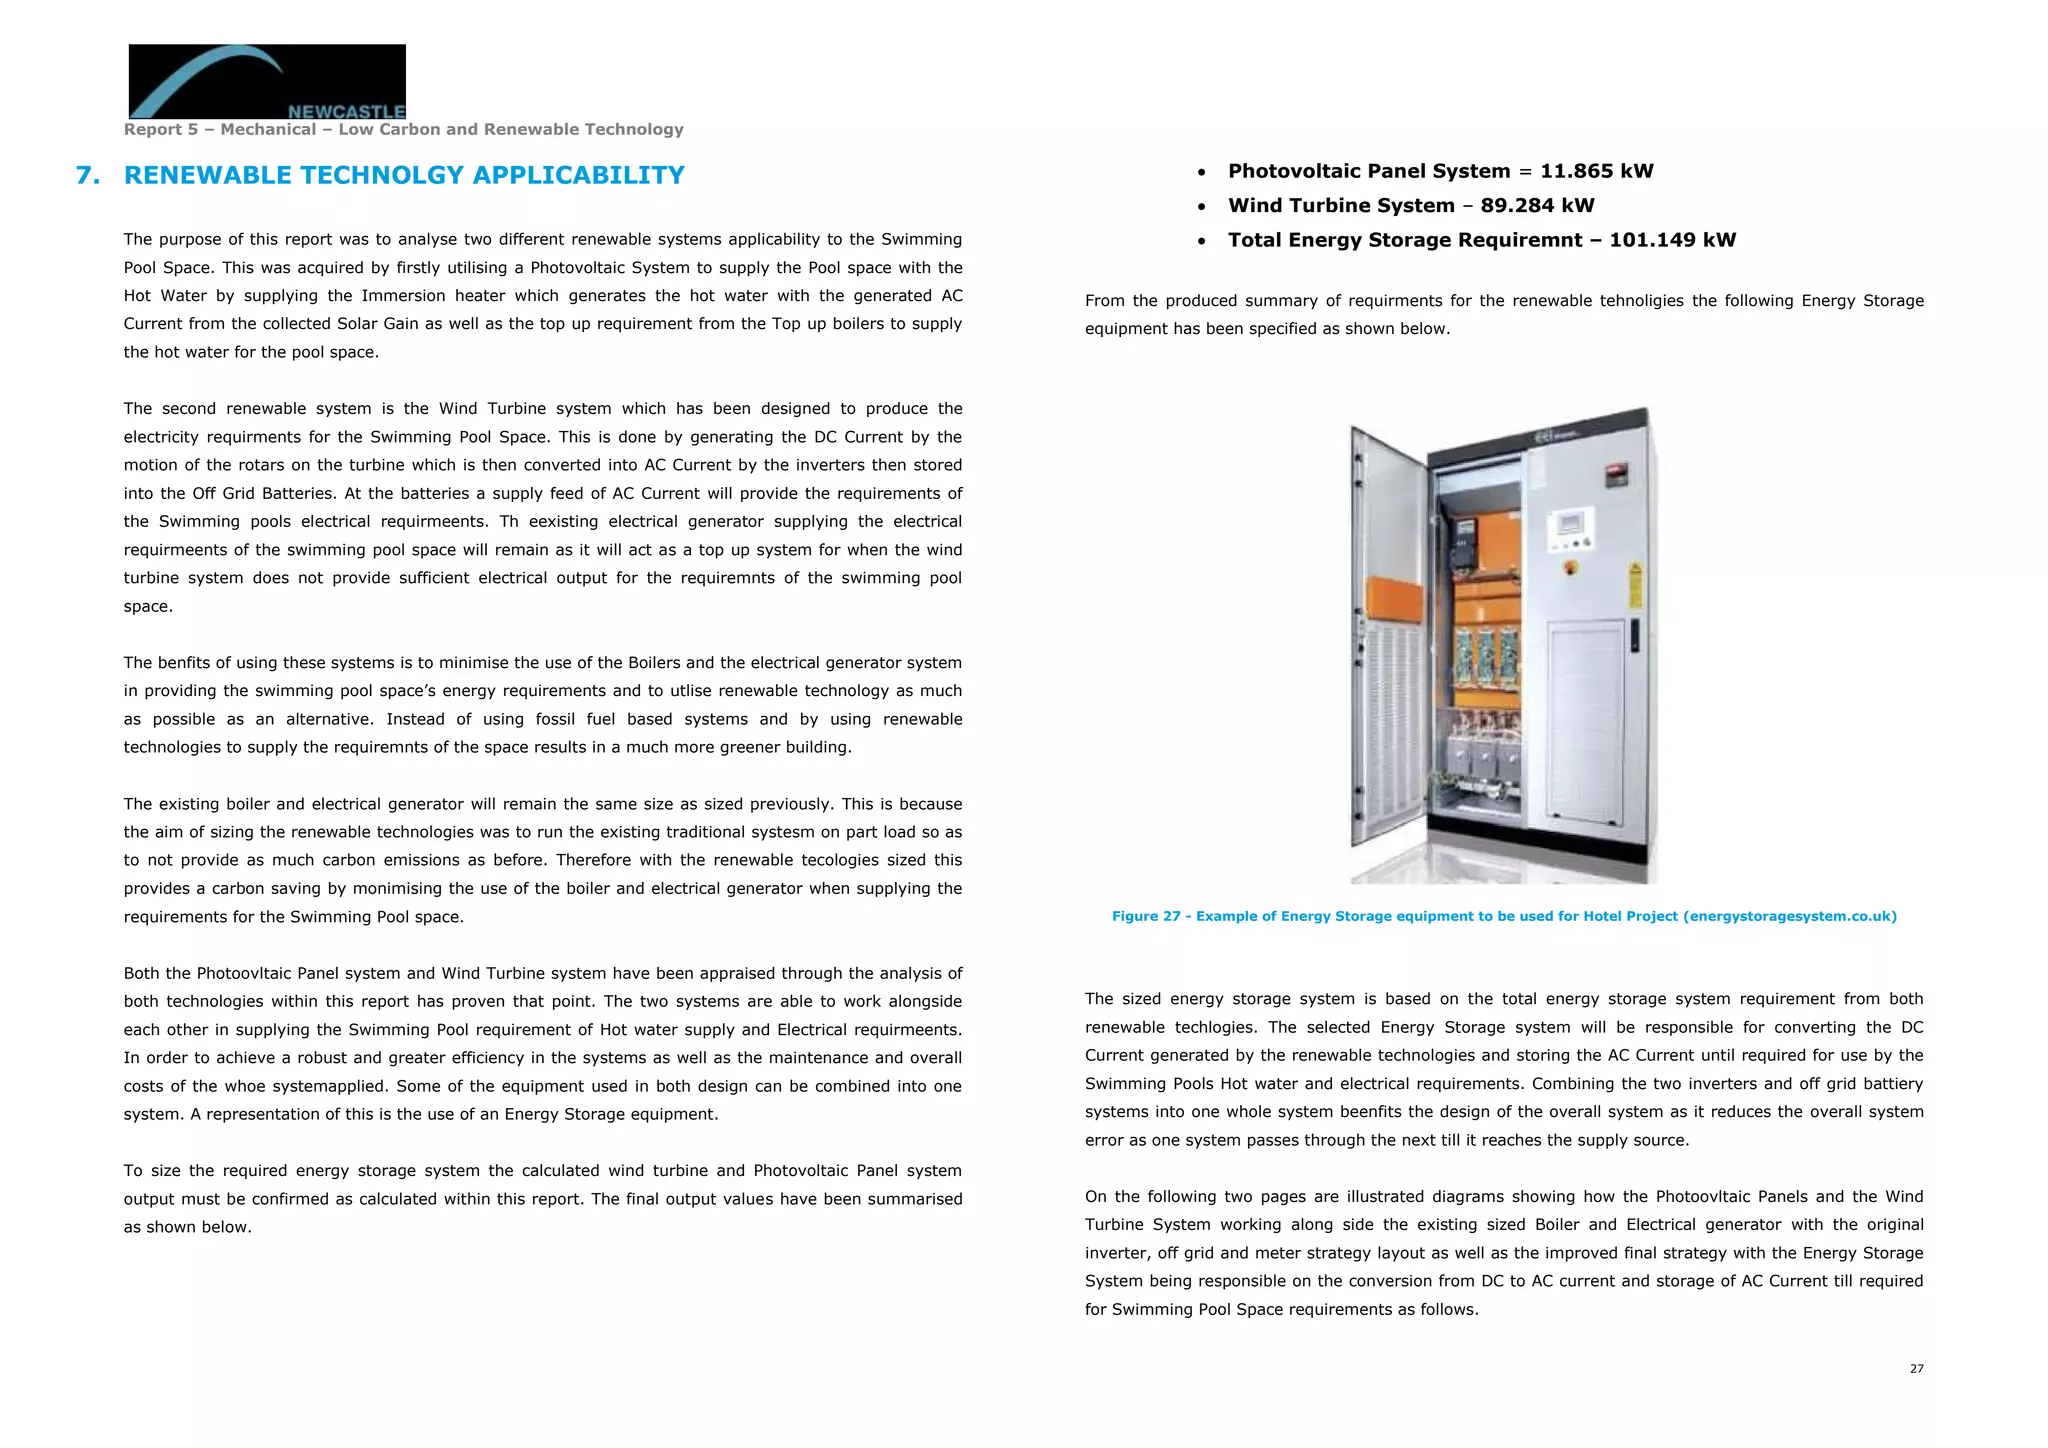
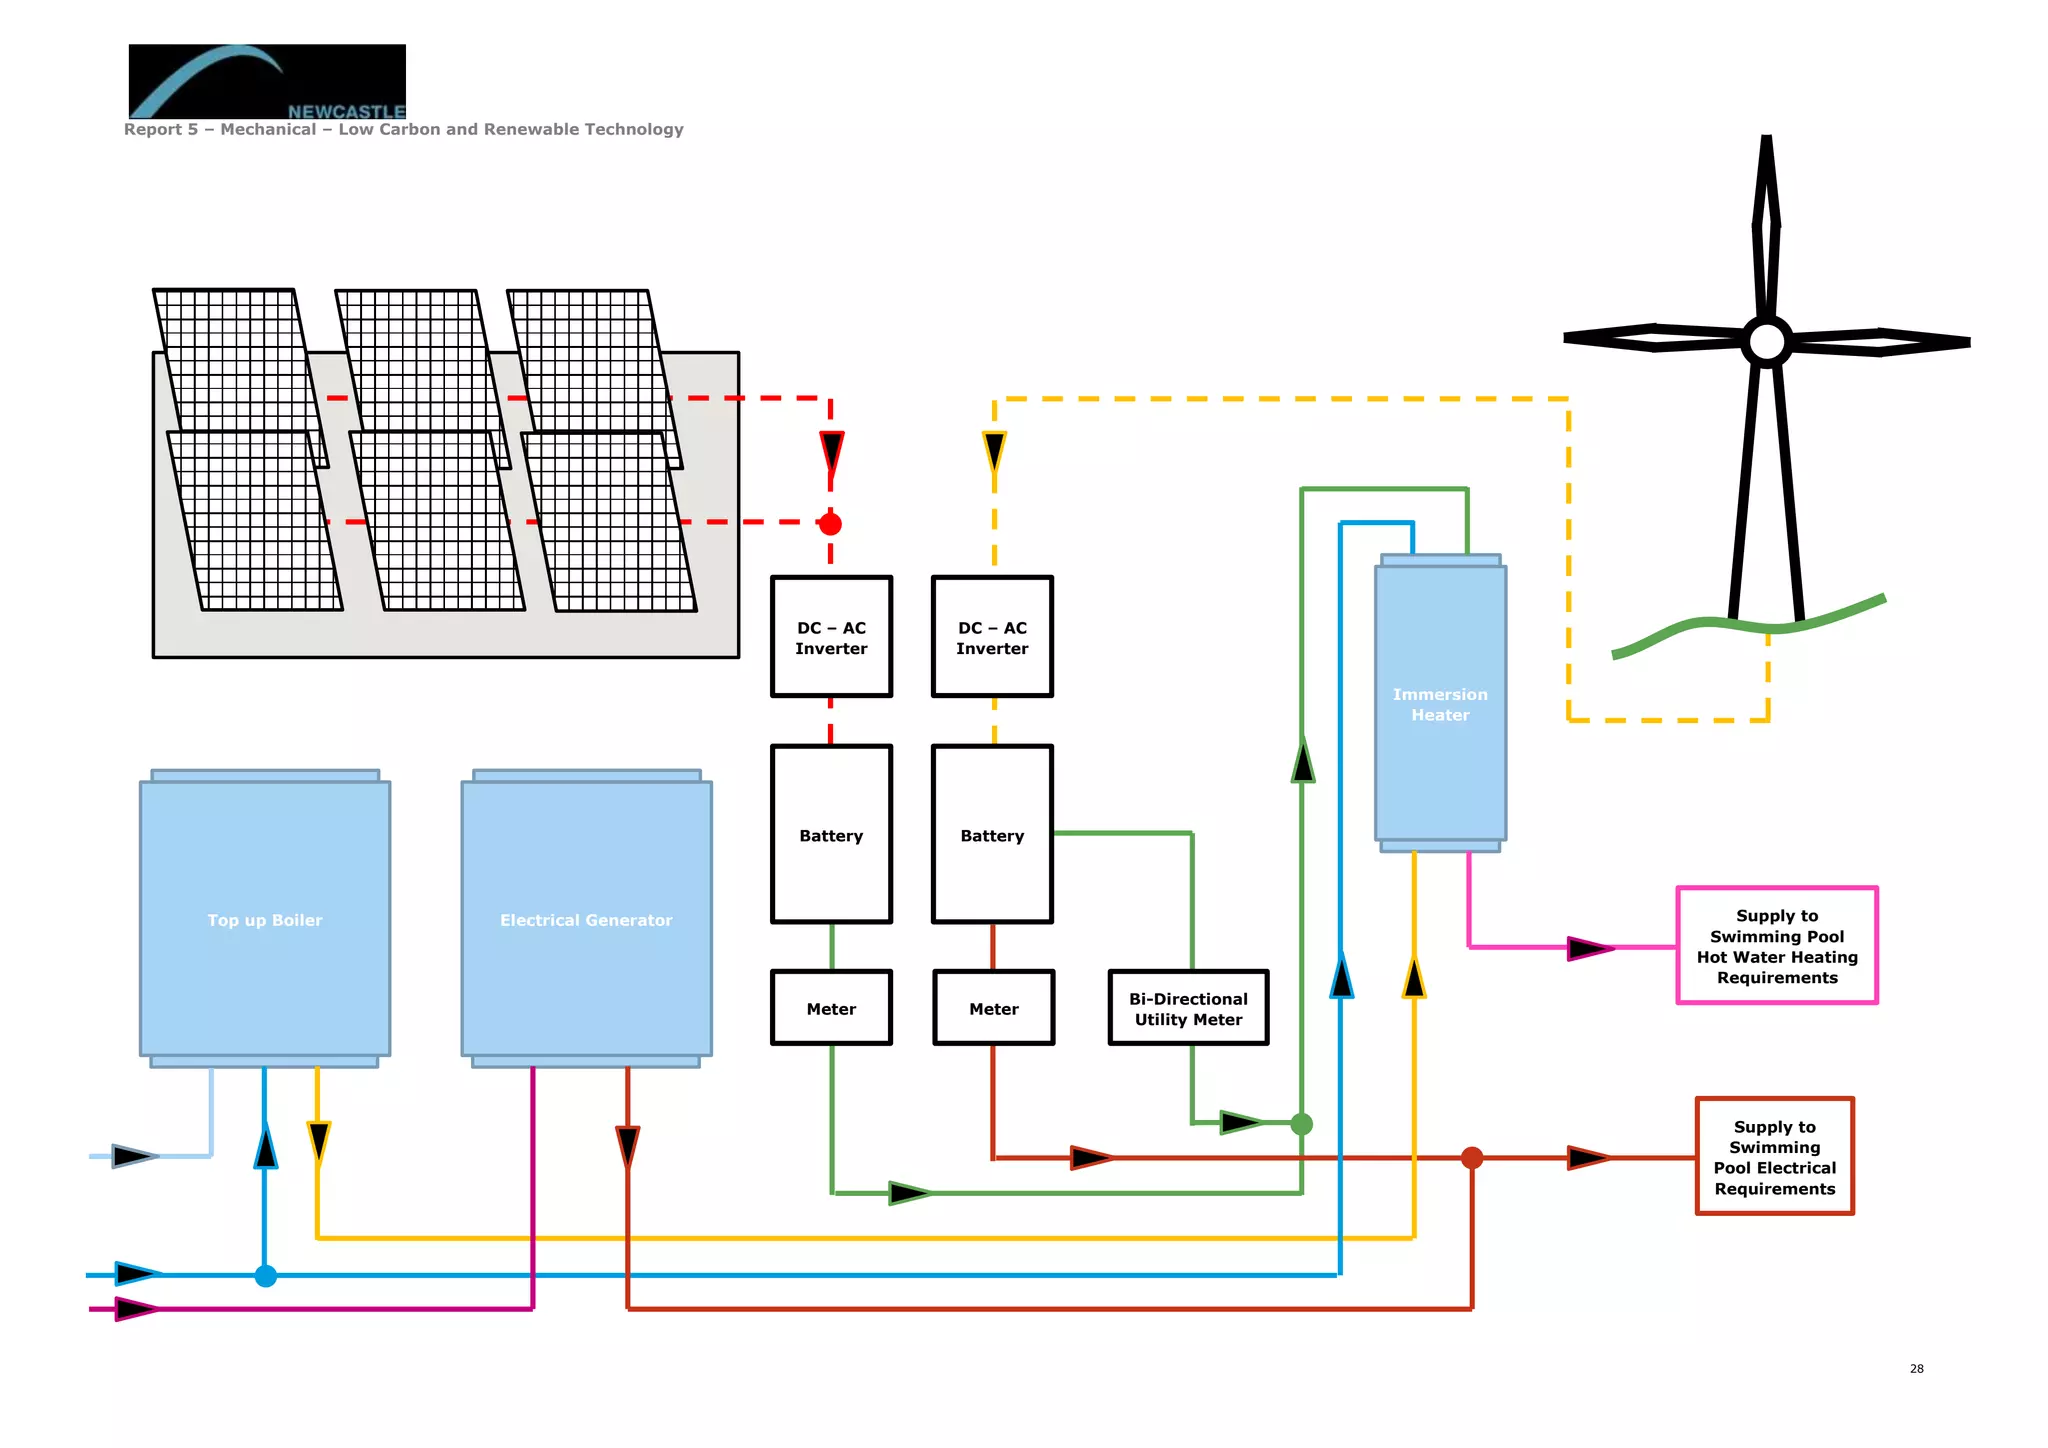
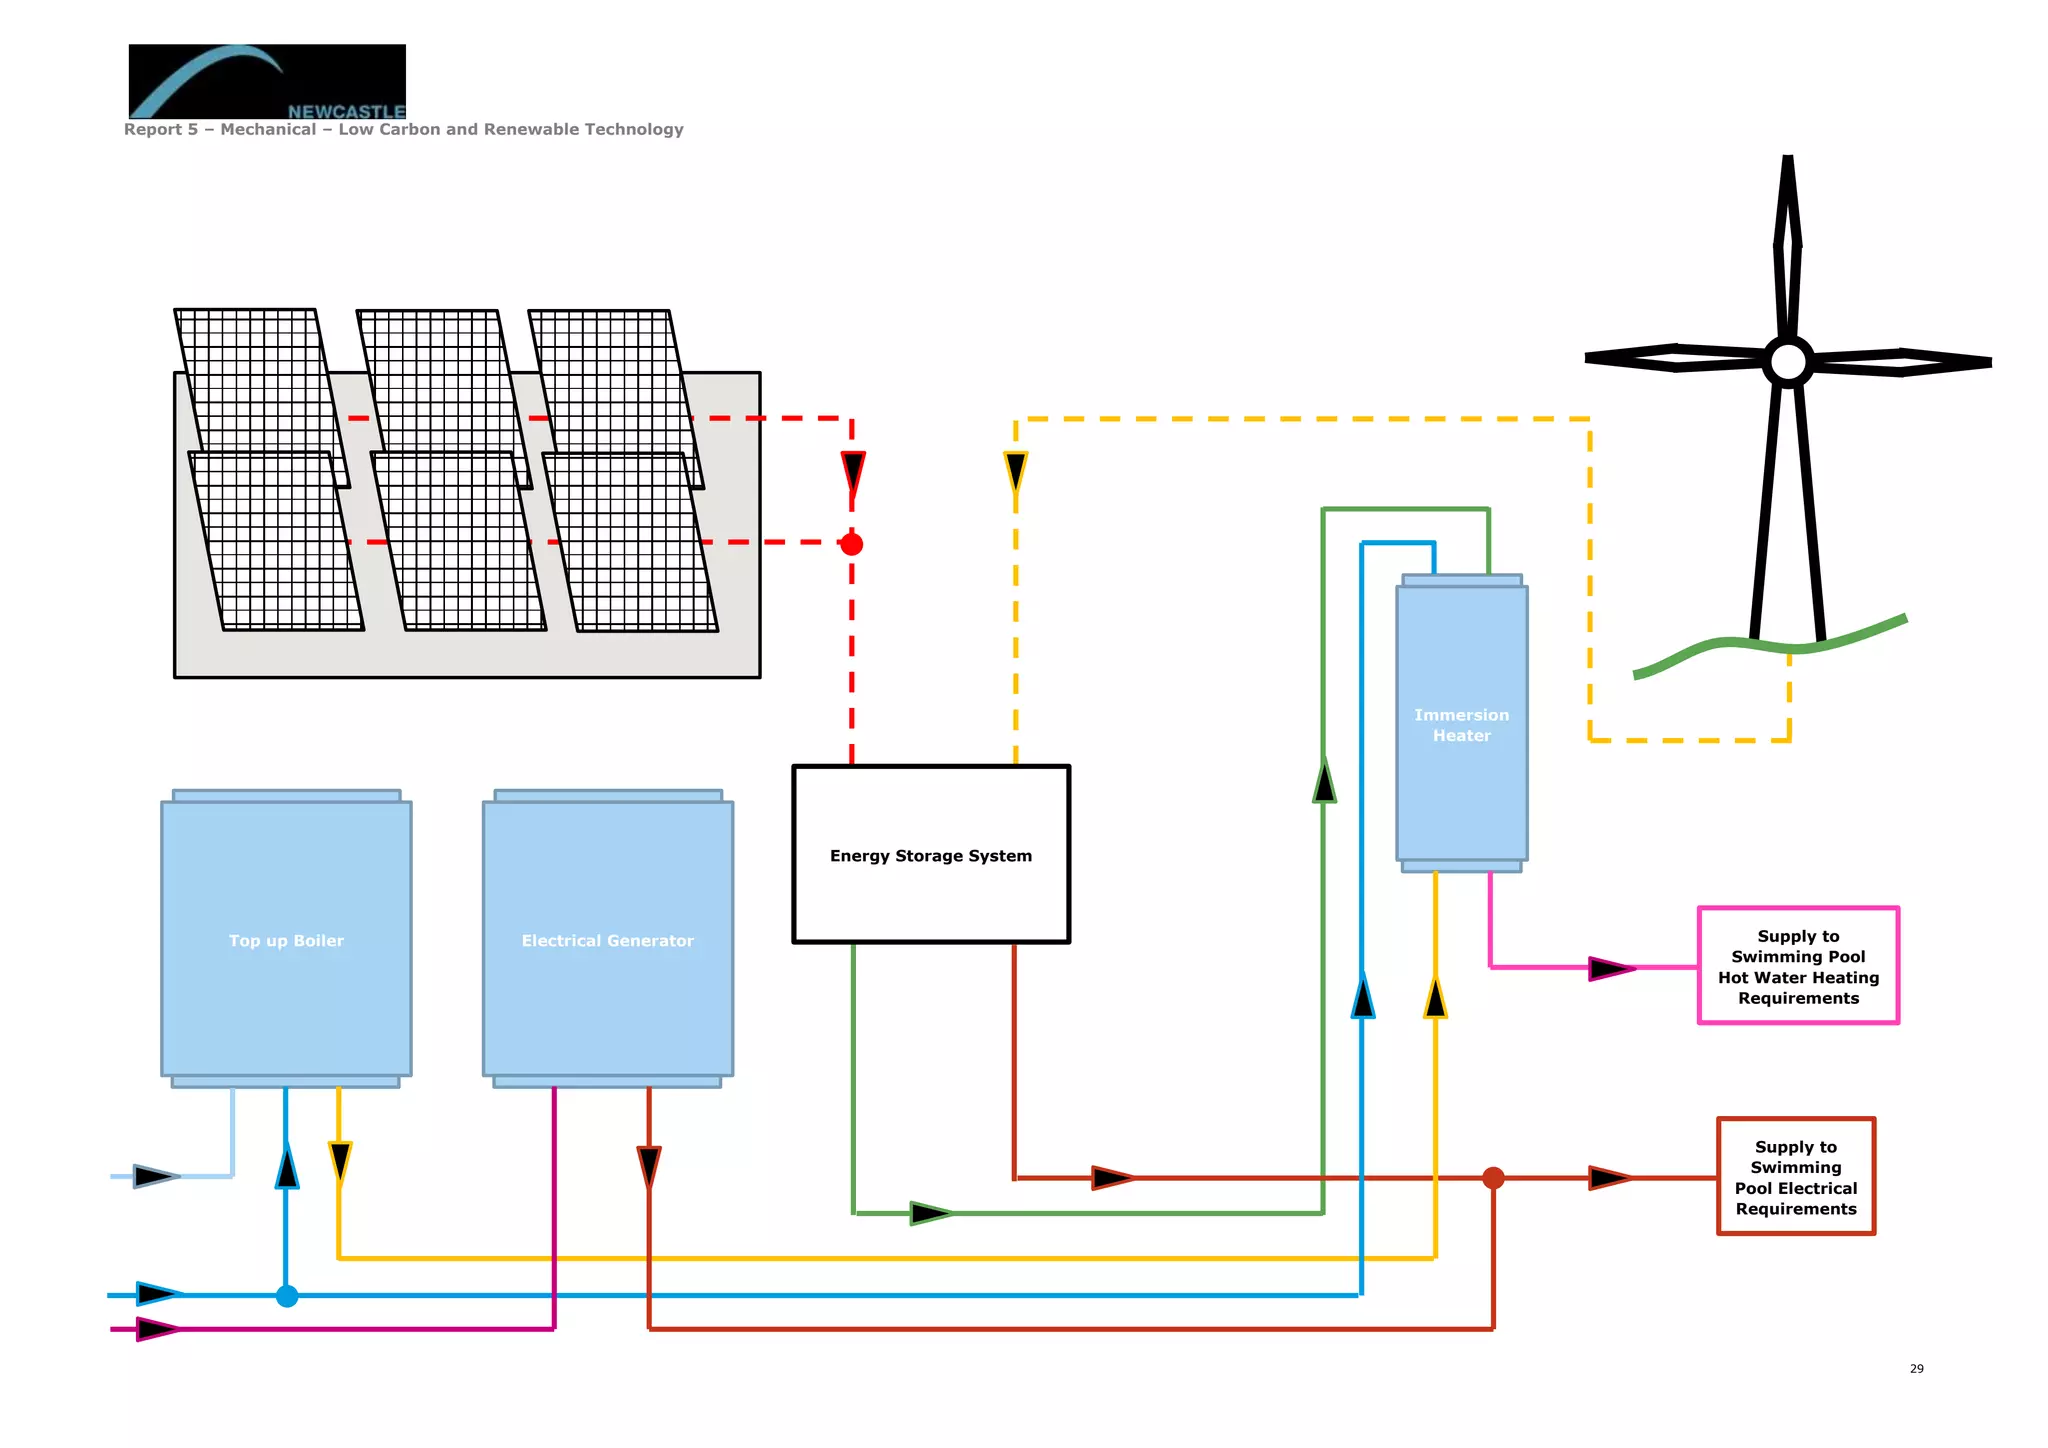
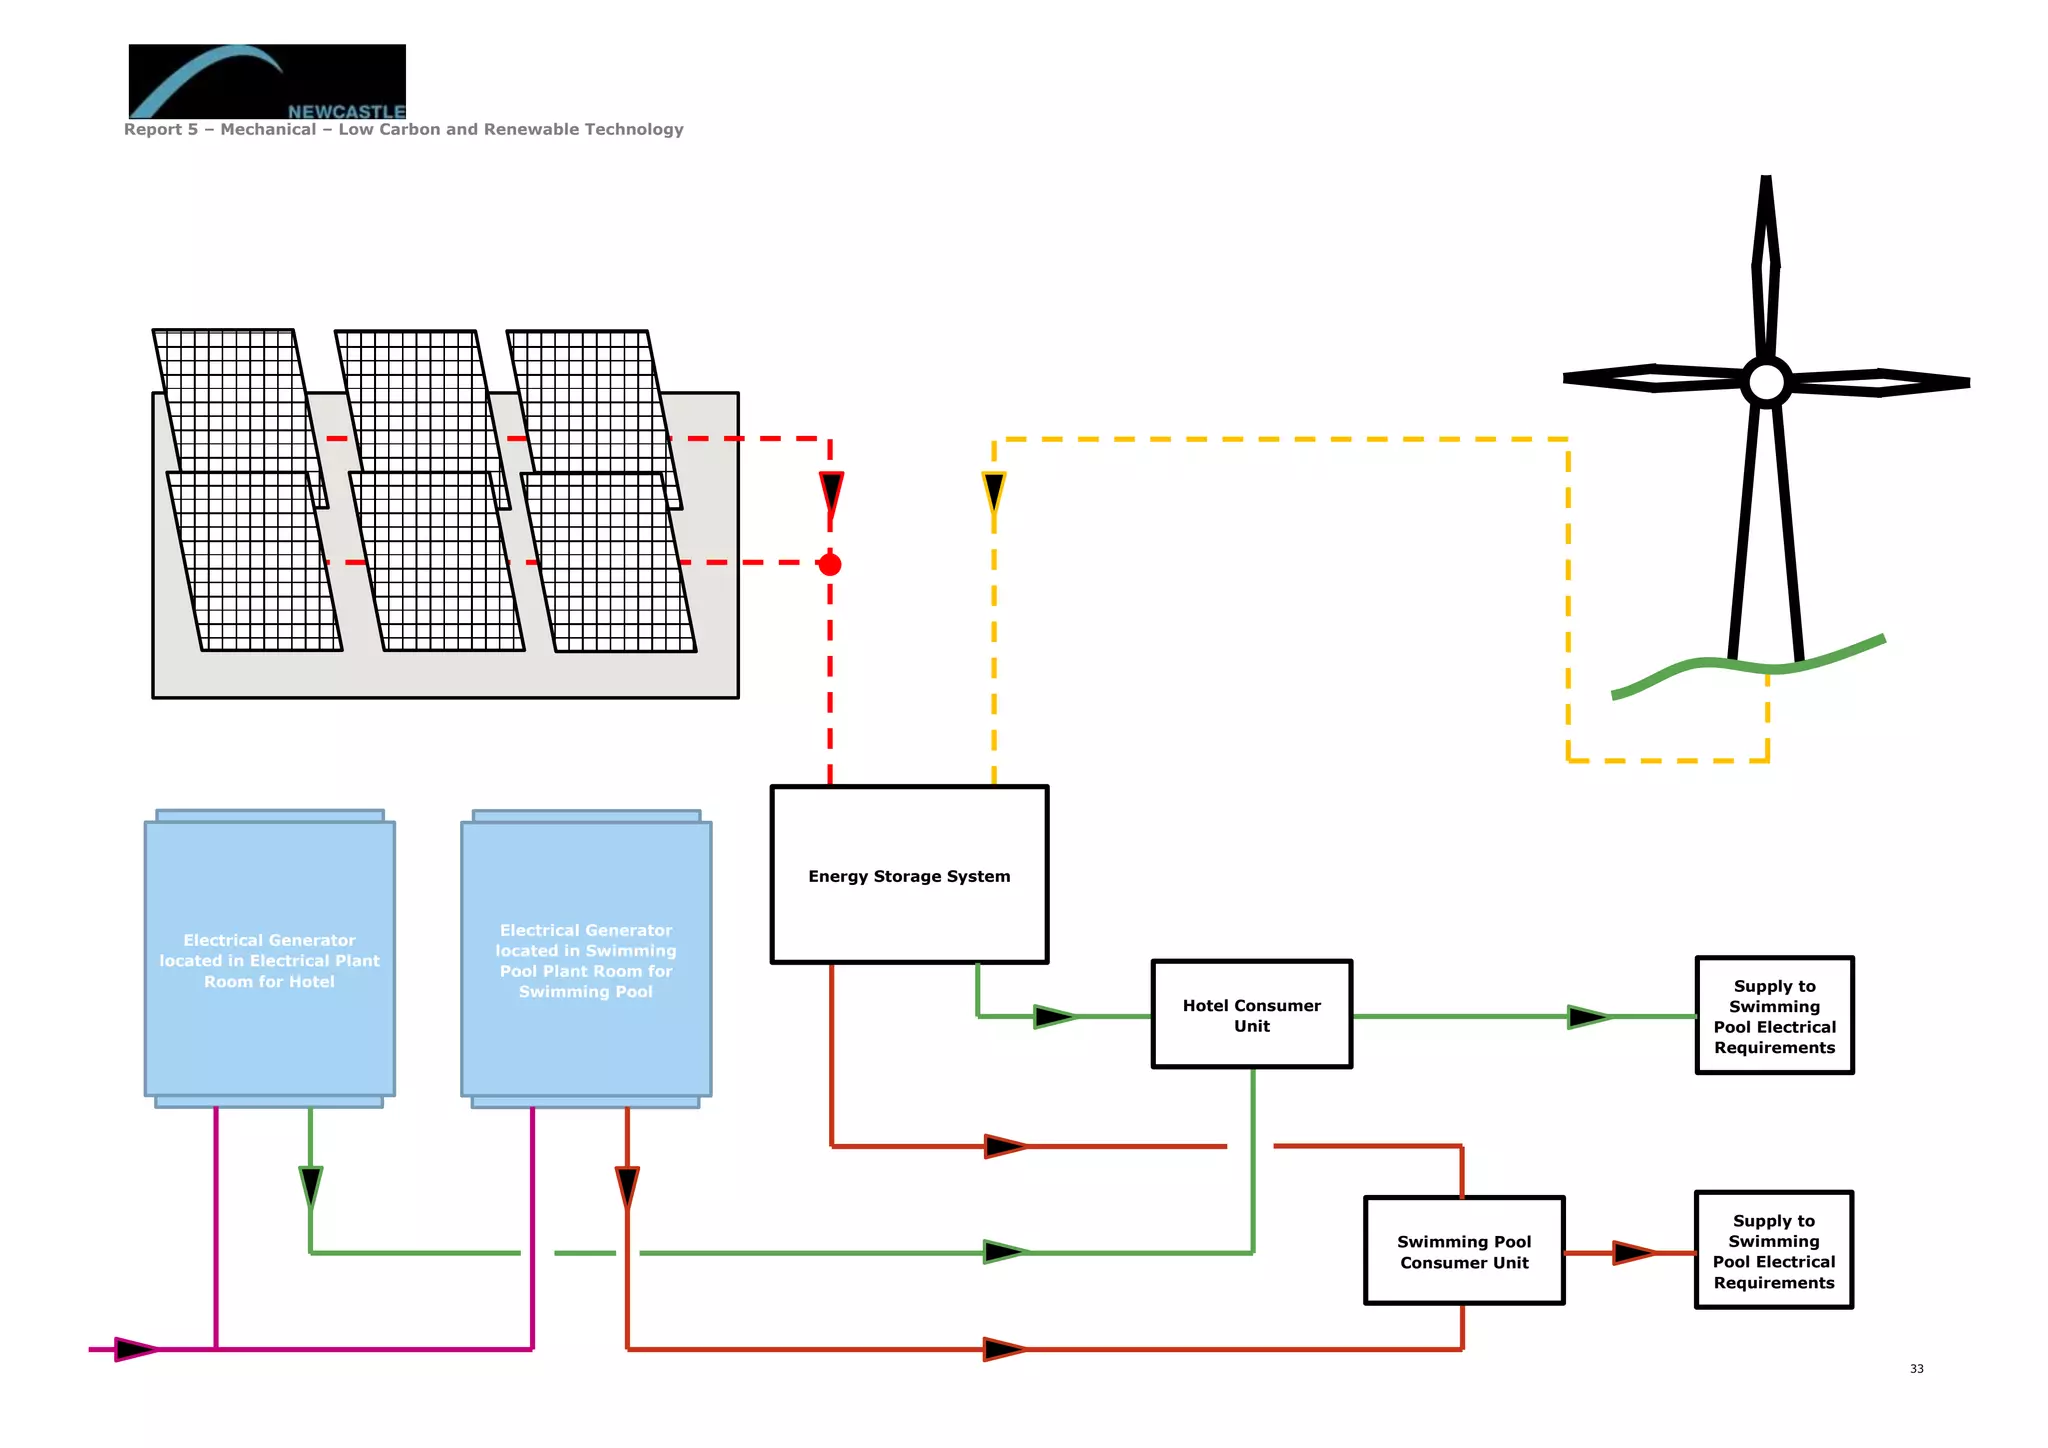
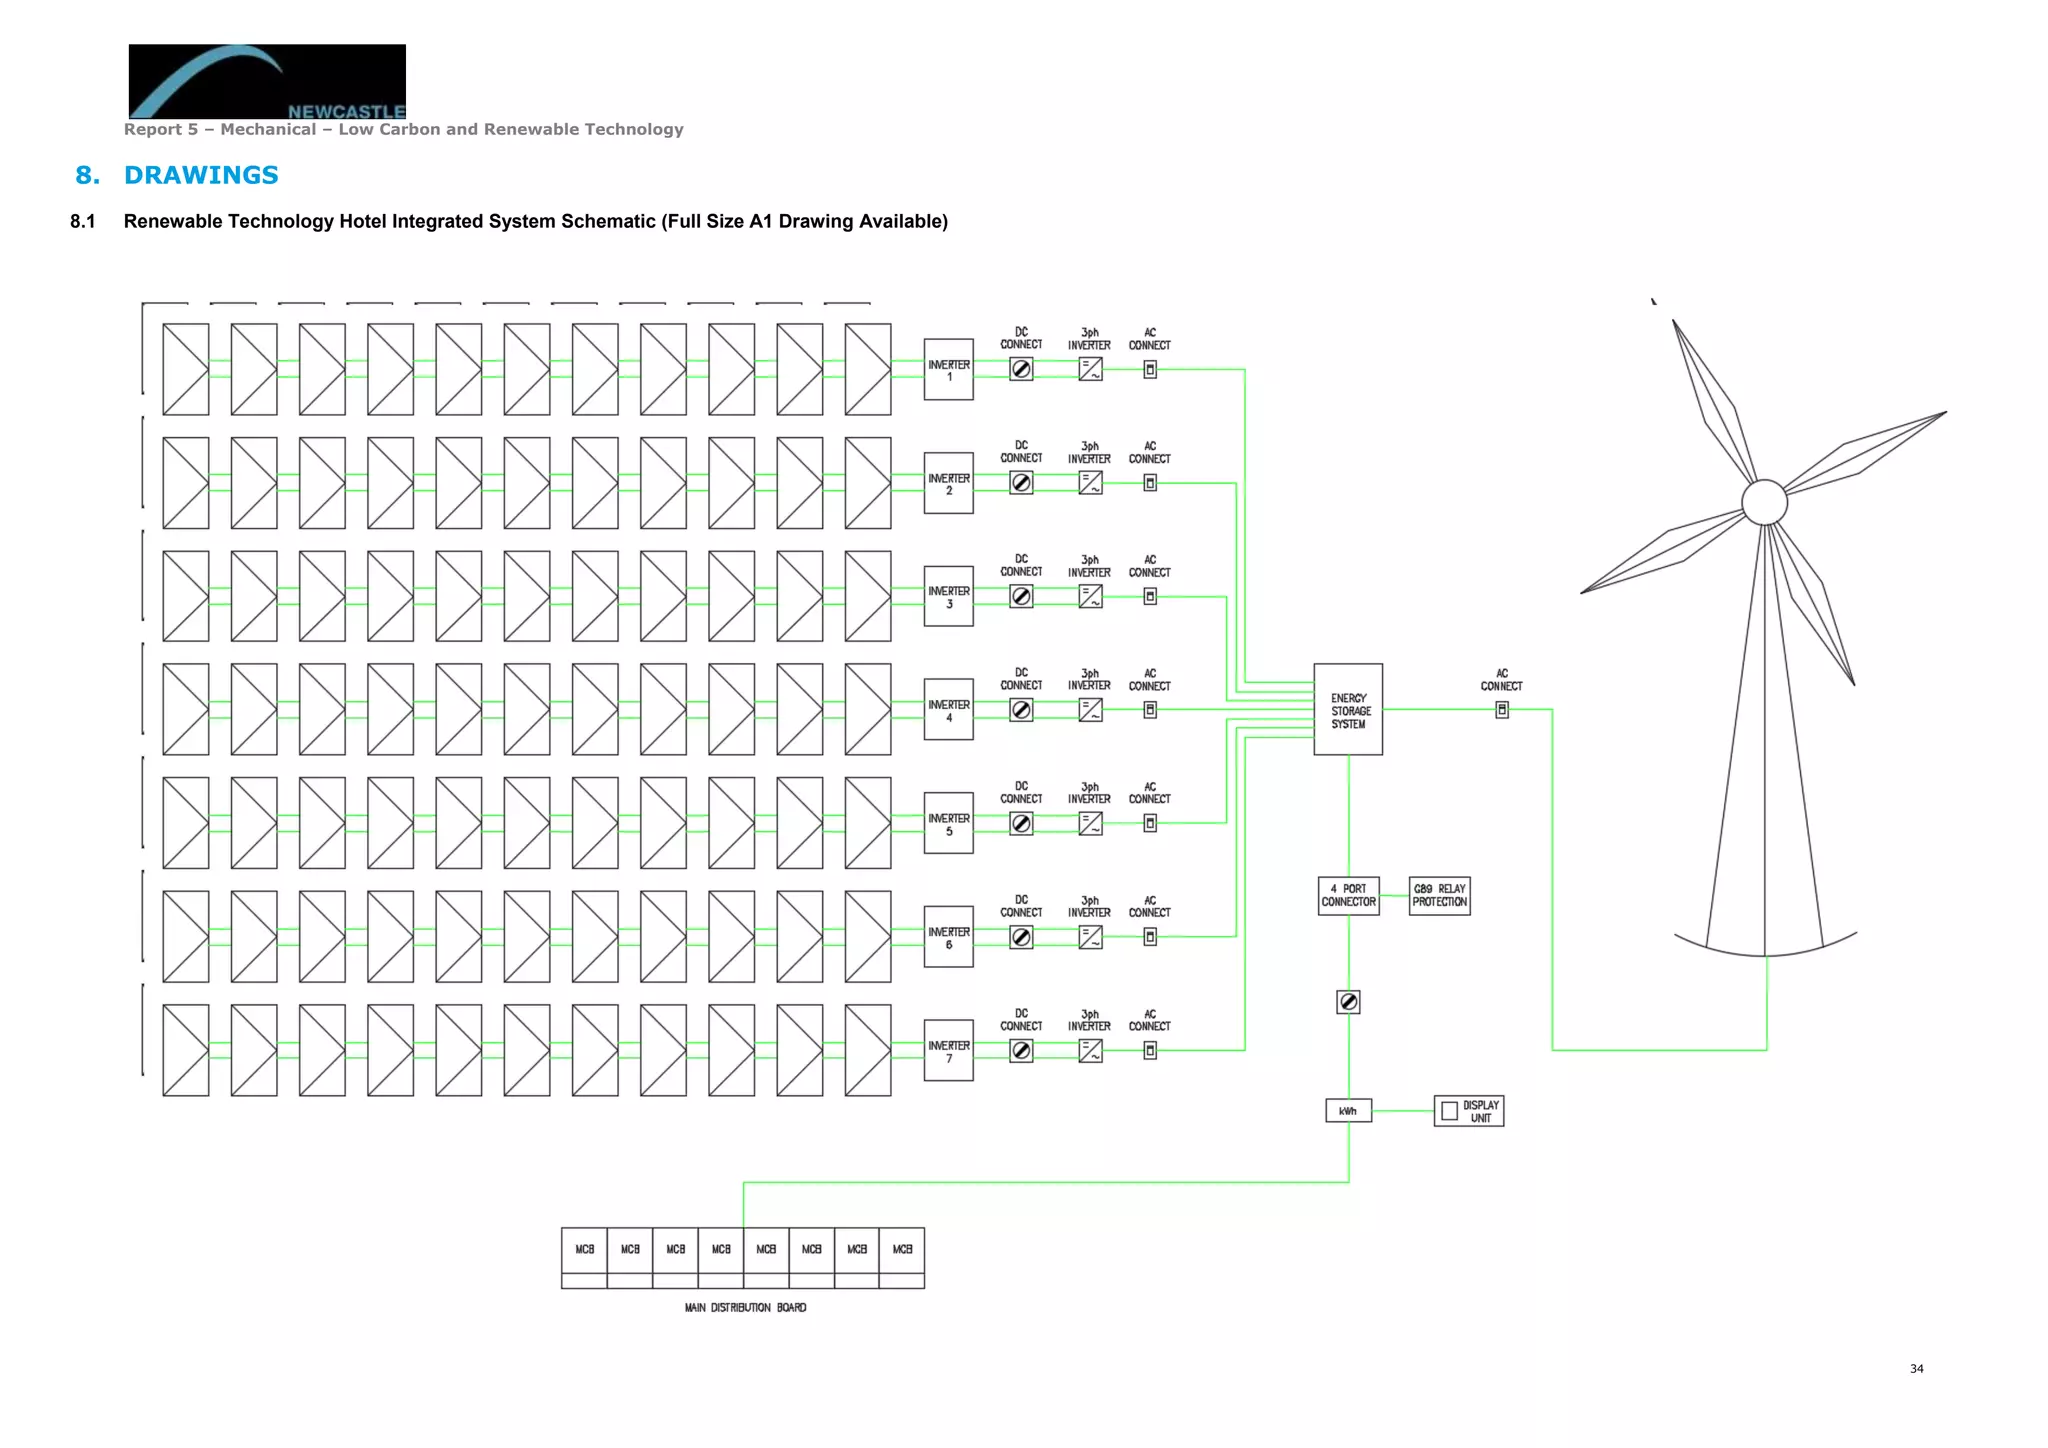
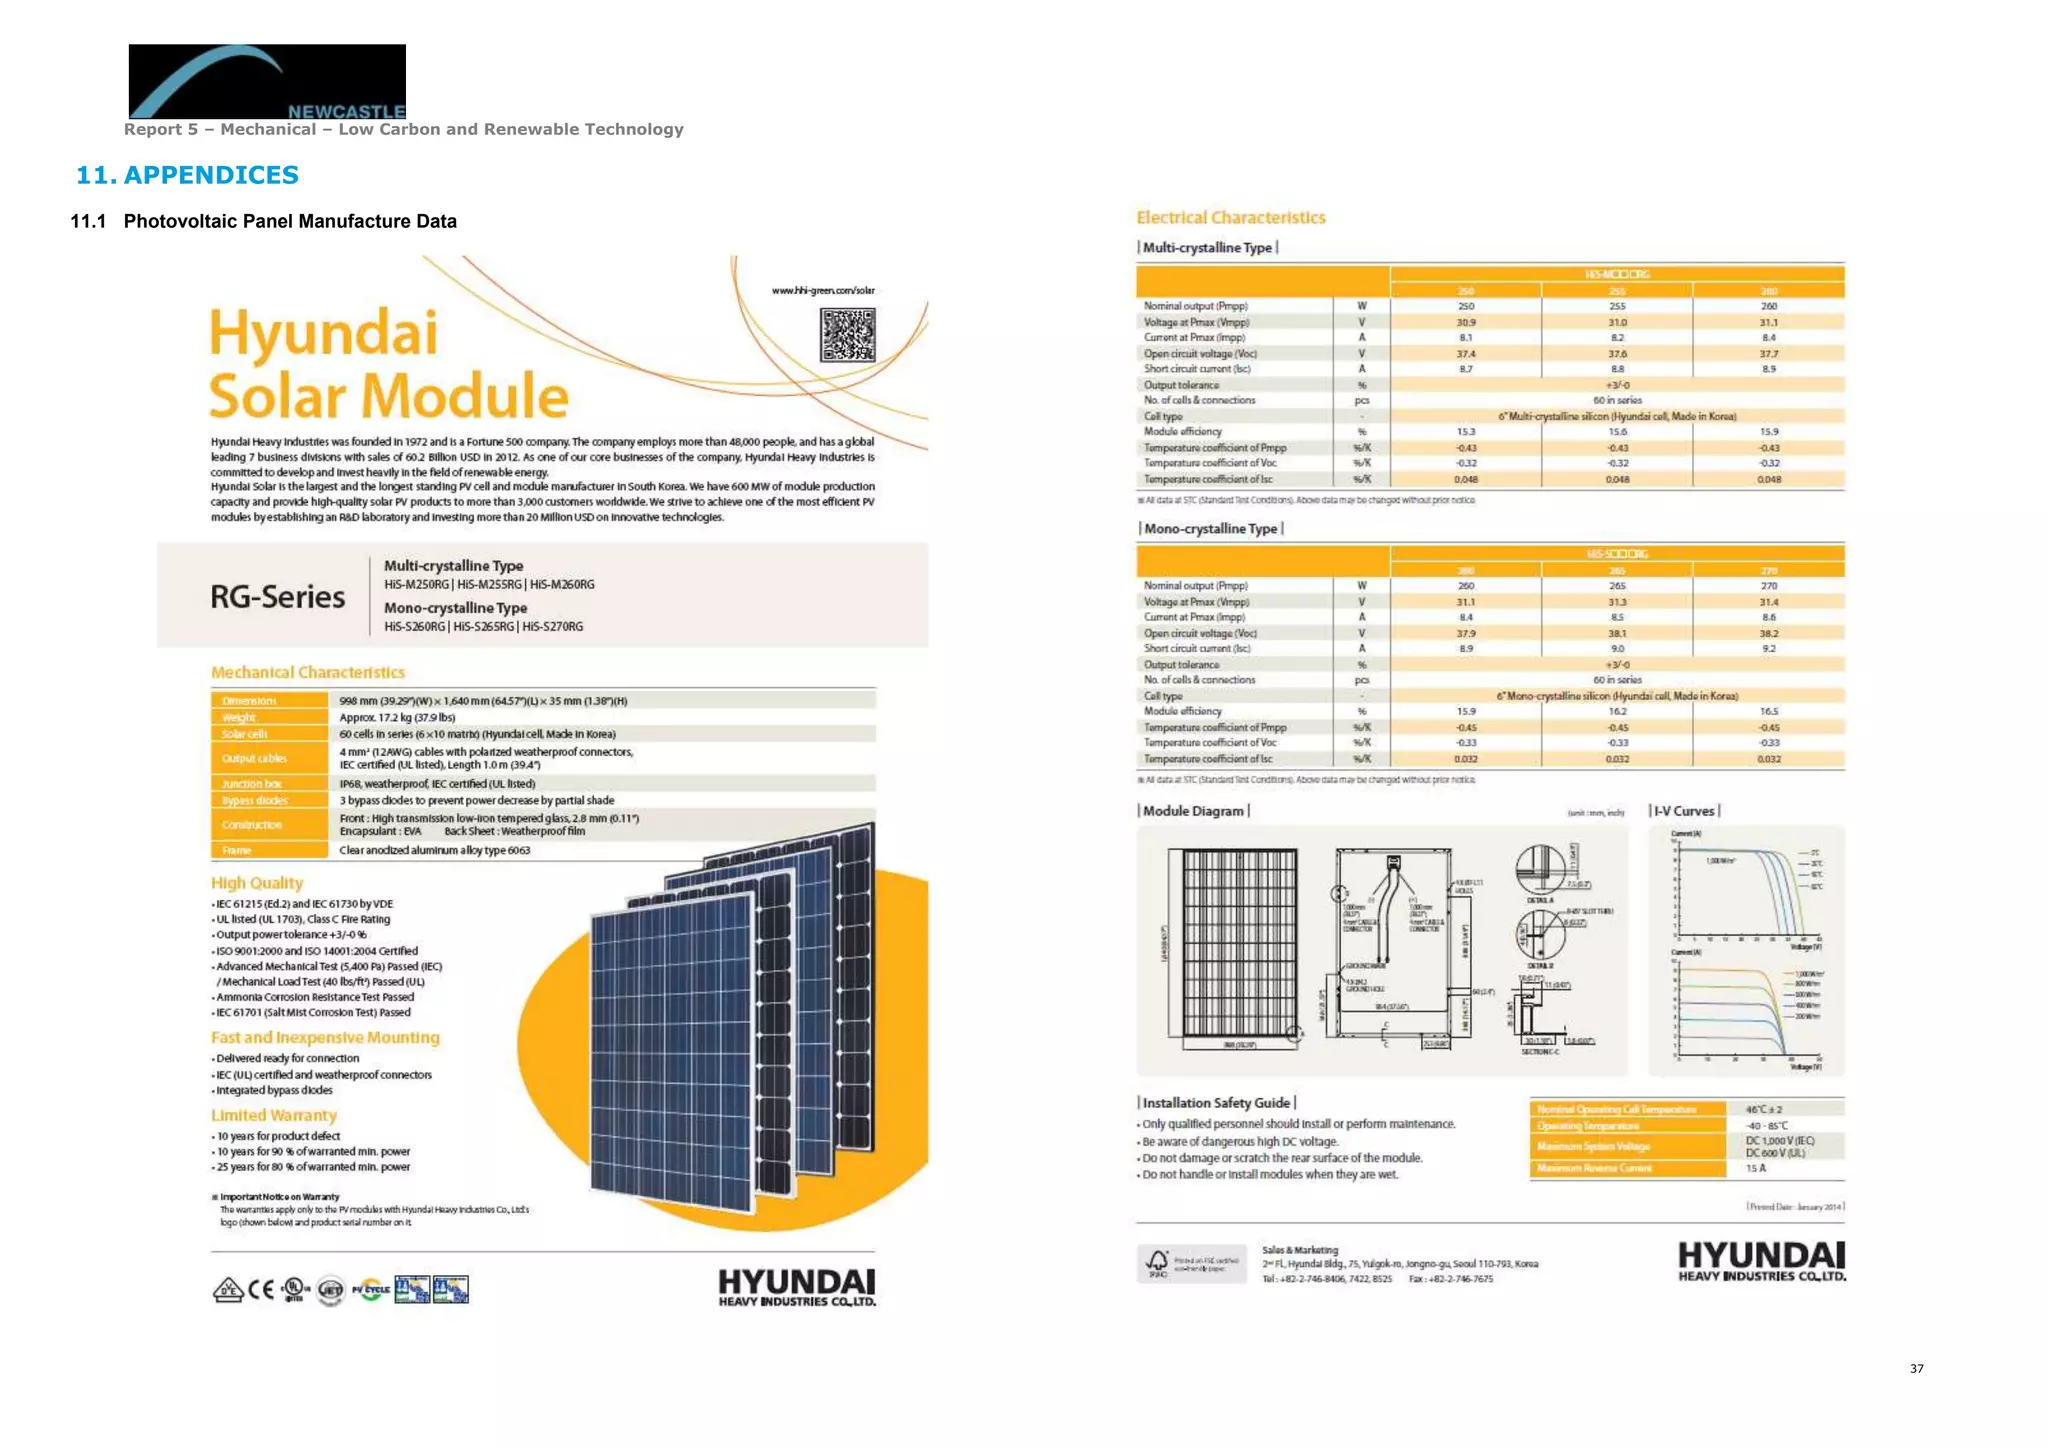
Projects
Projects
Intended for
Northumbria University Newcastle
Student no.
W12001941
Date
18th
May 2016
Word Count
13123
REPORT 5 - MECHANICAL
LOW CARBON AND
RENEWABLE TECHNOLOGY
Report 5 – Mechanical – Low Carbon and Renewable Technology
CONTENTS
1. Executive Summary 1
2. Introduction 2
3. Literature Review 3
3.1 Analysis of Renewable Technology 3
3.2 Analysis of Photovoltaic Panel 3
3.3 Analysis of Wind Power 3
3.4 Analysis of Combined Technology 4
3.5 Effects on Project 5
4. Location Analysis 6
5. Photovoltaic Design Appraisal 8
5.1 Photovoltaic Panel Comparison 9
5.2 Inverter Selection 14
5.3 Annual Energy Prediction 18
6. Wind Turbine Design Appraisal 20
6.1 Linear Wind Velocity Calculation 22
6.2 Power Output calculation 23
6.3 Total Energy Output Calculation 25
6.4 Off Grid Battery Sizing 26
7. Renewable Technolgy Applicability 27
7.1 Redesign of Renewable Technologies 31
7.2 Payback Period Calculation 31
8. Drawings 34
8.1 Renewable Technology Hotel Integrated System Schemat 34
9. Further Design Considerations 35
10. Bibliography 36
11. Appendices 37
11.1 Photovoltaic Panel Manufacture Data 37
11.2 Inverter Manufacture Data 38
11.3 Wind Turbine Manufacture Data 39
11.4 Energy Storage System Manufacture Data 40
Report 5 – Mechanical – Low Carbon and Renewable Technology
TABLES
Table 1 - Summary of Renewable and Low Carbon Technologies selected from Stage 2 Report ......................2
Table 2 - Selection of PV Modules to be used in design calculation comparison ............................................9
Table 3 - PV Panel Option Comparison .................................................................................................. 13
Table 4 - comparison of chosen Array Design and chosen Inverter Suitability ............................................ 14
Table 5 - Comparison of Final two options for PV Panel Array design ........................................................ 16
Table 6 - Inverter Comparison to best suit final selected PV Panel Array Options........................................ 16
Table 7 - Interpolated data of CIBSE Guide A Table 2.27 to find out irradiation at 33.5° ............................. 18
Table 8 - Probability of Wind Speed occurance using Rayleigh Probability Calculation.................................. 22
Table 9 - Calculated Power Output dependant on Wind Speed ................................................................. 24
Table 10 - Calculation of Total Energy Delivered for Wind Turbine Technology ........................................... 25
Table 11 - Swimming Pool Electrical Requirements................................................................................. 30
Table 12 - Renewable Technologies Electrical Output.............................................................................. 30
Table 13 - Calculation of Renewable Technology Oversize ....................................................................... 31
Report 5 – Mechanical – Low Carbon and Renewable Technology
FIGURES
Figure 1 - World primary energy supply (H.Lund 2006).............................................................................3
Figure 2 - Flowchart of a typical photovoltaic and wind generation optimization methodology (E.Koutroulis et Al
2005).................................................................................................................................................4
Figure 3 - Stand Alone Wind and PV generating system configuration (M.H.Nehrir et Al 2000).......................5
Figure 4 - World Oil productions in the next 10-20 years (A.M.Omer 2007) .................................................5
Figure 5 - Site Plan of Project Building within City Centre Location .............................................................6
Figure 6 -Available roof space for PV Panel..............................................................................................6
Figure 7 - Available Terrace roof space for PV Panel .................................................................................6
Figure 8 - IES VE Provided Solar Path Analysis ........................................................................................7
Figure 9 - IES VE Produced Wind Diagram...............................................................................................7
Figure 10 - Illustration of how Photovoltaic Panels work............................................................................8
Figure 11 - An Indicative image of the chosen Hyundai Solar Mono Crystaline Type 250 PV Module................9
Figure 12 - Option 1 on the Roof Space with 70 panels linked in one string ............................................... 10
Figure 13 - Option 2 on the Terrace Roof Space with 77 panels linked in one string.................................... 10
Figure 14 - Option 3 on the Terrace Roof Space with 70 panels linked by 2 strings..................................... 11
Figure 15 - Option 4 on the Terrace Roof Space with 77 Panels linked by 11 Strings................................... 11
Figure 16 - Indicative PV Panel array design of 70 Modules with 5 inverters connected ............................... 15
Figure 17 - Indicative PV Panel array design of 77 Modules with 7 inverters connected ............................... 15
Figure 18 - Efficiency Curve for Chosen Inverter Selection (sma.co.uk)..................................................... 17
Figure 19 – An illustrated diagram of a wind turbine to show how the electricity will be generated ............... 20
Figure 20 - Indicative Wind Turbine to be used in Hotel Project for Swimming Pool Electrical requirements ... 20
Figure 21 - Indicative diagram illatrating how the wind turbine system will generate electricity for the
swimming pool space ......................................................................................................................... 21
Figure 22 - Incoming Wind Direction on Site of Hotel Project ................................................................... 22
Figure 23 - Graph showing probability of achieving Wind Speed in proposed site........................................ 23
Figure 24 - Indicative representation of Wind Turbine Technology used in Hotel......................................... 23
Figure 25 - Graph comparing Probability of Wind Speed and corresponding Power Output........................... 24
Figure 26 - Example of Off Grid Battery Bank System to be used in Project (fusionenergy.co.uk) ................. 26
Figure 27 - Example of Energy Storage equipment to be used for Hotel Project (energystoragesystem.co.uk) 27
Figure 28 - Energy prices within the United Kingdom based on UKPower.com ............................................ 30
Figure 29 - Annual and estimated world population and energy demand (A.M.Omer 2007).......................... 31
Report 5 – Mechanical – Low Carbon and Renewable Technology
1
1. EXECUTIVE SUMMARY
This report will look into the specialist topic chosen to analyse and design to be integrated with the Hotel
Project. The selected specialist topic is the Design of Low carbon and Renewable Technologies to supply
the Hotel’s Energy requirements. The report will analyse the design of the most suited Low Carbon and
Renewable Technology system as discussed in the Stage 2 Report.
Following the final selection of the appropriate Low Carbon and Renewable Technology System, they will
be analysed thoroughly to ensure they can provide the required energy requirements set out by the Hotel
and provide an appropriate final design distribution layout, which can be applied.
After the completion of the critical analysis of the Low Carbon Renewable Technologies, a final schematic
will be produced to provide a complete picture of the sized systems being integrated into the Hotel as
initially designed for. Further consideration will also be carried out to critically analyse the design carried
out to ensure the Low Carbon and Renewable Technologies Design has been designed most appropriately
and efficiently to produce the required energy requirements in return most appropriately and efficiently.
Report 5 – Mechanical – Low Carbon and Renewable Technology
2
2. INTRODUCTION
This report will look into applying renewable technologies or low carbon systems to the swimming pool
space requirements. This report will go through the calculation process of sizing each renewable
technology and determine the payback period for when that system is working with the swimming pools
requirements for the client. In Table 1 it outlines the preliminary renewable and low carbon technology
that was appraised from the stage 2 report.
Table 1 - Summary of Renewable and Low Carbon Technologies selected from Stage 2 Report
Technology Selected for next stage of design
Combined cycle gas fired systems (i.e. CHP systems) No
Wind energy Yes
Solar Photovoltaic Yes
Solar Thermal No
Geothermal Energy(Inc. Ground source heat pumps) Yes
Air source heat pump No
Biomass No
Within stage 2 of the report it was thoroughly discussed the advantages and disadvantages of using each
of the listed Renewable and Low Carbon Technologies. The report then summarised whether how the listed
systems would benefit the project depending on the application, location and viability in terms of sourcing
certain aspects such as fuel unique to each system. The selected systems from the stage 2 report will go
through the design of each of those systems and the calculation of payback periods in terms of costs to
utilise these systems and the costs being saved in using them.
The design of the renewable technologies will begin with a literature review carried out to provide an initial
understanding of how multiple renewable technologies can be utilised together to provide for one
application which is carried out as follows.
Report 5 – Mechanical – Low Carbon and Renewable Technology
3
3. LITERATURE REVIEW
A literature will be carried out to provide an understanding of the existing renewable energy sources and
the applicability of the chosen renewable systems for this project design. From this literature review
assumptions will be made for which the design of the renewable design shall be based around to provide a
applicable solution based on research and analysis of existing materials based on renewable technology.
3.1 Analysis of Renewable Technology
The existing provision of energy sources around the world are vastly growing scarce due to over use.
Therefore, it has become a reality around the world that alternative energy sources are required to fuel the
world. This statement has been back up by saying that Sustainable Energy Development Strategies
typically involve three major technological changes, energy savings on the demand side, efficiency
improvements in the energy production and replacement of fossil fuels by various sources of renewable
energy (H.Lund 2006).
Figure 1 - World primary energy supply (H.Lund 2006)
From the produced figure above it shows how the world has depended upon coal and other traditional
means of energy to supply the world’s energy needs. Although from analysing the produced graph in
Figure 1 it shows how renewable technology and other means of alternative energy sources have become
existent, however coal remains at the same requirement as before.
Awareness about oil and gas reserves depletion and the predicted Global peaking of oil production as
stated by (M.H.Albadi & E.F.El-Saadany 2009) has led to this change of view on the methods of producing
alternative energy which has been the main subject point for many years and will inevitably overcome the
use of traditional means of energy sources in the foreseeable future.
3.2 Analysis of Photovoltaic Panel
The Photovoltaic Panel renewable technology has been chosen as one of the ideal methods of producing
energy for the building given its location and other contributing factors through previously completed
analysis of renewable technology. The production of renewable energy system is rather event in
comparison to the production of coal and other fossil fuel based energy sources. Therefore, about
photovoltaic panel based systems this point is also proven by that the present commercial solar cell
converts solar energy into electricity with a relatively low efficiency, less than 20%. More than 80% of the
absorbed energy is dumped to the surroundings again after electric energy conversion has stated by
(B.J.Huang et Al 2000).
However the photovoltaic panel production is fast growing and already showing great benefits to the
worlds energy crisis as a 1-kW PV system producing 150 kWh each month prevent 75kg of fossil fuel from
being mined. It avoids 150kg of C02 from entering the atmosphere and keeps 473 Litres of water from
being consumed stated by (A.M.Omer 2007). Therefore however early the photovoltaic panel technology
has been introduced it has already proven to make a benefit to the current energy crisis.
The use of the photovoltaic panels will be continued in the design of the project as previously determined
from the analysis produced that the system will be most beneficial when used in the proposed location and
sized for the specified requirements. A further details analysis will be carried out to determine the full
output of the system and whether the photovoltaic panel system design will provide a sustainable design
approach to the projects requirements.
3.3 Analysis of Wind Power
There is a strong growth in wind installed capacity worldwide due to three main reasons as stated by
(M,H.Albadi & E.F.El-Saadany 2009), The first one is the growing public awareness and concern about
emissions, climate change, and environmental issues related to other, competing, sources of energy. It
has already been confirmed that the energy requirement of the world will not meet the existing fossil fuel
based energy sources in the world. Therefore, the developments of technologies such as wind generation
are being greatly accepted in communities as a means of saving the existing climate crisis.
The second reason as explains by (M,H.Albadi & E.F.El-Saadany 2009) is that there is a strong growth of
wind power capacity around the globe as a result of improved wind turbines technologies and increasing
environmental concerns about other competing source of energy. As the wind turbine technology continues
Report 5 – Mechanical – Low Carbon and Renewable Technology
4
to develop, so does the amount of energy that can be acquired from such technologies continue to
increase. By applying such technologies to applications, it promotes development and movement to a
better future where renewable technologies such as wind generation is used and utilised to provide the
applications energy requirements.
The third and last point made by (M,H.Albadi & E.F.El-Saadany 2009) is that the phenomenon is due to the
fact that wind power is of intermittent nature. This point will be strongly analysed within this report as it is
true that wind power is not a stable renewable technology and heavily depends on the amount of wind
available at the proposed location for the project. However as outlined earlier in the report, photovoltaic
panel technology will be combined with the energy production of the wind turbine technology to ensure
stable energy production for the project.
3.4 Analysis of Combined Technology
Following the statement provided by (H.Lund 2006) which states that Renewable Sources, such as wind
and solar, only constitute a very small share of the total supply. However, the potential is substantial.
Therefore, the decision was made to combine both technologies in order to provide the energy
requirements for the swimming pool space for the project. By harnessing the renewable technologies
advantages and working on the technologies disadvantages, the final design is aiming to be beneficial for
the projects requirements.
The combination of Photovoltaic Panel and Wind Generation technology has already been designed in other
applications and shown benefits in producing renewable energy to applications. This has been proven from
the findings acquired by (E.Koutroulis et Al 2005) where it states that Photovoltaic and Wind Generator
power sources are widely used in order to supply power to consumers in remote areas. Due to their almost
complementary power production characteristics, they are usually used in hybrid system configurations.
Careful design and configuration of the renewable technology design will be carried out to ensure the
maximum potential of both technologies are being utilised in providing the projects energy requirement. A
proven methodology provided by (E.Koutroulis et Al 2005) will be utilised as shown in Figure 2 which will
ensure the combination of both technologies has been thoroughly designed.
Figure 2 - Flowchart of a typical photovoltaic and wind generation optimization methodology (E.Koutroulis et Al
2005)
(E.Koutroulis et Al 2005) has stated that the major aspects in the design of PV and Wind Generation
systems are the reliable power supply of the consumer under varying atmospheric conditions. Following
this statement, a careful analysis of the swimming pools energy requirements will be analysed to ensure
no produced energy from the renewable technologies is dumped or wasted but utilised in other means for
the supply of energy requirements to the project in whole.
The initial design idea is to generate the renewable energy from the technologies outlined and store them
into storage batteries, which will be sized based on the peak output of the renewable technologies.
However from the statement provided by (E.Koutroulis et Al 2005) where the corresponding total cost.
Past proposed PV and Wind Generation system sizing methods suffer the disadvantage of not taking into
account system design characteristics such as the number of battery chargers. This will be taken into
account when sizing the appropriate battery storage system so as not to under size the battery storage
capacity however also maintain a reasonable oversize tolerance for the battery storage system.
Report 5 – Mechanical – Low Carbon and Renewable Technology
5
Provided that the Photovoltaic Panel and Wind Generation technology will be designed to maximise the
output generated for the swimming pool space’s requirements, this does not determine constant supply of
energy annually. This point has also been outlined by (H.Lund 2006) where there are still some technical
issues to address in order to cope with the intermittency of some renewables, particularly wind and solar.
Therefore the existing sized energy sources will remain sized for the swimming pool space to ensure
provision of energy but will run at part load as of when the renewable technologies designed does not
meet the applications requirements.
3.5 Effects on Project
From the statement provided by (H.Lund 2006) which states that one challenge is to integrate a high
share of intermittent resources into the energy system, especially the electricity supply. From this, the
renewable technologies sized will be carefully analysed to ensure that the generated energy is utilised
appropriately and not dumped meaninglessly.
The typical system design is outlined as shown within Figure 3 which shows how when utilising both wind
generation and photovoltaic panel technology into an application there is system dumping of energy. The
renewable system design for the swimming pool space will be carefully designed to ensure no such
dumping is present, however the excess energy produced will be utilised elsewhere within the project.
Figure 3 - Stand Alone Wind and PV generating system configuration (M.H.Nehrir et Al 2000)
To summarise the analysis of acquired literature based on renewable technologies and design approaches
to be taken when designing the Photovoltaic Panel and Wind Generation systems for the swimming pool
energy requirements will be utilised when carrying out the appropriate design methodology for determine
the relevant components to make the whole system work for the supply the relevant energy requirements.
Furthermore, it has been proven that relying on existing traditional methods of provision of energy for
applications about coal and oil is fast growing out of touch with current methods of provision of energy
requirements to applications. Figure 4 provides an illustration of how the current oil productions are slowly
decreasing where inevitably it will run out. Therefore, the world will turn to renewable technologies as an
alternative in providing the necessary requirements.
This being said it should be noted that renewable technologies is improving in terms of minimising the
available disadvantages associated with each technology and maximising the possible advantages.
Therefore by utilising such technologies into applications such as being designed for the hotel projects
requirements will provide the development necessary in ensuring these technologies are being noticed and
working efficiently in providing a sustainable future to live in.
Figure 4 - World Oil productions in the next 10-20 years (A.M.Omer 2007)
Report 5 – Mechanical – Low Carbon and Renewable Technology
6
4. LOCATION ANALYSIS
The project is located in Southampton within the city centre free of obstruction from other local buildings
as shown in Figure 5 the building is estimated at a height of 80 meters which clears all sky lines with all
other buildings in the surrounding area to obstruct solar gain as well as air flow.
The building also has plenty of available space to utilize the accommodation of plant as well as free space
for underground plant to accommodate services required for the renewable and low carbon systems. This
will greatly benefit the Ground Source Heat Pump (GSHP) system as well as the Wind Turbine System.
The available roof space to accommodate the solar panels for the swimming pool space is limited due to
the plant that is required to be placed at both the roof level as well as the terrace level on the 2nd
floor
adjacent to the plant room. Although the design of the Photovoltaic (PV) panel design will work around the
set limitations.
Figure 6 illustrates the indicative free roof space available for the PV design to be applied to.
Figure 7 illustrates the indicative free floor area on site available for the Wind Turbine Design and the
Ground Source Heat Pump Array.
Figure 6 -Available roof space for PV Panel
Figure 7 - Available Terrace roof space for PV Panel
The weather conditions at Southampton are based on the produced data from APACHE Weather data as
used in previous reports. Below is a summary of the external summer and winter conditions at the
proposed locations.
285.5 m2
Figure 5 - Site Plan of Project Building within City Centre Location
173.1 m2
Report 5 – Mechanical – Low Carbon and Renewable Technology
7
Figure 8 - IES VE Provided Solar Path Analysis
Summer Design Temperature: 28.900
C DB 19.400
C WB
Peak Month: August
Winter Design Temperature: -2.400
C DB -2.400
C WB
Peak Month: February
The provided information for the external weather conditions during the summer and winter periods will
not benefit the design of the selected systems. The relevant information required for the systems are as
follows.
5th
June (North Facing Facades) 5th
June (South Facing Facades)
The PV Design is the process of converting direct sun light to DC electricity which is then used to provide
the requirements intended for. Therefore the Solar path of the sun at the location specified needs to be
analysed which can be done by using IES VE Software. As Figure 8 with the surrounding buildings being
placed around the building model there is no obstructions to be seen at when the sun is most convenient
in providing energy to the PV Panels.
The wind turbines will be dependent upon the amount of air flow that will be experienced at the proposed
location to stimulate the rotation of the wind turbines. The information with regards to the available wind
flow at the proposed location will be provided by APACHE Weather data files, which is illustrated as a
diagram by IES VE Software as shown in Figure 9.
From the wind diagram as shown above, it provides an indicative idea of the mean wind velocity based on
annual results acquired by IES VE software. This information will be later used for the Wind Turbine
analysis within this report.
1
3
2
Figure 9 - IES VE Produced Wind Diagram
Report 5 – Mechanical – Low Carbon and Renewable Technology
8
5. PHOTOVOLTAIC DESIGN APPRAISAL
The Photovoltaic design will analyse the performance of 3 different photovoltaic panels which can produce
the required load for the swimming pool space as indicated in Report 3 for Specialist Design, the most
suitable inverter will also need to be sized to suit the array layout designed within this section of the report
and then determine the annual energy prediction and payback period incorporated with the ideal PV
Design layout for the swimming pools requirements.
Initially the Photovoltaic panels will be made from Monocrystalline silicon cells instead of polycrystalline
cells due to the higher efficiency of a range of 15-18% compared to the 13-16% efficiency from using
polycrystalline. However, where the monocrystalline silicon cells benefit in better efficiency compared to
the polycrystalline cells, they are more expensive because of this. However, monocrystalline silicon cells
will be utilised within this project, as cost is not an option as outlined by the client who is after a
sustainable final product.
The installation of the PV Panels on the building is considered where to install them. The options on where
to install them are as follows:
 Sloping and Flat Roofs
 Building Facades
 Glass Roof Structures
 Solar Shading Devices
About the options outlined above, the flat roof surface is the most appropriate choice of installing the PV
Panels on. This is because to incorporate the PV Panels into the building facades will disrupt the existing
glazing render, as there is no visible space to place the PV Panels on the building façade. With regards to
the glass roof structure, this does not seem a viable option due to the existence of plant within the ceiling
void of the roof space which would be visible and may produce further problems with overheating risks of
pipe runs and tempering of air flow within ductwork to the excess solar gain experienced. The use of solar
shading devices within this project are utilised by the use of the balcony’s on each floor to each hotel
space. However, the angle at which to install the PV Panels onto the balcony’s shows to be a none
beneficial method of installation to maximise the direct sunlight experienced at peak times during the day
based on the solar path diagram produced by IES VE Software. Therefore, the roof space makes to be a
viable area of installing the PV Panels on due to the unlimited variations of orientation and angle of
installing with use of different mounting methods to maximise the direct sunlight experienced.
The installation process of the PV Panels on the roof will be taken up by the manufactures who install them
directly to the project at the proposed space on the roof with reference to the roof space drawings
produced by the Architectural Engineering Engineer, which will be produced within the drawings package.
To summarise the roof mounted application for the PV Panel will be fitted using a metal frame at the
proposed angle and orientation. The metal frame will need to consider the follow lowing criteria’s:
 The electrical fittings and connections as well as cables will need
protection as they are exposed to the elements being external
 The metal frame must be able to withstand the forces that can occur
on the PV Panels such as Wind and Snow.
 The consideration of safe and easy access to the PV Panels for
maintenance and cleaning.
The Design process will consist of various stages to complete the design. The first part is to compare PV
Modules technically which will be used in the design process. Therefore, Table 2 outlines the three PV
Modules, which will be used to compare within the design process later on in this report.
Figure 10 illustrates the process of how the Photovoltaic Design will benefit the design of the swimming
pools requirements.
Charge
Controller
Battery System
Inverter
AC Power
DC Power
Figure 10 - Illustration of how Photovoltaic Panels work
Report 5 – Mechanical – Low Carbon and Renewable Technology
9
5.1 Photovoltaic Panel Comparison
Within Table 2 three PV Module have been chosen from various manufactures with various technical
specifications. Initially within the report it was stated as a product brief that the involvement of
Polycrystalline modules will not be included within the selection however the stated efficiency by BP
manufacture for polycrystalline modules are at 17% and the monocrystalline module produced by the
same manufacture has an efficiency of 11.6% therefore the selection will be based on the efficiency of the
modules rather than the type of material the modules are made from.
Table 2 - Selection of PV Modules to be used in design calculation comparison
Performance &
Characteristic
BP Solar 5170S
Monocrystalline
Module
BP375 polycrystalline
silicon module
Hyundai -
Solar Mono-crystalline
Type 250
Maximum Power
(Watts)
75 170 260
Maximum Voltage
(Volts)
17.3 36.0 31.1
Maximum Current
(Amps)
4.35 4.72 8.4
Open circuit voltage
(Volts)
21.8 44.2 37.9
Short Circuit Current
(Amps)
4.75 5.00 8.9
TC Short Circuit
Current (%/°C)
0.065 0.065 0.032
TC Open Circuit
Voltage (V/°C)
- 0.08 -0.16 -0.33
TC Maximum Power
(%/°C)
- 0.5 -0.5 -0.45
Width (mm) 537 790 998
Length (mm) 1204 1593 1640
Module Efficiency (%) 11.6 17.0 15.9
From the produced PV Module comparison layout, the three different design comparisons can be carried
out. As each calculation, process will be similar to each other. The Hyundai Solar Mono-crystalline Type
250 Module will be chosen to illustrate the full calculation process of determining the various electrical
requirements and array design.
Furthermore as there are two roof spaces where the PV Panels will be located, there will be two main
calculations where the PV Panels will be orientated in two different positions with 2 sub calculations within
each main calculation for the PV Panel string distribution. Therefore the total in four indicative PV Panel
string distributions for each of the roof spaces are shown as follows.
As each calculation process will be the same, from the two indicative locations chosen to locate the PV
Panel array only one will be chosen to continue the calculation with. The final section of the PV Design
appraisal will finalise the sized systems.
An indicative image of the Photovoltaic Panel that will be used is shown in Figure 11 the chosen PV panel
to continue with in the calculation process has the highest Maximum Power output and the most efficient
panel as discussed within this section.
Figure 11 - An Indicative image of the chosen Hyundai Solar Mono Crystaline Type
250 PV Module
Report 5 – Mechanical – Low Carbon and Renewable Technology
10
5.1.1 PV Panel Array Output Calculation
As mentioned in the earlier section of the report, the PV Panel array will be assorted in 4 different options.
Each option has been sorted in such a way to emphasize the benefits of that distribution to overall PV
Panel Array output and the feasibility of the distribution. The 4 different options have been outlined as
follows below.
Option 1 – 70 PV Panels – The PV Panels will be orientated in the given space on the roof space to
maximise the amount of PV Panels that can be installed on which in this case is 70. The PV Panels will be
connected to each other in one string connection to minimise the current used to utilise the PV Array,
however the disadvantage of this method is that if one of the PV Panels receive insufficient direct Solar
Gain from the Suns solar path then all the PV modules connected in series will stop working as they are in
series. Option 1 has been illustrated as shown in Figure 12 below.
Figure 12 - Option 1 on the Roof Space with 70 panels linked in one string
Option 2 – 77 PV Panels – Orientating the PV Panel modules 90 degrees benefited this manoeuvre by
increasing the maximum amiable PV Panels that can fitted into the space given. The PV Panels will be
again connected in one series which provides the same risk as option 1 where if one of the modules do not
receive direct Solar gain from the Sun solar path the other modules in series will be limited in maximising
their potential of providing an output. Option 2 has been illustrated as shown in Figure 13 below
Figure 13 - Option 2 on the Terrace Roof Space with 77 panels linked in one string
Option 3 – 70 PV Panels – Analysing the recurring disadvantages outline from options 1 and 2, the current
option consist of having 2 strings connecting the PV Panel modules where each string has 35 modules
connected in series. The benefit of the split strings is so that it reduces the chance of a single module
effecting the whole series if the total amount of modules are connected in two series so therefore if one
string does get effected of the limited direct solar gain upon one of the modules in that series, the other
series of 35 modules will be able to continue to provide sufficient output. Option 3 has been illustrated as
shown in Figure 14 below.
Report 5 – Mechanical – Low Carbon and Renewable Technology
11
Figure 14 - Option 3 on the Terrace Roof Space with 70 panels linked by 2 strings
Option 4 – 77 PV Panels – by using the orientation chosen in option 2 where it was assessed that the
maximum number of PV Panels could be fitted into the space given so therefore this has been chosen.
Furthermore to Option 3’s analysis of using 2 strings in the PV Panel array design, this option will uses 7
strings with 11 modules in each string. This will benefit the overall design as using the solar path analysis
from Figure 8 near the beginning of the report, it is clear to see that the terrace roof space being analysed
will be at times be in shade during the day to the higher adjacent part of the building. For this reason, it
seems ideal to maximise the amount of strings within this PV Panel array design to minimise the risk of a
large section of the array being unable to produce an output due to the limit in modules in series. Option 4
has been illustrated as shown in Figure 15 below.
Figure 15 - Option 4 on the Terrace Roof Space with 77 Panels linked by 11 Strings
Each of the options outlined above will be used to calculate the various results to be used in a comparison
of the suitability in sizing an inverter. Option 1 will be the chosen to carry out the full calculation processes
of acquiring the following results.
 Equation 1 – MFF Voltage @ 60°C (Volts)
 Equation 2 – VocVoltage @ -10°C (Volts)
 Equation 3 – String Voltage @ Min Module Voltage Range (Volts)
 Equation 4 – String Voltage @ STC Module Voltage Range (Volts)
 Equation 5 – String Voltage @ Maximum Module Voltage Range (Volts)
 Equation 6 – Maximum Array Current (Amps)
 Equation 7 – Required Inverted Rated Power (Watts)
By acquiring the calculated results for each option, it can then be used to size the required inverter to suit.
Report 5 – Mechanical – Low Carbon and Renewable Technology
12
5.1.2 Voltage Range Calculation
Below are the reasonable minimum and maximum voltage ranges expected for the Hyundai Solar Mono-
Crystalline panel. A Voltage of 31.1 has already been stated for Standard Test Conditions at 25°C.
𝑴𝑷𝑷 𝑽𝒐𝒍𝒕𝒂𝒈𝒆 @ 𝟔𝟎℃ = 𝑽𝒐𝒍𝒕𝒂𝒈𝒆 @ 𝟐𝟓℃ + (𝑻𝒆𝒎𝒑 𝒄𝒐𝒆𝒇𝒇 𝒐𝒇 𝑽𝒐𝒍𝒕𝒂𝒈𝒆 × (𝟔𝟎 − 𝟐𝟓))
Where:
𝑀𝑃𝑃 𝑉𝑜𝑙𝑡𝑎𝑔𝑒 @ 60℃ 𝑖𝑠 𝑡𝑜 𝑏𝑒 𝑐𝑎𝑙𝑐𝑢𝑙𝑎𝑡𝑒𝑑
𝑉𝑜𝑙𝑡𝑎𝑔𝑒 @ 25℃ 𝑡𝑜 𝑏𝑒 31.1 𝑉
𝑇𝑒𝑚𝑝 𝑐𝑜𝑒𝑓𝑓 𝑜𝑓 𝑉𝑜𝑙𝑡𝑎𝑔𝑒 𝑡𝑜 𝑏𝑒 − 0.33 V/°C
Therefore:
𝑀𝑃𝑃 𝑉𝑜𝑙𝑡𝑎𝑔𝑒 @ 60℃ = 31.1 + (−0.33 × (60 − 25))
𝑴𝑷𝑷 𝑽𝒐𝒍𝒕𝒂𝒈𝒆 @ 𝟔𝟎℃ = 𝟏𝟔. 𝟐𝟓 𝑽
Now the MPP Voltage @60°C has been confirmed, the Voc Voltage @-10°C can be confirmed using the
value already stated in table …. For Standard Test Conditions at -10°C to be 37.9 V as shown below.
𝑽𝒐𝒄 𝑽𝒐𝒍𝒕𝒂𝒈𝒆 @ − 𝟏𝟎℃ = 𝑽𝒐𝒄 @ 𝟐𝟓℃ + (𝑻𝒆𝒎𝒑 𝒄𝒐𝒆𝒇𝒇 𝒐𝒇 𝑽𝒐𝒍𝒕𝒂𝒈𝒆 × (−𝟏𝟎 − 𝟐𝟓))
Where:
𝑉𝑜𝑐 𝑉𝑜𝑙𝑡𝑎𝑔𝑒 @ − 10℃ 𝑖𝑠 𝑡𝑜 𝑏𝑒 𝑐𝑎𝑙𝑐𝑢𝑙𝑎𝑡𝑒𝑑
𝑉𝑜𝑐 @ 25℃ 𝑖𝑠 𝑡𝑜 𝑏𝑒 37.9 𝑉
Therefore:
𝑉𝑜𝑐 𝑉𝑜𝑙𝑡𝑎𝑔𝑒 @ − 10℃ = 37.9 + (−0.33 × (−10 − 25))
𝑽𝒐𝒄 𝑽𝒐𝒍𝒕𝒂𝒈𝒆 @ − 𝟏𝟎℃ = 𝟒𝟗. 𝟒 𝟓 𝑽
Using the acquired two voltage figures for different set conditions the Voltage range per string as shown
below.
The minimum String voltage value can be determined by using the following calculation.
𝑺𝒕𝒓𝒊𝒏𝒈 𝑽𝒐𝒍𝒕𝒂𝒈𝒆 @ 𝒎𝒊𝒏 𝒎𝒐𝒅𝒖𝒍𝒆 𝒗𝒐𝒍𝒕𝒂𝒈𝒆 = 𝑴𝒐𝒅𝒖𝒍𝒆 𝑴𝑷𝑷 𝑽𝒐𝒍𝒕𝒂𝒈𝒆 @ 𝟔𝟎℃ × 𝑺𝒕𝒓𝒊𝒏𝒈 𝑳𝒆𝒏𝒈𝒕𝒉
Where:
𝑆𝑡𝑟𝑖𝑛𝑔 𝑉𝑜𝑙𝑡𝑎𝑔𝑒 @ 𝑚𝑖𝑛 𝑚𝑜𝑑𝑢𝑙𝑒 𝑣𝑜𝑙𝑡𝑎𝑔𝑒 𝑡𝑜 𝑏𝑒 𝑐𝑎𝑙𝑐𝑢𝑙𝑎𝑡𝑒𝑑
𝑀𝑜𝑑𝑢𝑙𝑒 𝑀𝑃𝑃 𝑉𝑜𝑙𝑡𝑎𝑔𝑒 @ 60℃𝑖𝑠 𝑡𝑜 𝑏𝑒 16.25 𝑉
𝑆𝑡𝑟𝑖𝑛𝑔 𝐿𝑒𝑛𝑔𝑡ℎ 𝑖𝑠 𝑡𝑜 𝑏𝑒 70 𝑀𝑜𝑑𝑢𝑙𝑒𝑠 𝑖𝑛 𝑜𝑛𝑒 𝑠𝑡𝑟𝑖𝑛𝑔
Therefore:
𝑆𝑡𝑟𝑖𝑛𝑔 𝑉𝑜𝑙𝑡𝑎𝑔𝑒 @ 𝑚𝑖𝑛 𝑚𝑜𝑑𝑢𝑙𝑒 𝑣𝑜𝑙𝑡𝑎𝑔𝑒 = 16.25 × 70 = 1137.5
𝑺𝒕𝒓𝒊𝒏𝒈 𝑽𝒐𝒍𝒕𝒂𝒈𝒆 @ 𝒎𝒊𝒏 𝒎𝒐𝒅𝒖𝒍𝒆 𝒗𝒐𝒍𝒕𝒂𝒈𝒆 = 𝟏𝟏𝟑𝟕. 𝟓 𝑽
The Minimum voltage requirement has been determined per string, so therefore the STC voltage for each
string needs to be confirmed using the following calculation.
𝑺𝒕𝒓𝒊𝒏𝒈 𝑽𝒐𝒍𝒕𝒂𝒈𝒆 @ 𝑺𝑻𝑪 𝒎𝒐𝒅𝒖𝒍𝒆 𝒗𝒐𝒍𝒕𝒂𝒈𝒆 = 𝑴𝒐𝒅𝒖𝒍𝒆 𝑴𝑷𝑷 𝑽𝒐𝒍𝒕𝒂𝒈𝒆 @ 𝟐𝟓℃ × 𝑺𝒕𝒓𝒊𝒏𝒈 𝑳𝒆𝒏𝒈𝒕𝒉
Where:
𝑆𝑡𝑟𝑖𝑛𝑔 𝑉𝑜𝑙𝑡𝑎𝑔𝑒 @ 𝑆𝑇𝐶 𝑚𝑜𝑑𝑢𝑙𝑒 𝑣𝑜𝑙𝑡𝑎𝑔𝑒 𝑖𝑠 𝑡𝑜 𝑏𝑒 𝑐𝑎𝑙𝑐𝑢𝑙𝑎𝑡𝑒𝑑
𝑀𝑜𝑑𝑢𝑙𝑒 𝑀𝑃𝑃 𝑉𝑜𝑙𝑡𝑎𝑔𝑒 @ 25℃ 𝑖𝑠 𝑡𝑜 𝑏𝑒 31.1 𝑉
Therefore:
𝑆𝑡𝑟𝑖𝑛𝑔 𝑉𝑜𝑙𝑡𝑎𝑔𝑒 @ 𝑆𝑇𝐶 𝑚𝑜𝑑𝑢𝑙𝑒 𝑣𝑜𝑙𝑡𝑎𝑔𝑒 = 31.1 × 70
𝑺𝒕𝒓𝒊𝒏𝒈 𝑽𝒐𝒍𝒕𝒂𝒈𝒆 @ 𝑺𝑻𝑪 𝒎𝒐𝒅𝒖𝒍𝒆 𝒗𝒐𝒍𝒕𝒂𝒈𝒆 = 𝟐𝟏𝟕𝟕 𝑽
The STC voltage requirement has been determined per string so therefore the Maximum Voltage for each
string can now be confirmed using the following calculation.
𝑺𝒕𝒓𝒊𝒏𝒈 𝑽𝒐𝒍𝒕𝒂𝒈𝒆 @ 𝒎𝒂𝒙 𝒎𝒐𝒅𝒖𝒍𝒆 𝒗𝒐𝒍𝒕𝒂𝒈𝒆 = 𝑴𝒐𝒅𝒖𝒍𝒆 𝑴𝑷𝑷 𝑽𝒐𝒍𝒕𝒂𝒈𝒆 @ − 𝟏𝟎℃ × 𝑺𝒕𝒓𝒊𝒏𝒈 𝑳𝒆𝒏𝒈𝒕𝒉
Where:
𝑆𝑡𝑟𝑖𝑛𝑔 𝑉𝑜𝑙𝑡𝑎𝑔𝑒 @ 𝑚𝑎𝑥 𝑚𝑜𝑑𝑢𝑙𝑒 𝑣𝑜𝑙𝑡𝑎𝑔𝑒 = 𝑀𝑜𝑑𝑢𝑙𝑒 𝑀𝑃𝑃 𝑉𝑜𝑙𝑡𝑎𝑔𝑒 @ − 10℃ × 𝑆𝑡𝑟𝑖𝑛𝑔 𝐿𝑒𝑛𝑔𝑡ℎ
Therefore:
𝑆𝑡𝑟𝑖𝑛𝑔 𝑉𝑜𝑙𝑡𝑎𝑔𝑒 @ 𝑚𝑎𝑥 𝑚𝑜𝑑𝑢𝑙𝑒 𝑣𝑜𝑙𝑡𝑎𝑔𝑒 = 49.45 × 70
𝑺𝒕𝒓𝒊𝒏𝒈 𝑽𝒐𝒍𝒕𝒂𝒈𝒆 @ 𝒎𝒂𝒙 𝒎𝒐𝒅𝒖𝒍𝒆 𝒗𝒐𝒍𝒕𝒂𝒈𝒆 = 𝟑𝟒𝟔𝟏. 𝟓 𝑽
Report 5 – Mechanical – Low Carbon and Renewable Technology
13
To be able to accurately size the inverter the maximum array current and the required inverter rated
power has to be calculated. After this stage the inverter parameters have been found and a suitable
inverter can be selected. To do so, the maximum array current, array power and the required inverter
rated power need to be determined where the calculations are shown below.
𝑴𝒂𝒙𝒊𝒎𝒖𝒎 𝑨𝒓𝒓𝒂𝒚 𝑪𝒖𝒓𝒓𝒆𝒏𝒕 = 𝑴𝒂𝒙 𝑺𝒕𝒓𝒊𝒏𝒈 𝒄𝒖𝒓𝒓𝒆𝒏𝒕 × 𝑵𝒐. 𝒐𝒇 𝑺𝒕𝒓𝒊𝒏𝒈𝒔
Where:
𝑀𝑎𝑥𝑖𝑚𝑢𝑚 𝐴𝑟𝑟𝑎𝑦 𝐶𝑢𝑟𝑟𝑒𝑛𝑡 𝑛𝑒𝑒𝑑𝑠 𝑡𝑜 𝑏𝑒 𝑐𝑎𝑙𝑐𝑢𝑙𝑎𝑡𝑒𝑑
𝑀𝑎𝑥 𝑆𝑡𝑟𝑖𝑛𝑔 𝑐𝑢𝑟𝑟𝑒𝑛𝑡 𝑡𝑜 𝑏𝑒 8.4 𝐴𝑚𝑝𝑠
𝑇ℎ𝑒 𝑛𝑢𝑚𝑏𝑒𝑟 𝑜𝑓 𝑠𝑡𝑟𝑖𝑛𝑔𝑠 𝑤𝑖𝑙𝑙 𝑏𝑒 𝑜𝑛𝑒 𝑤ℎ𝑒𝑟𝑒 𝑡ℎ𝑒𝑟𝑒 𝑤𝑖𝑙𝑙 𝑏𝑒 70 𝑚𝑜𝑑𝑢𝑙𝑒𝑠 𝑐𝑜𝑛𝑛𝑒𝑐𝑡𝑒𝑑 𝑖𝑛 𝑠𝑒𝑟𝑖𝑒𝑠
𝑀𝑎𝑥𝑖𝑚𝑢𝑚 𝐴𝑟𝑟𝑎𝑦 𝐶𝑢𝑟𝑟𝑒𝑛𝑡 = 8.4 × 1
𝑴𝒂𝒙𝒊𝒎𝒖𝒎 𝑨𝒓𝒓𝒂𝒚 𝑪𝒖𝒓𝒓𝒆𝒏𝒕 = 𝟖. 𝟒 𝑨𝒎𝒑𝒔
The maximum current has been determined so therefore following this to finalise the selection of the
inverter, a requirement of the expected array power output needs to be confirmed of the whole array
which can be determined by using the following calculation.
𝑨𝒓𝒓𝒂𝒚 𝑷𝒐𝒘𝒆𝒓 (𝑾𝒂𝒕𝒕𝒔) = 𝑴𝒐𝒅𝒖𝒍𝒆 𝑷𝒎𝒂𝒙 × 𝑵𝒐. 𝒐𝒇 𝒎𝒐𝒅𝒖𝒍𝒆𝒔
Where:
𝐴𝑟𝑟𝑎𝑦 𝑃𝑜𝑤𝑒𝑟 (𝑊𝑎𝑡𝑡𝑠) 𝑡𝑜 𝑏𝑒 𝑐𝑎𝑙𝑐𝑢𝑙𝑎𝑡𝑒𝑑
𝑀𝑜𝑑𝑢𝑙𝑒 𝑃𝑚𝑎𝑥 𝑡𝑜 𝑏𝑒 260 𝑊
𝑁𝑢𝑚𝑏𝑒𝑟 𝑜𝑓 𝑚𝑜𝑑𝑢𝑙𝑒𝑠 𝑡𝑜 𝑏𝑒 70 𝑖𝑛 𝑡ℎ 𝑒𝑠𝑖𝑧𝑒𝑑 𝑎𝑟𝑟𝑎𝑦
Therefore:
𝐴𝑟𝑟𝑎𝑦 𝑃𝑜𝑤𝑒𝑟 (𝑊𝑎𝑡𝑡𝑠) = 260 × 70
𝑨𝒓𝒓𝒂𝒚 𝑷𝒐𝒘𝒆𝒓 (𝑾𝒂𝒕𝒕𝒔) = 𝟏𝟖𝟐𝟎𝟎 𝑾
Now that the final total array power has been determined, this power requirement needs to be within the
capabilities of the selected inverter to produce as AC Current into the Building. Therefore using the
following calculation the required inverter rated power can be determined.
𝑹𝒆𝒒𝒖𝒊𝒓𝒆𝒅 𝑰𝒏𝒗𝒆𝒓𝒕𝒆𝒓 𝑹𝒂𝒕𝒆𝒅 𝑷𝒐𝒘𝒆𝒓 = 𝑨𝒓𝒓𝒂𝒚 𝑷𝒐𝒘𝒆𝒓 × 𝑷𝒓𝒆𝒇𝒆𝒓𝒓𝒆𝒅 𝑰𝒏𝒗𝒆𝒓𝒕𝒆𝒓 𝑺𝒊𝒛𝒆
Where:
𝑅𝑒𝑞𝑢𝑖𝑟𝑒𝑑 𝐼𝑛𝑣𝑒𝑟𝑡𝑒𝑟 𝑅𝑎𝑡𝑒𝑑 𝑃𝑜𝑤𝑒𝑟 𝑖𝑠 𝑡𝑜 𝑏𝑒 𝑐𝑎𝑙𝑐𝑢𝑙𝑎𝑡𝑒𝑑
𝐴𝑟𝑟𝑎𝑦 𝑃𝑜𝑤𝑒𝑟 ℎ𝑎𝑠 𝑏𝑒𝑒𝑛 𝑐𝑎𝑙𝑐𝑢𝑙𝑎𝑡𝑒𝑑 𝑡𝑜 𝑏𝑒 18200 𝑊
𝑃𝑟𝑒𝑓𝑒𝑟𝑟𝑒𝑑 𝐼𝑛𝑣𝑒𝑟𝑡𝑒𝑟 𝑆𝑖𝑧𝑒 𝑡𝑜 𝑏𝑒 𝑎 𝑓𝑎𝑐𝑡𝑜𝑟 𝑜𝑓 0.8
Therefore:
𝑅𝑒𝑞𝑢𝑖𝑟𝑒𝑑 𝐼𝑛𝑣𝑒𝑟𝑡𝑒𝑟 𝑅𝑎𝑡𝑒𝑑 𝑃𝑜𝑤𝑒𝑟 = 18200 × 0.8
𝑹𝒆𝒒𝒖𝒊𝒓𝒆𝒅 𝑰𝒏𝒗𝒆𝒓𝒕𝒆𝒓 𝑹𝒂𝒕𝒆𝒅 𝑷𝒐𝒘𝒆𝒓 = 𝟏𝟒𝟓𝟔𝟎 𝒓𝒂𝒕𝒆𝒅 𝑾𝒂𝒕𝒕𝒔
As a similar calculation process will be carried out for the other options shown in Figures 12, 13, 14 and 15
they have been carried out and summaried in Table 3 for the various variables and options they relate to
as shown below.
Table 3 - PV Panel Option Comparison
Option 1 Option 2 Option 3 Option 4
MPP Voltage @ 60℃
(Volts)
16.25 16.25 16.25 16.25
Voc Voltage @-10℃
(Volts)
49.45 49.45 49.45 49.45
String Voltage @ min module voltage
(Volts)
1137.5 1251.25 568.75 178.75
String Voltage @ STC module voltage
(Volts)
2177 2394.7 1088.5 342.1
String Voltage @ max module voltage
(Volts)
3461.5 3807.65 1730.75 543.95
Maximum Array Current
(Amps)
8.4 8.4 16.8 58.8
Array Power
(Watts)
18200 20020 18200 20020
Required Inverter Rated Power
(Watts)
14560 16016 14560 16016
From the produced summary of values for each of option analysed it shows clearly that each option is not
capatiable with the required interter sizing.
Report 5 – Mechanical – Low Carbon and Renewable Technology
14
5.2 Inverter Selection
To determine the suitable inverter to the produced table in previous chapter summarising the finalised
optins for the PV Panel module a selection process is required as shown in this section of the report. The
requirement of the the inverters is to change the received solar gain stored within the PV Panels into DC
Electricity which is then used within the uilding to feed the requiremens it is inteneded for.
Using the acquired information from the previous chapter on required inverter rated powers for the various
options, the suitable inverters can be selected as shown below.
5.2.1 Summary of Inverter size Choices
From the outlined requirements for the inverter slection as shown in Table 4 the ideal inverters to those
options have been outlined as follows in Table 4.
Table 4 - comparison of chosen Array Design and chosen Inverter Suitability
Inverter
rated power
(Watts)
Minimum
MMP Input
Voltage less
than (Volts)
Maximum
MMP Input
Voltage
greater than
(Volts)
Midrange of
MMP Voltage
Range to be
circa (Volts)
Maximum
Input Current
greater than
(Amps)
Option 1 14560 1137.50 3461.50 2177.00 8.40
Option 2 16016 1251.25 3807.65 2394.70 8.40
Option 3 14560 568.75 1730.50 1088.50 16.80
Option 4 16016 178.75 543.95 342.10 58.80
Indicative
Inverter
Selection
20440 150 1000 800 33
From the produced table above it is clear to see the produced option do not comply with the required
invter sizing. Below is a summary of how each option does not comply with the required inverter sizing as
follows.
 Option 1 – The minimum input and maximum voltage requirements for this option far
exceeds the capability of the sized Inverter however the maximum input current
requirements is within the requirement of the invter
 Option 2 – Option 2 is similar to Option 1 where the maximum and minimum input voltages
far exceed the capabilities of the inverter hwoever the input current requirement is within
the inverters capabilities.
 Option 3 – Option 3 is yet again similar to Options 1 and 2 however has shown
improvements in the magnitude of how much the option exceeds the inverters requirements
in the maximum and minimum input voltages range however an increase in the maximum
input current has been experienced although still within the inverters requirements.
 Option 4 – This option is the most suitable option to the sized inverter as the maximum and
minimum input voltage ranges are within the capabilities of the inverter although the
maximum input current exceeds the capabilities of the sized inverter.
Following the analysis of each option, Option 4 seems to be the most suitable option although there is a
single requirement which does not fit the invertes requirements. Therefore a further analysis into this
option to find a suitable inverter will be carried out as follows.
5.2.2 Revised PV Array Selection
Option 4 is proposed to run on two separate inverters which will then feed the corresponding battery as
follows. Therefore the following loads will be acquired for each inverter following the same calculation
process as shown previously within this report as follows.
From the previous analysis, it has been found that each string consists of too much voltage capacity for a
suitable inverter to size. Therefore with this revised option it has been optimised to maintain aa low
maximum urrent whilst also maintaining a a sufficient amoun t of voltage capacity within each sting with
wil have its own inverter to suit. Therefore two further options have been created to optimise the
appropriate inverter selection.
Report 5 – Mechanical – Low Carbon and Renewable Technology
15
The first option consists of 70 modules where each string will conist of 14 modules with 5 inverters fitting
to each set of 14 modules therefore 5 inverters will be required each with the same loads. To illustrate this
option, Figure 16 shows this.
Figure 16 - Indicative PV Panel array design of 70 Modules with 5 inverters connected
The second option produced consists of 77 modules which will been arranged where one string will contain
11 modules connected inseries and also linked to one inverter. Therefore in total there will be a total of 7
separate strings each with their own sized inverter to suit. To illustrate this option Figure 17 shows this.
Figure 17 - Indicative PV Panel array design of 77 Modules with 7 inverters connected
From the produced illustration of how the the PV array will be formed, the following inverter sizes to suit
each section of the PV Array can be determined by the following Inverter analysis as provided by Table 5.
Report 5 – Mechanical – Low Carbon and Renewable Technology
16
Table 5 - Comparison of Final two options for PV Panel Array design
Option 1 Option 2
Number of PV Modues 14 11
Array power (Watts) 3640 2860
Inverter rated power (Watts) 2912 2288
Minimum MMP Input Voltage less than (Volts) 227.5 178.75
Maximum MMP Input Voltage greater than
(Volts)
692.3 543.95
Midrange of MMP Voltage Range to be circa
(Volts)
435.4 342.1
Maximum Input Current greater than (Amps) 8.4 8.4
From the produced table above the new selection for the PV Array has been confirmed. Using the tabe
contents the suitable inverter can be sized. This will be confirmed by a comparison of the most suitable
inverter to the provided selection of eavh section of the total PV Array. This is shown as follows in Table 6.
Table 6 - Inverter Comparison to best suit final selected PV Panel Array Options
Inverter
rated power
(Watts)
Minimum
MMP Input
Voltage less
than (Volts)
Maximum
MMP Input
Voltage
greater than
(Volts)
Midrange of
MMP Voltage
Range to be
circa (Volts)
Maximum
Input Current
greater than
(Amps)
Inverter 1 2650 80 600 260 - 500 10
Inverter 2 6280 150 750 350 - 500 15
Inverter 3 5200 150 750 175 - 500 15
Option 1
2912 227.5 692.3 435.4 8.4
Inverter 1 as
proven to be
inacapable of
supporting the
required
inverter
requirements
Inverter 2 & 3
fits this criteria
appropriately
with sufficient
performance
gap sized
Inverter 2 & 3
fits this criteria
appropriately
with sufficient
performance
gap sized
All of the
selected
invierters fit
this criteria
Inverter 1 fits
this criteria
appropriately
with sufficient
performance
gap sized
Option 2
2288 178.75 543.95 342.1 8.4
Inverter 1 fits
this criteria
appropriately
with sufficient
performance
gap sized
All of the
selected
inverters fit
this criteria
Inverter 1 fits
this criteria
appropriately
with sufficient
performance
gap sized
All of the
selected
inverters fit
this criteria
Inverter 1 fits
this criteria
appropriately
with sufficient
performance
gap sized
From the produced table above with the analysis of the selected 3 inverters to suit the two poptions
produced, it seems there have been two outcomes made from this.
Report 5 – Mechanical – Low Carbon and Renewable Technology
17
 Option 1 – Inverter 3 – the reason for the selected inverter is that between inverter options 2 & 3
the rated power is the main variance where inverter 2 has a rated power of 6280 watts and inverter
3 has a rated power of 5200 therefore inverter 3 is closer to the required capabilities of the sized
option 1 array so has been selected as the appropriate inverter choice.
 Option 2 – Inverter 1 – this inverter selection suits the 2nd
array options most appropriately from the
inverter rated power to the maximum current available. All of the requirements stated by the
technical data sheet for the inverter mst suit the sized array option. The other advantage is that from
the produced analysis in table …. It shows that there is very little margin of oversizing between the
created option and the chosen inverter therefore utilising the sized inverter as much as possible for
the sized option. This is illustrated as follows in Figure 18.
Figure 18 - Efficiency Curve for Chosen Inverter Selection (sma.co.uk)
From the produced graph above in Figure 18 this shows that the designed PV array for the selected
inverter works the inverter at the sized peak period at 86% which shows by the curve on the graph that is
almost maximises the inverters requirements which also mimimise wastage of capabilities of the sized
inverter.
Between the two options produced and the corresponding inveter slections to match, it has been decided
that ption 2 is the most ppropiate design for the required application therefore a total of 7 of the same
sized inverters will be required. From the selected design for the PV array the Annual Energy prediction
can be detrmined as follows in the next secton of this report.
Report 5 – Mechanical – Low Carbon and Renewable Technology
18
5.3 Annual Energy Prediction
With using the Photovoltaic system as well as the exisiting boilers to provide the Hot Water supply for the
Swimming Pool Space needs to be justified as there is an immediate loss for the client in acquiring these
two systems to provide on erequirement. However the use of the Photovoltaic System provides a benefit
where the system can pay back the cost of acquiring that system and possibly provide savings to the client
as the system has paid its debts.
This can be determined with the use of the following calculations where the annual mean Irradation value
needs to be determined which is as shown as follows.
The total area of the sized array has to be determined by the use of the following calculation process.
𝑨𝒓𝒓𝒂𝒚 𝑨𝒓𝒆𝒂 = 𝟕𝟕 × (𝟏. 𝟔𝟒 × 𝟎. 𝟗𝟗𝟖) = 𝟏𝟐𝟔. 𝟎𝟑 𝒎 𝟐
From the calculated array value, the installed maximum array power needs to be also oncfmed before
proceeding which has been calculated as follows.
𝑰𝒏𝒔𝒕𝒂𝒍𝒍𝒆𝒅 𝑴𝒂𝒙𝒊𝒎𝒖𝒎 𝑷𝒐𝒘𝒆𝒓 = 𝟐𝟔𝟎 × 𝟕𝟕 = 𝟐𝟎𝟎𝟐𝟎 𝑾(𝟐𝟎. 𝟎𝟐 𝒌𝑾)
CIBSE Guide A Table 2.27 quotes data in 30° increments from 30-90°, due to there being no data for the
roof angle of 33.5° the data has been interpolated to provide more accurate data. Column 4 in Figure 22
provides the data required for the rest of the calculation.
Table 7 - Interpolated data of CIBSE Guide A Table 2.27 to find out irradiation at 33.5°
Tilt Angle Mean Total Irradiation (°)
30 45 33.5
January 987 1071 1006.6
February 1697 1768 1713.56
March 2565 2574 2567.1
April 3950 3887 3935.3
May 4838 4652 4794.6
June 5059 4781 4994.13
July 4997 4758 4941.23
August 4616 4501 4589.16
September 3291 3315 3296.6
October 2343 2480 2374.96
November 1342 1467 1371.16
December 833 925 854.46
Annual Mean 3043 3015 3036.46
From the produced table above for the Tilt angle mean total irradiation value, the annyal solar global
irradiation value can be confirmed by using the following calculation.
𝑰 𝒂𝒏𝒏𝒖𝒂𝒍 (𝑻&𝑶) = 𝑴𝒆𝒂𝒏 𝑨𝒏𝒏𝒖𝒂𝒍 𝑰𝒓𝒓𝒂𝒅𝒊𝒂𝒕𝒊𝒐𝒏 × 𝑫𝒂𝒚𝒔 𝒊𝒏 𝒂 𝒀𝒆𝒂𝒓
Where:
𝐼 𝑎𝑛𝑛𝑢𝑎𝑙 (𝑇&𝑂) 𝑤𝑖𝑙𝑙 𝑏𝑒 𝑐𝑎𝑙𝑐𝑢𝑙𝑎𝑡𝑒𝑑
𝑀𝑒𝑎𝑛 𝐴𝑛𝑛𝑢𝑎𝑙 𝐼𝑟𝑟𝑎𝑑𝑖𝑎𝑡𝑖𝑜𝑛 ℎ𝑎𝑠 𝑏𝑒𝑒𝑛 𝑑𝑒𝑡𝑒𝑟𝑚𝑖𝑛𝑒𝑑 𝑡𝑜 𝑏𝑒 3036.46
𝐷𝑎𝑦𝑠 𝑖𝑛 𝑎 𝑌𝑒𝑎𝑟 𝑖𝑠 𝑡𝑜 𝑏𝑒 362.25 𝑑𝑎𝑦𝑠
Therefore:
𝐼 𝑎𝑛𝑛𝑢𝑎𝑙 (𝑇&𝑂) = 3036.46 × 365.25
𝑰 𝒂𝒏𝒏𝒖𝒂𝒍 (𝑻&𝑶) = 𝟏𝟏𝟎𝟗. 𝟎𝟕 𝒌𝑾𝒉/𝒚𝒓/𝒎 𝟐
Using the calculated total annual solar irridation value we can now determine the uncorrected and
corrected annual array energy output as shown below.
𝑬 𝒂𝒓𝒓𝒂𝒚 𝒖𝒏𝒄𝒐𝒓𝒓𝒆𝒄𝒕𝒆𝒅 = 𝑰 𝒂𝒏𝒏𝒖𝒂𝒍 (𝑻&𝑶) × 𝑴𝒐𝒅𝒖𝒍𝒆 𝑬𝒇𝒇𝒊𝒄𝒊𝒆𝒏𝒄𝒚 × 𝑨𝒓𝒓𝒂𝒚 𝑨𝒓𝒆𝒂
Where:
𝐸 𝑎𝑟𝑟𝑎𝑦 𝑢𝑛𝑐𝑜𝑟𝑟𝑒𝑐𝑡𝑒𝑑 𝑖𝑠 𝑡𝑜 𝑏𝑒 𝑐𝑎𝑙𝑐𝑢𝑙𝑎𝑡𝑒𝑑
𝑀𝑜𝑑𝑢𝑙𝑒 𝐸𝑓𝑓𝑖𝑐𝑖𝑒𝑛𝑐𝑦 𝑖𝑠 𝑡𝑜 𝑏𝑒 97.2%
Report 5 – Mechanical – Low Carbon and Renewable Technology
19
𝐴𝑟𝑟𝑎𝑦 𝐴𝑟𝑒𝑎 𝑖𝑠 𝑡𝑜 𝑏𝑒 126.03 𝑚2
Therefore:
𝐸 𝑎𝑟𝑟𝑎𝑦 𝑢𝑛𝑐𝑜𝑟𝑟𝑒𝑐𝑡𝑒𝑑 = 1109.07 × 0.972 × 126.03
𝑬 𝒂𝒓𝒓𝒂𝒚 𝒖𝒏𝒄𝒐𝒓𝒓𝒆𝒄𝒕𝒆𝒅 = 𝟏𝟑𝟓𝟖𝟔𝟐. 𝟑𝟔𝟐 𝒌𝑾𝒉/𝒚𝒓
From the calculated Uncorrected energy array value the corrected value needs to be calculated by
appliying the Energy array uncorrected constant as shown below.
𝑬 𝒂𝒓𝒓𝒂𝒚 𝒄𝒐𝒓𝒓𝒆𝒄𝒕𝒆𝒅 = 𝑬 𝒂𝒓𝒓𝒂𝒚 𝒖𝒏𝒄𝒐𝒓𝒓𝒆𝒄𝒕𝒆𝒅 × 𝑪𝑭 𝑺𝑴𝑫𝑻
Where:
𝐸 𝑎𝑟𝑟𝑎𝑦 𝑐𝑜𝑟𝑟𝑒𝑐𝑡𝑒𝑑 𝑖𝑠 𝑡𝑜 𝑏𝑒 𝑐𝑎𝑙𝑐𝑢𝑙𝑎𝑡𝑒𝑑
Earray uncorrected has been calculated to be 135862.362 kWh/yr
𝐶𝐹𝑆𝑀𝐷𝑇 𝑖𝑠 𝑖𝑠 𝑡𝑜 𝑏𝑒 0.9
Therefore:
𝐸 𝑎𝑟𝑟𝑎𝑦 𝑐𝑜𝑟𝑟𝑒𝑐𝑡𝑒𝑑 = 135862.362 × 0.9
𝑬 𝒂𝒓𝒓𝒂𝒚 𝒄𝒐𝒓𝒓𝒆𝒄𝒕𝒆𝒅 = 𝟏𝟐𝟐𝟐𝟕𝟔. 𝟏𝟐𝟔 𝒌𝑾𝒉/𝒚𝒓
From the corrected energy array output calculated the annual system energy output can be termeined as
follows.
𝑬 𝒔𝒚𝒔𝒕𝒆𝒎 = 𝑬 𝒂𝒓𝒓𝒂𝒚 𝒄𝒐𝒓𝒓𝒆𝒄𝒕𝒆𝒅 × 𝑪𝑭 𝑩𝑶𝑺
Where:
𝐸𝑠𝑦𝑠𝑡𝑒𝑚 𝑖𝑠 𝑡𝑜 𝑏𝑒 𝑐𝑎𝑙𝑐𝑢𝑙𝑎𝑡𝑒𝑑
𝐸 𝑎𝑟𝑟𝑎𝑦 𝑐𝑜𝑟𝑟𝑒𝑐𝑡𝑒𝑑 ℎ𝑎𝑠 𝑏𝑒𝑒𝑛 𝑐𝑎𝑙𝑐𝑢𝑙𝑎𝑡𝑒𝑑 𝑡𝑜 𝑏𝑒 122276.126 𝑘𝑊ℎ/𝑦𝑟
𝐶𝐹𝐵𝑂𝑆 𝑖𝑠 𝑡𝑜 𝑏𝑒 0.85
Therefore:
𝐸𝑠𝑦𝑠𝑡𝑒𝑚 = 122276.126 × 0.85
𝑬 𝒔𝒚𝒔𝒕𝒆𝒎 = 𝟏𝟎𝟑𝟗𝟑𝟒. 𝟕𝟎𝟕 𝒌𝑾𝒉/𝒚𝒓
Finally from the calculated annual system energy value the final yield can be determined as shown below.
𝑭𝒊𝒏𝒂𝒍 𝑨𝒏𝒏𝒖𝒂𝒍 𝒀𝒊𝒆𝒍𝒅 (𝒀 𝒇) =
𝑨𝒏𝒏𝒖𝒂𝒍 𝑬𝒏𝒆𝒓𝒈𝒚 𝑶𝒖𝒑𝒖𝒕 (𝒌𝑾𝒉)
𝑰𝒏𝒔𝒕𝒂𝒍𝒍𝒆𝒅 𝑴𝒂𝒙𝒊𝒎𝒖𝒎 𝑷𝒐𝒘𝒆𝒓 (𝒌𝑾𝒑)
Where:
𝐹𝑖𝑛𝑎𝑙 𝐴𝑛𝑛𝑢𝑎𝑙 𝑌𝑖𝑒𝑙𝑑 (𝑌𝑓) 𝑖𝑠 𝑡𝑜 𝑏𝑒 𝑐𝑎𝑙𝑐𝑢𝑙𝑎𝑡𝑒𝑑
𝐴𝑛𝑛𝑢𝑎𝑙 𝐸𝑛𝑒𝑟𝑔𝑦 𝑂𝑢𝑝𝑢𝑡 (𝑘𝑊ℎ) ℎ𝑎𝑠 𝑏𝑒𝑒𝑛 𝑐𝑎𝑙𝑐𝑢𝑙𝑎𝑡𝑒𝑑 𝑡𝑜 𝑏𝑒 103934.707
𝐼𝑛𝑠𝑡𝑎𝑙𝑙𝑒𝑑 𝑀𝑎𝑥𝑖𝑚𝑢𝑚 𝑃𝑜𝑤𝑒𝑟 (𝑘𝑊𝑝) ℎ𝑎𝑠 𝑏𝑒𝑒𝑛 𝑎𝑞𝑢𝑖𝑟𝑒𝑑 𝑓𝑟𝑜𝑚 𝑆𝑜𝑢𝑡ℎ𝑒𝑟𝑛 𝐶𝑜𝑢𝑛𝑐𝑖𝑙 𝑡𝑜 𝑏𝑒 2.46
Therefore:
𝐹𝑖𝑛𝑎𝑙 𝐴𝑛𝑛𝑢𝑎𝑙 𝑌𝑖𝑒𝑙𝑑 (𝑌𝑓) =
103934.707
2.46
𝑭𝒊𝒏𝒂𝒍 𝑨𝒏𝒏𝒖𝒂𝒍 𝒀𝒊𝒆𝒍𝒅 (𝒀 𝒇) = 𝟒𝟐𝟐𝟒𝟗. 𝟖𝟖 𝒌𝑾𝒉 𝒌𝑾𝒑⁄ 𝒑𝒆𝒓 𝒚𝒆𝒂𝒓
From the finalised calculated final annual yield value, the PV Design for the swimming pool application has
been designed.
Report 5 – Mechanical – Low Carbon and Renewable Technology
20
6. WIND TURBINE DESIGN APPRAISAL
The wind turbines design appraisal will follow a selection process with regards to the following sizing
process of the wind turbines that will be required for the swimming pool space requirements.
The design of the wind turbine is unique in the
way it is a renewable enrgy source. The way
the wind turbine aquires its energy requirement
is by utilising its blades which will be made in
the form of an aerofoil as found on an aircraft
for its wing. Lift will be generated as air passes
over the blade although instead of lifting an
aircraft off the ground as it is commonly used
in practice. In th wind turbine technology the
blades will rotate the shaft which will generate
the power needed for its purpose.
The aerofoil used in the wind turbine
technology will use a pressure differene created
between the top and bottom of the aerofoil.
Therefore the low pressure air experienced at
the top of the aerofoil tries to suck the aerofoil
and the air under it upwards hence the air
under it upwards therefore the air beneath the
aerofoil is trying to push th aerofoil upwards to
reach the low pressure. The reaction
experienced here is what is expereicned in
practice with aircrafts when lift is generated.
The wind turbine system will incorporate a
horizontal rotor shaft as it is the most common
in practice and range in size from a few hundred Watts to several Megawatts. The turbine system will
include the following main parts to make each turbine as follows.
 A rotor which will consist of 3 blades that will be converting the winds energy into rotational shaft
energy
 A tower to support the rotor and drive train
 A Nacelle containing a drive train which will include a gearbox to minimise stress on the rotor when
running at high speeds
 Electronic equipment such as controls, electrical cables, inter connection equipment and ground
support equipment.
An illustrated diagram is shown in figure … which shows how the wind turbine will work to generate the
electricity as shown below.
The wind turbine equipment will be provided by the manufactuer from which the wind turbine will be sized
from. The wind turbine will be utilising a battery system where the wind turbine will be charging a battery
bank via a control unit. A controller will be required to ensure that the batteries are not over or under
charged and can direct electrical power to another load which will be towards the solar thermal water
heating system only when the batteries are fully charged.
Due to the possibility of oversizing the batteries and invenvitable disadvantage with regards to cost, a
careful analysis of the ideal amount of batteries to be sized will follow in this wind turbine appraisal. The
benefits of carefully selecting the appropriate battery size for the wind turbine design is as follows.
Figure 20 - Indicative Wind Turbine to be used in Hotel
Project for Swimming Pool Electrical requirements Figure 19 – An illustrated diagram of a wind turbine to show how the electricity will be generated
Inflow of Wind
Inflow of Wind
activates Rotar
and Blades
Rotor and
Blades spin
the main
shaft and
gearbox
which
spins the
generator
resulting in
electrical
output
Report 5 – Mechanical – Low Carbon and Renewable Technology
21
 Batteries life span will increase due to consistently using them
 Cost savings due to careful design and selection of batteries appropriate to wind turbine capabilities
of generating electricity.
The wind turbines will be free standing on the free space surrounding the hotel building in the site
indicated in Figure 4, the wind turbine will be best suited in this location due to the minimal interference
of surrounding obstructions of other buoldings or objects to prevent the wind flow to the turbines. The site
also can withstand environmental conditions such as small living organisms from underground and acidic
rainfall the surface has to be waterproof, armoured, and UV Stable. The wind turbine will be supported
using a tower whihch will improve the general performance of the turbine due to the height has been
increased. Ideally the wind turbine should be located on site at a minimum height of 9 meters above any
obstruction and likewise horizontally at a distance of 100 meters. The wind turbine will be design to a
maximum experienced wind speed however if there is an ocurance of an abnormal increase in peak wind
speed the turbine will be designed to turn off to prevent damage to the rotars but re-start operation as
usual when the wind speed is well within the capabilities of the sized turbine.
The structure of the turbine will be designed with consideration of the following.
 Prevention of unauthorised access or climbing up the turbines will be designed.
 The turbine should be able to be capable of being pivoted and lowered to the ground for
maintenance issues.
 All parts of the turbine should be corrosion proof due to the sea water evaporating into the air as
well as the acidic rainwater.
 The structure of the turbine should prevent adverse effects caused by vibration from the rotar.
A diagram as shown in Figure 21 illustrates the indicative design layout of the Wind turbine design to the
swimming pools electrical requirements as well as the possible supply to the water heating requiremnts of
the swimming pool.
To complete the wind turbie design, initially the sizing of the wind turbne must be determined. To do this
the electrical requirement of the swimming pool space must be analysed which has been stated below.
 Peak Electrical Swimming Pool Requirements - 9160 Watts
The wind turbine will be designed to the Swimming Pools peak electrical requirements as it will be required
to be able to handle the peak demands generated for that period of time. However it should be noted that
the wind turbine may not always be able to generate the required amount of electricity for the Swimming
pool space cosnstently due to the possible periods during the year where there is a lack of wind energy
experienced.
Therefore the existing electrical generator will remain sized to produce the required peak electrical demand
as it can modulate depending on the load needed to satisfy from the sawimming pool space as well as the
electrical supply from the Widn Turbine generated. The wind turbine and the electrical generator will take
on a shared load of the peak requirement as discussed previously within this section.
 Wind Turbine Share of Peak Electrical Demand to be 60%
 Electrical Generator Share of Peak Electricaal Demand to be 40%
The wind turbine will therefore be designed to the shared peak load as shown above. Firstly it should be
determined the amout of Wind energy that will be experienced dueing the year which is shown as follows
in the next secton of this report.
DC – AC
Inverter
Bi-Directional
Utility Meter
Meter
Battery
Supply to
Swimming
Pool Electrical
Requirements
Supply to
Swimming Pool
Hot Water Heating
Requirements
Figure 21 - Indicative diagram illatrating how the wind turbine system will generate electricity for the
swimming pool space
Report 5 – Mechanical – Low Carbon and Renewable Technology
22
6.1 Linear Wind Velocity Calculation
This section of the report will determine the range of which the wind energy experienced annualy will be
by using the following calculation processes. By producing a graph at the end of the calculayion process
will provide an indicative idea at how much the wind turbine technology will be able to satisfy the shared
peak electrical load required to produce for the Swimming Pool Space.
From the wind analysis using IES VE software, it was confirmed from the wind diagram that the area
where the wind speed will be averaged at its highest annually is shown in Figure 22 as South to South
West Region. The mean linear velocity has been determined as stated below by using IES VE Wind
Analysis.
 Mean Linear Velocity – 15.49 m/s at 40m
Using the acquired mean linear velocity as stated above it can now be predict the Wind regime at the
locaton at the hub height of 40m by using Rayleighs Probability Density function calculaton as shown
below.
𝒇(𝒖) =
𝝅 × 𝒖
𝟐 × 𝒖 𝒎𝟏 𝟐
× 𝐞𝐱𝐩× (−𝟎. 𝟐𝟓 × 𝝅 × (
𝒖
𝒖 𝒎𝟏
) 𝟐
)
Where:
𝒇(𝒖) 𝒊𝒔 𝒕𝒉𝒆 𝑹𝒂𝒚𝒍𝒆𝒊𝒈𝒉 𝑷𝒓𝒐𝒃𝒂𝒃𝒊𝒍𝒊𝒕𝒚 𝑫𝒆𝒏𝒔𝒊𝒕𝒚 𝒇𝒖𝒏𝒄𝒕𝒊𝒐𝒏 𝒕𝒐 𝒃𝒆 𝒄𝒂𝒍𝒄𝒖𝒍𝒂𝒕𝒆𝒅
𝒖 𝒊𝒔 𝒕𝒉𝒆 𝒗𝒂𝒓𝒊𝒂𝒃𝒍𝒆 𝒘𝒊𝒏𝒅 𝒗𝒆𝒍𝒐𝒄𝒊𝒕𝒚 𝒗𝒂𝒍𝒖𝒆 𝒓𝒂𝒏𝒈𝒊𝒏𝒈 𝒇𝒓𝒐𝒎 𝟎 𝒎/𝒔 𝒕𝒐 𝟑𝟎 𝒎/𝒔
𝒖 𝒎𝟏 𝟐 𝒊𝒔 𝒕𝒉𝒆 𝒈𝒊𝒗𝒆𝒏 𝒍𝒊𝒏𝒆𝒂𝒓 𝒎𝒆𝒂𝒏 𝒗𝒆𝒍𝒐𝒄𝒊𝒕𝒚 𝒗𝒂𝒍𝒖𝒆 𝒐𝒇 𝟏𝟓. 𝟒𝟗 𝒎/𝒔
Therefore using the equation above the table below summaries the values acquired.
Table 8 - Probability of Wind Speed occurance using Rayleigh Probability Calculation
Wind Velocity (m/s) Probability f(u)
0 0.0000
2 0.0131
4 0.0252
6 0.0353
8 0.0429
10 0.0476
12 0.0494
14 0.0485
16 0.0454
18 0.0408
20 0.0352
22 0.0293
24 0.0236
26 0.0183
28 0.0138
30 0.0101
From the produced results from the table above, the grap illustrates the Rayleigh Distribtuin Density
function across the range of wind velocities as calculated.
Figure 22 - Incoming Wind Direction on Site of Hotel Project
Report 5 – Mechanical – Low Carbon and Renewable Technology
23
Figure 23 - Graph showing probability of achieving Wind Speed in proposed site
From the produced graph as shown above it can be seem that the range of velcoities calculated for the
Wind turbine design vary as the wind velocity ranges from 0 m/s to 30 m/s and the probability of acquiring
those velocities. As shown the range has a strong chance of aquring wind energy from a wide range of
wind velocities from the mean velocity acquired from IES VE Software.
6.2 Power Output calculation
Furthermore the Power output that can be obtained by the Wind energy across these veolicity ranges are
as follows. Although to continue the determination of the Power output thaw oud be experienced across
the range velocities as outlined, a Wind Turbine system needs to be selected. Therefore as shown below is
the Wind Turbine system that has been selected for the Swimming pools requirments as showm below.
The wind turbine specification is shown below as follows.
Manufactuer – Ghrepower
Model – FD21 – 100/12
Rotor Diameter – 21 meters
Nuumber of Blades – 3
Working Wind Speed – 3 to 25 m/s
Cut in Wind Spped – 3 m/s
Rated Wind Speed – 12 m/s
Survival Wind Speed – 50 m/s
Rated Output Power – 100 kW
Maximum Output Power – 118 kW
Tower – 36 meters
From the selected Wind Turbine as shown above the estimated Power output across the working wind
speed as indicated by the Wind Turbine manufactuer data can be be then used to predicit the Power
output. This can be achieved by utilising the following equation as follows.
𝑃𝑜𝑤𝑒𝑟𝑜𝑢𝑡𝑝𝑢𝑡 = 𝑃𝑜𝑤𝑒𝑟𝑛𝑜𝑚𝑖𝑛𝑎𝑙 × (
𝑢2
− 𝑢 𝑐𝑖
2
𝑢 𝑛𝑜𝑚𝑖𝑛𝑎𝑙
2
− 𝑢 𝑐𝑖
2 )
Where:
𝑃𝑜𝑤𝑒𝑟𝑜𝑢𝑡𝑝𝑢𝑡 𝑖𝑠 𝑡𝑜 𝑏𝑒 𝑐𝑎𝑙𝑐𝑢𝑙𝑎𝑡𝑒𝑑 𝑑𝑒𝑝𝑒𝑛𝑑𝑖𝑛𝑔 𝑜𝑛 𝑡ℎ𝑒 𝑣𝑎𝑟𝑖𝑜𝑢𝑠 𝑤𝑖𝑛𝑑 𝑠𝑝𝑒𝑒𝑑𝑠
𝑃𝑜𝑤𝑒𝑟𝑛𝑜𝑚𝑖𝑛𝑎𝑙 ℎ𝑎𝑠 𝑏𝑒𝑒𝑛 𝑝𝑟𝑜𝑣𝑖𝑑𝑒𝑑 𝑏𝑦 𝑡ℎ𝑒 𝑚𝑎𝑛𝑢𝑓𝑎𝑐𝑡𝑢𝑒𝑟𝑠 𝑑𝑎𝑡𝑎 𝑡𝑜 𝑏𝑒 100 𝑘𝑊
𝑢 𝑖𝑠 𝑡ℎ𝑒 𝑟𝑎𝑛𝑔𝑒 𝑜𝑓 𝑤𝑖𝑛𝑑 𝑠𝑝𝑒𝑒𝑑𝑠 𝑐𝑎𝑝𝑎𝑏𝑙𝑒 𝑏𝑦 𝑡ℎ𝑒 𝑊𝑖𝑛𝑑 𝑡𝑢𝑟𝑏𝑖𝑛𝑒 𝑓𝑜𝑟 𝑡ℎ𝑒 𝑃𝑜𝑤𝑒𝑟 𝑜𝑢𝑡𝑝𝑢𝑡 𝑡𝑜 𝑏𝑒 𝑏𝑎𝑠𝑒𝑑 𝑜𝑛
0.0000
0.0100
0.0200
0.0300
0.0400
0.0500
0.0600
0 2 4 6 8 10 12 14 16 18 20 22 24 26 28 30
Probability(f(u))
Wind Speed (m/s)
Probabilit
y f(u)
Figure 24 - Indicative representation of Wind Turbine
Technology used in Hotel
Report 5 – Mechanical – Low Carbon and Renewable Technology
24
𝑢 𝑐𝑖 ℎ𝑎𝑠 𝑏𝑒𝑒𝑛 𝑝𝑟𝑜𝑣𝑖𝑑𝑒𝑑 𝑏𝑦 𝑡ℎ𝑒 𝑚𝑎𝑛𝑢𝑓𝑎𝑐𝑡𝑢𝑒𝑟𝑠 𝑑𝑎𝑡𝑎 𝑡𝑜 𝑏𝑒 3 𝑚/𝑠
𝑢 𝑛𝑜𝑚𝑖𝑛𝑎𝑙 ℎ𝑎𝑠 𝑏𝑒𝑒𝑛 𝑝𝑟𝑜𝑣𝑖𝑑𝑒𝑑 𝑏𝑦 𝑡ℎ𝑒 𝑚𝑎𝑛𝑢𝑓𝑎𝑐𝑡𝑢𝑒𝑟𝑠 𝑑𝑎𝑡𝑎 𝑡𝑜 𝑏𝑒 12 𝑚/𝑠
𝑢 𝑐𝑜 ℎ𝑎𝑠 𝑏𝑒𝑒𝑛 𝑝𝑟𝑜𝑣𝑖𝑑𝑒𝑑 𝑏𝑦 𝑡ℎ𝑒 𝑚𝑎𝑛𝑢𝑓𝑎𝑐𝑡𝑢𝑒𝑟𝑠 𝑑𝑎𝑡𝑎 𝑡𝑜 𝑏𝑒 25 𝑚/𝑠
Therefore from the provided initial data the following table can be produced to estimate the Power output
experienced through the range of the wind speeds that the wind turbine sized is capable of as follows.
Table 9 - Calculated Power Output dependant on Wind Speed
Wind Speed (m/s) Power Output (kW)
0 -6.67
2 -3.70
4 5.19
6 20.00
8 40.74
10 67.41
12 100.00
14 138.52
16 182.96
18 233.33
20 289.63
22 351.85
24 420.00
26 494.07
28 574.07
30 660.00
From the produced table above the power outputs from the range of wind speeds capable from the sized
Wind turbine have been analysed and produced certain assumptions which can be made which are aso
follows.
Firstly the output experieed at wind speeds below 3 m/s show a negative figure due to the limitation of
wind speed being 3 m/s where at any wind speeds less than that of 3 m/s the wind turines motor will stop
generating power and apply its mechanical brakes to the spinning blades to come to a stand still.
Secondly utilising the locations means linear wind speed of 15.49 m/s the power output produced by the
Wind Turbine at those speeds are proven to be a reasonable amount however it must be noted that the
mean linear wind speed experienced in the proposed location for the project is not the peak wind speed.
To create the third assumption made from the results obtained from Table 9 a graph has to be created to
illustrate the relation with regards to the Wind Speed and the Power output with another graph line
showing the relation with Wind Speed and the probability of acquiring those wind speeds as shown below.
Figure 25 - Graph comparing Probability of Wind Speed and corresponding Power Output
0.00
100.00
200.00
300.00
400.00
500.00
600.00
700.00
0.0000
0.0100
0.0200
0.0300
0.0400
0.0500
0.0600
0 2 4 6 8 10 12 14 16 18 20 22 24 26 28 30
PowerOutput(kW)
Probability(f(u))
Wind Speed (m/s)
Probab
ility
f(u)
Power
Output
(kW)
Report 5 – Mechanical – Low Carbon and Renewable Technology
25
The produced graph above illustrates the power output produced across the range of wind speeds capable
of the win turbine as well as looking into the probability of those wind speeds being achieved whilst be
located in the proposed location for the project. The assumption can be made that the probability peak is
around the regions where the wind turbine’s output is at its rated output rate of a 100 kW. It can also be
assumed that based on the produced results with regards to the probability of wind speed experienced at
the location will favour the power output of the wind turbine up to the stated range of the wind turbine by
where if the wind speed goes past 25 m/s the mechanica brakes will be applied to the spinning rotor
blades and no more electricity will be generated for protection of the equipment of the Wind Turbine
system due to high wind speeds.
6.3 Total Energy Output Calculation
Following the determination of how the power output will depend on the amount of wind speed produced in
the porposed location and how often. the average ppower produced at a particular wind speed over a
period of time will need to be calculated. The calculation process for aquring this value is demonstatred as
shown below.
𝐴𝑣𝑟𝑎𝑔𝑒 𝑃𝑜𝑤𝑒𝑟 𝑂𝑢𝑡𝑝𝑢𝑡 @ 𝑢 = 𝑃𝑜𝑤𝑒𝑟 𝑂𝑢𝑡𝑝𝑢𝑡 @ 𝑢 × 𝑃𝑟𝑜𝑏𝑎𝑏𝑖𝑙𝑖𝑡𝑦 𝑓(𝑢)
As shown above the calculation process for determing the average power output for a particular wind
speed has been given. The same calculation process is required to determine the Average Energy
requirement where the calculation process for acquiring this value is shown as follows below.
𝐴𝑣𝑟𝑎𝑔𝑒 𝐸𝑛𝑒𝑟𝑔𝑦 @ 𝑢 = 𝐴𝑣𝑒𝑟𝑎𝑔𝑒 𝑃𝑜𝑤𝑒𝑟 𝑂𝑢𝑡𝑝𝑢𝑡 @ 𝑢 × 8760 ℎ𝑜𝑢𝑟𝑠
Therefore applying both equations to the originally acquired values calculated previously the table below
summaries the new calculated values for the average power output and delivered energy output for a
particular wind speed as shown below.
Table 10 - Calculation of Total Energy Delivered for Wind Turbine Technology
Wind Speed (m/s) Power Output (kW) Probability f(u)
Average Power
Output (P ×
f(u))
Delivered
Energy (kWh)
0 -6.67 0.0000 0.000 0.00
2 -3.70 0.0131 0.000 0.00
4 5.19 0.0252 0.130 1142.83
6 20.00 0.0353 0.706 6187.76
8 40.74 0.0429 1.748 15315.91
10 67.41 0.0476 3.209 28111.28
12 100.00 0.0494 4.937 43249.49
14 138.52 0.0485 6.715 58822.02
16 182.96 0.0454 8.307 72772.81
18 233.33 0.0408 9.512 83328.74
20 289.63 0.0352 10.197 89321.42
22 351.85 0.0293 10.313 90339.96
24 420.00 0.0236 9.898 86706.21
26 494.07 0.0183 9.054 79309.46
28 574.07 0.0138 7.918 69363.83
30 660.00 0.0101 6.639 58156.38
89.284 782128.09
From the produced table as shown above two assumptions can be made which are as follows.
 Average Power – 89.284 kW
 Total Energy – 782128.09 kWh
Using the acquired values produced as stated above compared to the required power load for the
swimming pool space’s electrical requirements it shows that the wind turbine technology is over sized for
the swimming pool electrical requirmeents. Therefore the generated power will seem to be just stored
within the off grid battery systems until required. However the Wind turbine will be designed to be able to
produce the required electrtical requirements for he swimming pool space as well as supplying the top up
requirement for the immersion heater to supply the hot water for the swimming pool space.
The supply requirmeents for the Immersion heater will be done by diverging the supply to the battery with
the aid of a Bi-directional Utility meter which will control the amount of electrical supply being supplied into
the Immersion heater.
Report 5 – Mechanical – Low Carbon and Renewable Technology
26
6.4 Off Grid Battery Sizing
Now that the final inverters have been confirmed for both selections the corresponding battery sizing will
need to be conducted. The stored AC Curent within the Battery will be utlisied by the Swimming Pools
requirements. However if the Swimming Pools requirmeents are not required in such condition as the
occupation hours have past and there is still AC Current being stored by the ongoing Solar Gain collection
by the PV Panels. Then that AC Currrent will be stored by the batteries for later use as of when the
Swimming Pools requirements are needed.
The swimming pools requirements in particular is to feed the heating requirements for the pool space via
an immersion heater which will be sized later on in this report. Therefore the batteries will be providing the
required AC Current to the immersion heaters alongside the Boilers which will be working as top up to
maintain peak periods where the PV Design will not be sufficient in providing the required heating for the
pools heating requirements. To size the required battery, the inverter rated power will be used to size
this. Using manufactuers data this can be determined to size the appropriate Battery storage system.
The battery sized is based on a diversity factor of the required inverter rated power as it is important to
undersize the required batter size. This is to not size the battery at the PV Panel design’s peak load as it
has been confirmed from the IES VE Solar Path Analysis that the solar gain experienced will not be at peak
levels during the day and more importantly every day. Therefore by underszing the battery this enables
the battery to fully utlise its capacity of storing the AC Current. This will benefit the battery cells as it will
prevent the battey from reducing its life expectancy due to not fully utilising the battery cells.
Figure 26 shows an indicative battery that will be used in the PV Panel design. This battery system is
known as an Off Grid System as the AC Current generated is not being directly supplied into the Swimming
Pools requirements and supply back into the National Grid. However is being stored in the Off Grid Battery
system to be used by the Swimming Pool Space when required.
Figure 26 - Example of Off Grid Battery Bank System to be used in Project (fusionenergy.co.uk)
It should be noted that the renewable tehnology included in the design for the Swimming pool space will
be Photovltaic and Wind Turbine technology where wind turbine technology produced AC Current so
therefore will need to be converted into DC current before hand and stored. For when the DC Current
stored equired it will be converted back into AC Current to supply into the swimming pools requirements.
This therefore produces many issues with regards to the effcency of the conversion of the DC to AC to DC
current changes as the power requirements are generated. Thererore an alternative solution will also be
analysed as follows to resolve this efficiency matter with regards to supplying the swimming pools
electrical requirementrs.
Report 5 – Mechanical – Low Carbon and Renewable Technology
27
7. RENEWABLE TECHNOLGY APPLICABILITY
The purpose of this report was to analyse two different renewable systems applicability to the Swimming
Pool Space. This was acquired by firstly utilising a Photovoltaic System to supply the Pool space with the
Hot Water by supplying the Immersion heater which generates the hot water with the generated AC
Current from the collected Solar Gain as well as the top up requirement from the Top up boilers to supply
the hot water for the pool space.
The second renewable system is the Wind Turbine system which has been designed to produce the
electricity requirments for the Swimming Pool Space. This is done by generating the DC Current by the
motion of the rotars on the turbine which is then converted into AC Current by the inverters then stored
into the Off Grid Batteries. At the batteries a supply feed of AC Current will provide the requirements of
the Swimming pools electrical requirmeents. Th eexisting electrical generator supplying the electrical
requirmeents of the swimming pool space will remain as it will act as a top up system for when the wind
turbine system does not provide sufficient electrical output for the requiremnts of the swimming pool
space.
The benfits of using these systems is to minimise the use of the Boilers and the electrical generator system
in providing the swimming pool space’s energy requirements and to utlise renewable technology as much
as possible as an alternative. Instead of using fossil fuel based systems and by using renewable
technologies to supply the requiremnts of the space results in a much more greener building.
The existing boiler and electrical generator will remain the same size as sized previously. This is because
the aim of sizing the renewable technologies was to run the existing traditional systesm on part load so as
to not provide as much carbon emissions as before. Therefore with the renewable tecologies sized this
provides a carbon saving by monimising the use of the boiler and electrical generator when supplying the
requirements for the Swimming Pool space.
Both the Photoovltaic Panel system and Wind Turbine system have been appraised through the analysis of
both technologies within this report has proven that point. The two systems are able to work alongside
each other in supplying the Swimming Pool requirement of Hot water supply and Electrical requirmeents.
In order to achieve a robust and greater efficiency in the systems as well as the maintenance and overall
costs of the whoe systemapplied. Some of the equipment used in both design can be combined into one
system. A representation of this is the use of an Energy Storage equipment.
To size the required energy storage system the calculated wind turbine and Photovoltaic Panel system
output must be confirmed as calculated within this report. The final output values have been summarised
as shown below.
 Photovoltaic Panel System = 11.865 kW
 Wind Turbine System – 89.284 kW
 Total Energy Storage Requiremnt – 101.149 kW
From the produced summary of requirments for the renewable tehnoligies the following Energy Storage
equipment has been specified as shown below.
Figure 27 - Example of Energy Storage equipment to be used for Hotel Project (energystoragesystem.co.uk)
The sized energy storage system is based on the total energy storage system requirement from both
renewable techlogies. The selected Energy Storage system will be responsible for converting the DC
Current generated by the renewable technologies and storing the AC Current until required for use by the
Swimming Pools Hot water and electrical requirements. Combining the two inverters and off grid battiery
systems into one whole system beenfits the design of the overall system as it reduces the overall system
error as one system passes through the next till it reaches the supply source.
On the following two pages are illustrated diagrams showing how the Photoovltaic Panels and the Wind
Turbine System working along side the existing sized Boiler and Electrical generator with the original
inverter, off grid and meter strategy layout as well as the improved final strategy with the Energy Storage
System being responsible on the conversion from DC to AC current and storage of AC Current till required
for Swimming Pool Space requirements as follows.
Report 5 – Mechanical – Low Carbon and Renewable Technology
28
Top up Boiler
Supply to
Swimming
Pool Electrical
Requirements
Supply to
Swimming Pool
Hot Water Heating
Requirements
Electrical Generator
DC – AC
Inverter
Battery
Meter
DC – AC
Inverter
Battery
Meter
Immersion
Heater
Bi-Directional
Utility Meter
Report 5 – Mechanical – Low Carbon and Renewable Technology
29
Top up Boiler
Supply to
Swimming
Pool Electrical
Requirements
Supply to
Swimming Pool
Hot Water Heating
Requirements
Electrical Generator
Energy Storage System
Immersion
Heater
Report 5 – Mechanical – Low Carbon and Renewable Technology
30
From the finalised schematics produced, this shows the renewable technologies working together in
producing the requirements of the Swimming pool as stated earlier in this report. Furthermore the sized
equipment will need analysis to produce an assumption as to whether the sized equipment will provide any
excess amounts of power at any given point during the year as sized above. Therefore the following table
outlines the final produced output annually and the requirements of the swimming pool design.
Table 11 - Swimming Pool Electrical Requirements
Swimming Pool Requirmeents Electrical Load (kW)
Hot Water Requireents 38.700
Electrical Requirements 9.160
From the produced requirements in Table 11 the table below outlines the produced electrical load by the
renewable technologies as follows
Table 12 - Renewable Technologies Electrical Output
Renewable Technology Electrical Load (kW)
Photovoltaic Panel Design 11.865
Wind Turbine Design 89.284
From the two produced tables as shown above this shows that the total renewable technologies electrical
load produced satisfies the electrical requirements of the swimming pool design although wit the sized
battery system to go with the appraised renewable technology system the electrical load produced by the
renewable technology will not be wasted as such it will be stored for when it is required by the swimming
pools requirements.
Figure 28 - Energy prices within the United Kingdom based on UKPower.com
Report 5 – Mechanical – Low Carbon and Renewable Technology
31
7.1 Redesign of Renewable Technologies
Furthermore when reffering to the research carried out from the analysis of the selected literature articles
to review, the point came across that electricity is much of a carbon emitting energy source than that of
gas. This point has been proven from the produced price list of known energy sources within the United
Kingdom for 1 kWh of energy as shown in Figure 28 furthermore it seems unnecessary to offset the gas
requirements in the building however more so beneficial to offset the buildings electrical requirements as
electricity is the most expensive energy requirement of the building.
This point can be proven further by the produced graph in Figure 29 where it shows the annual and
estimated world population and energy demand. Analysing this graph shows that the wolds electricity
demand is forever increasing. Therefore the use of renewable technologies such as what has been
designed for this project is highly beneficial for not just the projects renewable energy source but also
providing a sustainable solution to the global energy crisis.
Figure 29 - Annual and estimated world population and energy demand (A.M.Omer 2007)
Therefore the final decision has been made to utlise the renewable energy technolgigies sized for this
project to offset the electrical requirements of the whole project and not just the swimming pool space.
Table 13 provides the total electrical requirements of the building and the total energy output produced by
the renewable technologies with the final oversizing or undersizing of energy provision as shown below.
Table 13 - Calculation of Renewable Technology Oversize
Total Building Electrical Requirement (kW) 787.356
Total Renewable Energy Technology Electrical
Output (kW)
101.149
Percentage Oversize (%) -87.15
7.2 Payback Period Calculation
Following the produced table above, the assumption can be made that the renewable technogy sized will
not be able to offset the total electrical load of the building however will be able to offset 12.85 % Of the
electrical requirements. The following calculation process will provide an indicative payback period for
applying the Photovoltaic System and Wind Turbine Technology into the Project as follows.
 Phtovoltaic System Cost – £ 150,000
 Wind Turbine System Cost – £ 255,000
 Renewable Technology Equipment Cost - £ 25,750
 Total Installation Cost - £ 430,750
Therefore from the provided initial installation costs as acquired from the renewable technoigies respected
manufactueres the following calculation process can determine the overall payback period as follows.
Firstly the annual power displaced can be determined as follows.
𝑨𝒏𝒏𝒖𝒂𝒍 𝑪𝒐𝒔𝒕 𝒐𝒇 𝑷𝒐𝒘𝒆𝒓 𝑫𝒊𝒔𝒑𝒍𝒂𝒄𝒆𝒅 = 𝑨𝒏𝒏𝒖𝒂𝒍 𝑬𝒏𝒆𝒓𝒈𝒚 𝑪𝒓𝒆𝒂𝒕𝒆𝒅 × 𝑬𝒍𝒆𝒄𝒕𝒓𝒊𝒄𝒊𝒕𝒚 𝒄𝒐𝒔𝒕
Where:
𝐴𝑛𝑛𝑢𝑎𝑙 𝐶𝑜𝑠𝑡 𝑜𝑓 𝑃𝑜𝑤𝑒𝑟 𝐷𝑖𝑠𝑝𝑙𝑎𝑐𝑒𝑑 𝑖𝑠 𝑡𝑜 𝑏𝑒 𝑐𝑎𝑙𝑐𝑢𝑙𝑎𝑡𝑒𝑑
𝐴𝑛𝑛𝑢𝑎𝑙 𝐸𝑛𝑒𝑟𝑔𝑦 𝐶𝑟𝑒𝑎𝑡𝑒𝑑 ℎ𝑎𝑠 𝑏𝑒𝑒𝑛 𝑐𝑎𝑙𝑐𝑢𝑙𝑎𝑡𝑒𝑑 𝑡𝑜 𝑏𝑒 886.065 𝑀𝑊ℎ
𝐸𝑙𝑒𝑐𝑡𝑟𝑖𝑐𝑖𝑡𝑦 𝑐𝑜𝑠𝑡 𝑡𝑜 𝑏𝑒 15.4 𝑝𝑒𝑛𝑐𝑒 𝑝𝑒𝑟 𝑘𝑊ℎ 𝑏𝑎𝑠𝑒𝑑 𝑜𝑛 𝑎𝑞𝑢𝑖𝑟𝑒𝑑 𝑣𝑎𝑙𝑢𝑒 𝑓𝑟𝑜𝑚 𝑈𝐾𝑃𝑜𝑤𝑒𝑟. 𝑐𝑜𝑚
Report 5 – Mechanical – Low Carbon and Renewable Technology
32
Therefore:
𝐴𝑛𝑛𝑢𝑎𝑙 𝐶𝑜𝑠𝑡 𝑜𝑓 𝑃𝑜𝑤𝑒𝑟 𝐷𝑖𝑠𝑝𝑙𝑎𝑐𝑒𝑑 = (886.065 103
) × (15.4 × 10⁻²)
𝑨𝒏𝒏𝒖𝒂𝒍 𝑪𝒐𝒔𝒕 𝒐𝒇 𝑷𝒐𝒘𝒆𝒓 𝑫𝒊𝒔𝒑𝒍𝒂𝒄𝒆𝒅 = £ 𝟏𝟑𝟔, 𝟒𝟓𝟒. 𝟎𝟏
From the produced Annual Cost of Power displaced, the cost of maintenance can be calculated as follows.
𝑨𝒏𝒏𝒖𝒂𝒍 𝑪𝒐𝒔𝒕 𝒐𝒇 𝑴𝒂𝒊𝒏𝒕𝒆𝒏𝒂𝒏𝒄𝒆 = 𝑨𝒏𝒏𝒖𝒂𝒍 𝑬𝒏𝒆𝒓𝒈𝒚 𝑪𝒓𝒆𝒂𝒕𝒆𝒅 × 𝑬𝒍𝒆𝒄𝒕𝒓𝒊𝒄𝒊𝒕𝒚 𝒄𝒐𝒔𝒕
Where:
𝐴𝑛𝑛𝑢𝑎𝑙 𝐶𝑜𝑠𝑡 𝑜𝑓 𝑀𝑎𝑖𝑛𝑡𝑒𝑛𝑎𝑛𝑐𝑒 𝑖𝑠 𝑡𝑜 𝑏𝑒 𝑐𝑎𝑙𝑐𝑢𝑙𝑎𝑡𝑒𝑑
𝐴𝑛𝑛𝑢𝑎𝑙 𝐸𝑛𝑒𝑟𝑔𝑦 𝐶𝑟𝑒𝑎𝑡𝑒𝑑 ℎ𝑎𝑠 𝑏𝑒𝑒𝑛 𝑐𝑎𝑙𝑐𝑢𝑙𝑎𝑡𝑒𝑑 𝑡𝑜 𝑏𝑒 886.065 𝑀𝑊ℎ
𝑀𝑎𝑖𝑛𝑡𝑒𝑛𝑎𝑛𝑐𝑒 𝑐𝑜𝑠𝑡 𝑡𝑜 𝑏𝑒 1 𝑝𝑒𝑛𝑐𝑒 𝑝𝑒𝑟 𝑘𝑊ℎ 𝑏𝑎𝑠𝑒𝑑 𝑜𝑛 𝑎𝑞𝑢𝑖𝑟𝑒𝑑 𝑣𝑎𝑙𝑢𝑒 𝑓𝑟𝑜𝑚 𝑀𝑎𝑛𝑢𝑓𝑎𝑐𝑡𝑢𝑒𝑟𝑠
Therefore:
𝐴𝑛𝑛𝑢𝑎𝑙 𝐶𝑜𝑠𝑡 𝑜𝑓 𝑀𝑎𝑖𝑛𝑡𝑒𝑛𝑎𝑛𝑐𝑒 = (886.065 103
) × (1 × 10⁻²)
𝑨𝒏𝒏𝒖𝒂𝒍 𝑪𝒐𝒔𝒕 𝒐𝒇 𝑴𝒂𝒊𝒏𝒕𝒆𝒏𝒂𝒏𝒄𝒆 = £ 𝟖, 𝟖𝟔𝟎. 𝟔𝟓
From the calculated maintenance cost calculated above, the net annual cost savig can be determined as
follows.
𝑨𝒏𝒏𝒖𝒂𝒍 𝑵𝒆𝒕 𝑺𝒂𝒗𝒊𝒏𝒈 = 𝑨𝒏𝒏𝒖𝒂𝒍 𝑪𝒐𝒔𝒕 𝒐𝒇 𝑷𝒐𝒘𝒆𝒓 𝑫𝒊𝒔𝒑𝒍𝒂𝒄𝒆𝒅 − 𝑨𝒏𝒏𝒖𝒂𝒍 𝑪𝒐𝒔𝒕 𝒐𝒇 𝑴𝒂𝒊𝒏𝒕𝒆𝒏𝒂𝒏𝒄𝒆
Where:
𝐴𝑛𝑛𝑢𝑎𝑙 𝑁𝑒𝑡 𝑆𝑎𝑣𝑖𝑛𝑔 𝑖𝑠 𝑡𝑜 𝑏𝑒 𝑐𝑎𝑙𝑐𝑢𝑙𝑎𝑡𝑒𝑑
𝐴𝑛𝑛𝑢𝑎𝑙 𝐶𝑜𝑠𝑡 𝑜𝑓 𝑃𝑜𝑤𝑒𝑟 𝐷𝑖𝑠𝑝𝑙𝑎𝑐𝑒𝑑 ℎ𝑎𝑠 𝑏𝑒𝑒𝑛 𝑐𝑎𝑙𝑐𝑢𝑙𝑎𝑡𝑒𝑑 𝑡𝑜 𝑏𝑒 £ 136,454.01
𝐴𝑛𝑛𝑢𝑎𝑙 𝐶𝑜𝑠𝑡 𝑜𝑓 𝑀𝑎𝑖𝑛𝑡𝑒𝑛𝑎𝑛𝑐𝑒 ℎ𝑎𝑠 𝑏𝑒𝑒𝑛 𝑐𝑎𝑙𝑐𝑢𝑙𝑎𝑡𝑒𝑑 𝑡𝑜 𝑏𝑒 £ 8,860.65
Therefore:
𝐴𝑛𝑛𝑢𝑎𝑙 𝑁𝑒𝑡 𝑆𝑎𝑣𝑖𝑛𝑔 = 136454.01 − 8860.65
𝑨𝒏𝒏𝒖𝒂𝒍 𝑵𝒆𝒕 𝑺𝒂𝒗𝒊𝒏𝒈 = £ 𝟏𝟐𝟕, 𝟓𝟗𝟑. 𝟑𝟔
From the determined net saving from utilising the renewable systems used in the Hotel project, the fina
payback period can now be determined by using the following calculation process as follows.
𝑷𝒂𝒚𝒃𝒂𝒄𝒌 𝑷𝒆𝒓𝒊𝒐𝒅 =
𝑰𝒏𝒊𝒕𝒊𝒂𝒍 𝑪𝒐𝒔𝒕 𝒐𝒇 𝑹𝒆𝒏𝒆𝒘𝒂𝒃𝒍𝒆 𝑻𝒆𝒄𝒉𝒏𝒐𝒍𝒐𝒈𝒊𝒆𝒔
𝑨𝒏𝒏𝒖𝒂𝒍 𝑵𝒆𝒕 𝑺𝒂𝒗𝒊𝒏𝒈
Where:
𝑃𝑎𝑦𝑏𝑎𝑐𝑘 𝑃𝑒𝑟𝑖𝑜𝑑 𝑖𝑠 𝑡𝑜 𝑏𝑒 𝑐𝑎𝑙𝑐𝑢𝑙𝑎𝑡𝑒𝑑
𝐼𝑛𝑖𝑡𝑖𝑎𝑙 𝐶𝑜𝑠𝑡 𝑜𝑓 𝑅𝑒𝑛𝑒𝑤𝑎𝑏𝑙𝑒 𝑇𝑒𝑐ℎ𝑛𝑜𝑙𝑜𝑔𝑖𝑒𝑠 ℎ𝑎𝑠 𝑏𝑒𝑒𝑛 𝑐𝑎𝑙𝑐𝑢𝑙𝑎𝑡𝑒𝑑 𝑡𝑜 𝑏𝑒 £ 430,750
𝐴𝑛𝑛𝑢𝑎𝑙 𝑁𝑒𝑡 𝑆𝑎𝑣𝑖𝑛𝑔 ℎ𝑎𝑠 𝑏𝑒𝑒𝑛 𝑐𝑎𝑙𝑐𝑢𝑙𝑎𝑡𝑒𝑑 𝑡𝑜 𝑏𝑒 £ 127,593.36
Therefore:
𝑃𝑎𝑦𝑏𝑎𝑐𝑘 𝑃𝑒𝑟𝑖𝑜𝑑 =
430750
127593.36
𝑷𝒂𝒚𝒃𝒂𝒄𝒌 𝑷𝒆𝒓𝒊𝒐𝒅 = 𝟑. 𝟑𝟖 𝒚𝒆𝒂𝒓𝒔
As calculated above to apply the reneable technology to the Hotel building, the initial costs applied will be
paid back to the client within the next 3.5 years which from then on the client will continue to save on the
renewable technology system designed which is a rather large costs effective system being applied.
Therefore to summarise this renewable technology appraisal for the Hotel project the final schematic as
follows provides an iddicative illustration of how the apprased reneewabel technology will feed the Hotel
project’s electrical requirements.
Report 5 – Mechanical – Low Carbon and Renewable Technology
33
Supply to
Swimming
Pool Electrical
Requirements
Electrical Generator
located in Swimming
Pool Plant Room for
Swimming Pool
Energy Storage System
Electrical Generator
located in Electrical Plant
Room for Hotel Supply to
Swimming
Pool Electrical
Requirements
Hotel Consumer
Unit
Swimming Pool
Consumer Unit
Report 5 – Mechanical – Low Carbon and Renewable Technology
34
8. DRAWINGS
8.1 Renewable Technology Hotel Integrated System Schematic (Full Size A1 Drawing Available)
Report 5 – Mechanical – Low Carbon and Renewable Technology
35
9. FURTHER DESIGN CONSIDERATIONS
Following the completion of the Low carbon and renewable technology design appraisal to the Hotel
project, the Photovoltaic and Wind Turbine technology designed to provide the required electrical
requirements to Hotel whilst providing cost savings to the client after a small payback period as calculated
above within this report.
Furthermore, the initial requirements for the renewable technologies were changed due to the
requirements initially designed for does not offset the greatest energy supply cost of the building which
turned out to be Electricity instead of Gas which in comparison is a much cheaper use of fuel with much
less carbon emissions generated as outlined by UKPower.com.
To improve the renewable technology design, more renewable technology will be required to be designed
to completely offset the electrical requirements of the building, which is the biggest fuel supply cost as
previously discussed. This will ultimately improve the buildings carbon ratings and be seen as Hotel
building with a renewable technology system, which can supply its own energy requirements as supply
other applications around.
Report 5 – Mechanical – Low Carbon and Renewable Technology
36
10. BIBLIOGRAPHY
Assiciation, E. N. (2012). Engineering Recomendations G83. Energy Networks Association .
Cibse Guide A. (2006). CIBSE.
Guide to the installation of Photovoltaic Systems. (2012). ECA.
Hyundai Solar Module RG-Series Data Sheet. (2015). Hyundai Solar Module.
Mcglen, S. (2015). Renewable Systems Part 3. Northumbria University.
McGlen, S. (2015). Renewable Systems Part 4. Northumbria University.
McGlen, S. (2015). Renewable Systems Part 5. Northumbria University.
Pennycook, K. (2008). The Illustrated Guide to Renewable Technologies. BSRIA.
SMA. (2015). Sunny Boy 1.5/2.5 Data Sheet. SMA Solutions.
Solution, R. E. (2016). Energy Storage System. Renewable Energy Solution.
Report 5 – Mechanical – Low Carbon and Renewable Technology
37
11. APPENDICES
11.1 Photovoltaic Panel Manufacture Data
Report 5 – Mechanical – Low Carbon and Renewable Technology
38
11.2 Inverter Manufacture Data
Report 5 – Mechanical – Low Carbon and Renewable Technology
39
11.3 Wind Turbine Manufacture Data
Report 5 – Mechanical – Low Carbon and Renewable Technology
40
11.4 Energy Storage System Manufacture Data

Report 5 - Mechanical - Low Carbon and Renewable Technology

  • 1.
    Projects Projects Intended for Northumbria UniversityNewcastle Student no. W12001941 Date 18th May 2016 Word Count 13123 REPORT 5 - MECHANICAL LOW CARBON AND RENEWABLE TECHNOLOGY
  • 2.
    Report 5 –Mechanical – Low Carbon and Renewable Technology CONTENTS 1. Executive Summary 1 2. Introduction 2 3. Literature Review 3 3.1 Analysis of Renewable Technology 3 3.2 Analysis of Photovoltaic Panel 3 3.3 Analysis of Wind Power 3 3.4 Analysis of Combined Technology 4 3.5 Effects on Project 5 4. Location Analysis 6 5. Photovoltaic Design Appraisal 8 5.1 Photovoltaic Panel Comparison 9 5.2 Inverter Selection 14 5.3 Annual Energy Prediction 18 6. Wind Turbine Design Appraisal 20 6.1 Linear Wind Velocity Calculation 22 6.2 Power Output calculation 23 6.3 Total Energy Output Calculation 25 6.4 Off Grid Battery Sizing 26 7. Renewable Technolgy Applicability 27 7.1 Redesign of Renewable Technologies 31 7.2 Payback Period Calculation 31 8. Drawings 34 8.1 Renewable Technology Hotel Integrated System Schemat 34 9. Further Design Considerations 35 10. Bibliography 36 11. Appendices 37 11.1 Photovoltaic Panel Manufacture Data 37 11.2 Inverter Manufacture Data 38 11.3 Wind Turbine Manufacture Data 39 11.4 Energy Storage System Manufacture Data 40
  • 3.
    Report 5 –Mechanical – Low Carbon and Renewable Technology TABLES Table 1 - Summary of Renewable and Low Carbon Technologies selected from Stage 2 Report ......................2 Table 2 - Selection of PV Modules to be used in design calculation comparison ............................................9 Table 3 - PV Panel Option Comparison .................................................................................................. 13 Table 4 - comparison of chosen Array Design and chosen Inverter Suitability ............................................ 14 Table 5 - Comparison of Final two options for PV Panel Array design ........................................................ 16 Table 6 - Inverter Comparison to best suit final selected PV Panel Array Options........................................ 16 Table 7 - Interpolated data of CIBSE Guide A Table 2.27 to find out irradiation at 33.5° ............................. 18 Table 8 - Probability of Wind Speed occurance using Rayleigh Probability Calculation.................................. 22 Table 9 - Calculated Power Output dependant on Wind Speed ................................................................. 24 Table 10 - Calculation of Total Energy Delivered for Wind Turbine Technology ........................................... 25 Table 11 - Swimming Pool Electrical Requirements................................................................................. 30 Table 12 - Renewable Technologies Electrical Output.............................................................................. 30 Table 13 - Calculation of Renewable Technology Oversize ....................................................................... 31
  • 4.
    Report 5 –Mechanical – Low Carbon and Renewable Technology FIGURES Figure 1 - World primary energy supply (H.Lund 2006).............................................................................3 Figure 2 - Flowchart of a typical photovoltaic and wind generation optimization methodology (E.Koutroulis et Al 2005).................................................................................................................................................4 Figure 3 - Stand Alone Wind and PV generating system configuration (M.H.Nehrir et Al 2000).......................5 Figure 4 - World Oil productions in the next 10-20 years (A.M.Omer 2007) .................................................5 Figure 5 - Site Plan of Project Building within City Centre Location .............................................................6 Figure 6 -Available roof space for PV Panel..............................................................................................6 Figure 7 - Available Terrace roof space for PV Panel .................................................................................6 Figure 8 - IES VE Provided Solar Path Analysis ........................................................................................7 Figure 9 - IES VE Produced Wind Diagram...............................................................................................7 Figure 10 - Illustration of how Photovoltaic Panels work............................................................................8 Figure 11 - An Indicative image of the chosen Hyundai Solar Mono Crystaline Type 250 PV Module................9 Figure 12 - Option 1 on the Roof Space with 70 panels linked in one string ............................................... 10 Figure 13 - Option 2 on the Terrace Roof Space with 77 panels linked in one string.................................... 10 Figure 14 - Option 3 on the Terrace Roof Space with 70 panels linked by 2 strings..................................... 11 Figure 15 - Option 4 on the Terrace Roof Space with 77 Panels linked by 11 Strings................................... 11 Figure 16 - Indicative PV Panel array design of 70 Modules with 5 inverters connected ............................... 15 Figure 17 - Indicative PV Panel array design of 77 Modules with 7 inverters connected ............................... 15 Figure 18 - Efficiency Curve for Chosen Inverter Selection (sma.co.uk)..................................................... 17 Figure 19 – An illustrated diagram of a wind turbine to show how the electricity will be generated ............... 20 Figure 20 - Indicative Wind Turbine to be used in Hotel Project for Swimming Pool Electrical requirements ... 20 Figure 21 - Indicative diagram illatrating how the wind turbine system will generate electricity for the swimming pool space ......................................................................................................................... 21 Figure 22 - Incoming Wind Direction on Site of Hotel Project ................................................................... 22 Figure 23 - Graph showing probability of achieving Wind Speed in proposed site........................................ 23 Figure 24 - Indicative representation of Wind Turbine Technology used in Hotel......................................... 23 Figure 25 - Graph comparing Probability of Wind Speed and corresponding Power Output........................... 24 Figure 26 - Example of Off Grid Battery Bank System to be used in Project (fusionenergy.co.uk) ................. 26 Figure 27 - Example of Energy Storage equipment to be used for Hotel Project (energystoragesystem.co.uk) 27 Figure 28 - Energy prices within the United Kingdom based on UKPower.com ............................................ 30 Figure 29 - Annual and estimated world population and energy demand (A.M.Omer 2007).......................... 31
  • 5.
    Report 5 –Mechanical – Low Carbon and Renewable Technology 1 1. EXECUTIVE SUMMARY This report will look into the specialist topic chosen to analyse and design to be integrated with the Hotel Project. The selected specialist topic is the Design of Low carbon and Renewable Technologies to supply the Hotel’s Energy requirements. The report will analyse the design of the most suited Low Carbon and Renewable Technology system as discussed in the Stage 2 Report. Following the final selection of the appropriate Low Carbon and Renewable Technology System, they will be analysed thoroughly to ensure they can provide the required energy requirements set out by the Hotel and provide an appropriate final design distribution layout, which can be applied. After the completion of the critical analysis of the Low Carbon Renewable Technologies, a final schematic will be produced to provide a complete picture of the sized systems being integrated into the Hotel as initially designed for. Further consideration will also be carried out to critically analyse the design carried out to ensure the Low Carbon and Renewable Technologies Design has been designed most appropriately and efficiently to produce the required energy requirements in return most appropriately and efficiently.
  • 6.
    Report 5 –Mechanical – Low Carbon and Renewable Technology 2 2. INTRODUCTION This report will look into applying renewable technologies or low carbon systems to the swimming pool space requirements. This report will go through the calculation process of sizing each renewable technology and determine the payback period for when that system is working with the swimming pools requirements for the client. In Table 1 it outlines the preliminary renewable and low carbon technology that was appraised from the stage 2 report. Table 1 - Summary of Renewable and Low Carbon Technologies selected from Stage 2 Report Technology Selected for next stage of design Combined cycle gas fired systems (i.e. CHP systems) No Wind energy Yes Solar Photovoltaic Yes Solar Thermal No Geothermal Energy(Inc. Ground source heat pumps) Yes Air source heat pump No Biomass No Within stage 2 of the report it was thoroughly discussed the advantages and disadvantages of using each of the listed Renewable and Low Carbon Technologies. The report then summarised whether how the listed systems would benefit the project depending on the application, location and viability in terms of sourcing certain aspects such as fuel unique to each system. The selected systems from the stage 2 report will go through the design of each of those systems and the calculation of payback periods in terms of costs to utilise these systems and the costs being saved in using them. The design of the renewable technologies will begin with a literature review carried out to provide an initial understanding of how multiple renewable technologies can be utilised together to provide for one application which is carried out as follows.
  • 7.
    Report 5 –Mechanical – Low Carbon and Renewable Technology 3 3. LITERATURE REVIEW A literature will be carried out to provide an understanding of the existing renewable energy sources and the applicability of the chosen renewable systems for this project design. From this literature review assumptions will be made for which the design of the renewable design shall be based around to provide a applicable solution based on research and analysis of existing materials based on renewable technology. 3.1 Analysis of Renewable Technology The existing provision of energy sources around the world are vastly growing scarce due to over use. Therefore, it has become a reality around the world that alternative energy sources are required to fuel the world. This statement has been back up by saying that Sustainable Energy Development Strategies typically involve three major technological changes, energy savings on the demand side, efficiency improvements in the energy production and replacement of fossil fuels by various sources of renewable energy (H.Lund 2006). Figure 1 - World primary energy supply (H.Lund 2006) From the produced figure above it shows how the world has depended upon coal and other traditional means of energy to supply the world’s energy needs. Although from analysing the produced graph in Figure 1 it shows how renewable technology and other means of alternative energy sources have become existent, however coal remains at the same requirement as before. Awareness about oil and gas reserves depletion and the predicted Global peaking of oil production as stated by (M.H.Albadi & E.F.El-Saadany 2009) has led to this change of view on the methods of producing alternative energy which has been the main subject point for many years and will inevitably overcome the use of traditional means of energy sources in the foreseeable future. 3.2 Analysis of Photovoltaic Panel The Photovoltaic Panel renewable technology has been chosen as one of the ideal methods of producing energy for the building given its location and other contributing factors through previously completed analysis of renewable technology. The production of renewable energy system is rather event in comparison to the production of coal and other fossil fuel based energy sources. Therefore, about photovoltaic panel based systems this point is also proven by that the present commercial solar cell converts solar energy into electricity with a relatively low efficiency, less than 20%. More than 80% of the absorbed energy is dumped to the surroundings again after electric energy conversion has stated by (B.J.Huang et Al 2000). However the photovoltaic panel production is fast growing and already showing great benefits to the worlds energy crisis as a 1-kW PV system producing 150 kWh each month prevent 75kg of fossil fuel from being mined. It avoids 150kg of C02 from entering the atmosphere and keeps 473 Litres of water from being consumed stated by (A.M.Omer 2007). Therefore however early the photovoltaic panel technology has been introduced it has already proven to make a benefit to the current energy crisis. The use of the photovoltaic panels will be continued in the design of the project as previously determined from the analysis produced that the system will be most beneficial when used in the proposed location and sized for the specified requirements. A further details analysis will be carried out to determine the full output of the system and whether the photovoltaic panel system design will provide a sustainable design approach to the projects requirements. 3.3 Analysis of Wind Power There is a strong growth in wind installed capacity worldwide due to three main reasons as stated by (M,H.Albadi & E.F.El-Saadany 2009), The first one is the growing public awareness and concern about emissions, climate change, and environmental issues related to other, competing, sources of energy. It has already been confirmed that the energy requirement of the world will not meet the existing fossil fuel based energy sources in the world. Therefore, the developments of technologies such as wind generation are being greatly accepted in communities as a means of saving the existing climate crisis. The second reason as explains by (M,H.Albadi & E.F.El-Saadany 2009) is that there is a strong growth of wind power capacity around the globe as a result of improved wind turbines technologies and increasing environmental concerns about other competing source of energy. As the wind turbine technology continues
  • 8.
    Report 5 –Mechanical – Low Carbon and Renewable Technology 4 to develop, so does the amount of energy that can be acquired from such technologies continue to increase. By applying such technologies to applications, it promotes development and movement to a better future where renewable technologies such as wind generation is used and utilised to provide the applications energy requirements. The third and last point made by (M,H.Albadi & E.F.El-Saadany 2009) is that the phenomenon is due to the fact that wind power is of intermittent nature. This point will be strongly analysed within this report as it is true that wind power is not a stable renewable technology and heavily depends on the amount of wind available at the proposed location for the project. However as outlined earlier in the report, photovoltaic panel technology will be combined with the energy production of the wind turbine technology to ensure stable energy production for the project. 3.4 Analysis of Combined Technology Following the statement provided by (H.Lund 2006) which states that Renewable Sources, such as wind and solar, only constitute a very small share of the total supply. However, the potential is substantial. Therefore, the decision was made to combine both technologies in order to provide the energy requirements for the swimming pool space for the project. By harnessing the renewable technologies advantages and working on the technologies disadvantages, the final design is aiming to be beneficial for the projects requirements. The combination of Photovoltaic Panel and Wind Generation technology has already been designed in other applications and shown benefits in producing renewable energy to applications. This has been proven from the findings acquired by (E.Koutroulis et Al 2005) where it states that Photovoltaic and Wind Generator power sources are widely used in order to supply power to consumers in remote areas. Due to their almost complementary power production characteristics, they are usually used in hybrid system configurations. Careful design and configuration of the renewable technology design will be carried out to ensure the maximum potential of both technologies are being utilised in providing the projects energy requirement. A proven methodology provided by (E.Koutroulis et Al 2005) will be utilised as shown in Figure 2 which will ensure the combination of both technologies has been thoroughly designed. Figure 2 - Flowchart of a typical photovoltaic and wind generation optimization methodology (E.Koutroulis et Al 2005) (E.Koutroulis et Al 2005) has stated that the major aspects in the design of PV and Wind Generation systems are the reliable power supply of the consumer under varying atmospheric conditions. Following this statement, a careful analysis of the swimming pools energy requirements will be analysed to ensure no produced energy from the renewable technologies is dumped or wasted but utilised in other means for the supply of energy requirements to the project in whole. The initial design idea is to generate the renewable energy from the technologies outlined and store them into storage batteries, which will be sized based on the peak output of the renewable technologies. However from the statement provided by (E.Koutroulis et Al 2005) where the corresponding total cost. Past proposed PV and Wind Generation system sizing methods suffer the disadvantage of not taking into account system design characteristics such as the number of battery chargers. This will be taken into account when sizing the appropriate battery storage system so as not to under size the battery storage capacity however also maintain a reasonable oversize tolerance for the battery storage system.
  • 9.
    Report 5 –Mechanical – Low Carbon and Renewable Technology 5 Provided that the Photovoltaic Panel and Wind Generation technology will be designed to maximise the output generated for the swimming pool space’s requirements, this does not determine constant supply of energy annually. This point has also been outlined by (H.Lund 2006) where there are still some technical issues to address in order to cope with the intermittency of some renewables, particularly wind and solar. Therefore the existing sized energy sources will remain sized for the swimming pool space to ensure provision of energy but will run at part load as of when the renewable technologies designed does not meet the applications requirements. 3.5 Effects on Project From the statement provided by (H.Lund 2006) which states that one challenge is to integrate a high share of intermittent resources into the energy system, especially the electricity supply. From this, the renewable technologies sized will be carefully analysed to ensure that the generated energy is utilised appropriately and not dumped meaninglessly. The typical system design is outlined as shown within Figure 3 which shows how when utilising both wind generation and photovoltaic panel technology into an application there is system dumping of energy. The renewable system design for the swimming pool space will be carefully designed to ensure no such dumping is present, however the excess energy produced will be utilised elsewhere within the project. Figure 3 - Stand Alone Wind and PV generating system configuration (M.H.Nehrir et Al 2000) To summarise the analysis of acquired literature based on renewable technologies and design approaches to be taken when designing the Photovoltaic Panel and Wind Generation systems for the swimming pool energy requirements will be utilised when carrying out the appropriate design methodology for determine the relevant components to make the whole system work for the supply the relevant energy requirements. Furthermore, it has been proven that relying on existing traditional methods of provision of energy for applications about coal and oil is fast growing out of touch with current methods of provision of energy requirements to applications. Figure 4 provides an illustration of how the current oil productions are slowly decreasing where inevitably it will run out. Therefore, the world will turn to renewable technologies as an alternative in providing the necessary requirements. This being said it should be noted that renewable technologies is improving in terms of minimising the available disadvantages associated with each technology and maximising the possible advantages. Therefore by utilising such technologies into applications such as being designed for the hotel projects requirements will provide the development necessary in ensuring these technologies are being noticed and working efficiently in providing a sustainable future to live in. Figure 4 - World Oil productions in the next 10-20 years (A.M.Omer 2007)
  • 10.
    Report 5 –Mechanical – Low Carbon and Renewable Technology 6 4. LOCATION ANALYSIS The project is located in Southampton within the city centre free of obstruction from other local buildings as shown in Figure 5 the building is estimated at a height of 80 meters which clears all sky lines with all other buildings in the surrounding area to obstruct solar gain as well as air flow. The building also has plenty of available space to utilize the accommodation of plant as well as free space for underground plant to accommodate services required for the renewable and low carbon systems. This will greatly benefit the Ground Source Heat Pump (GSHP) system as well as the Wind Turbine System. The available roof space to accommodate the solar panels for the swimming pool space is limited due to the plant that is required to be placed at both the roof level as well as the terrace level on the 2nd floor adjacent to the plant room. Although the design of the Photovoltaic (PV) panel design will work around the set limitations. Figure 6 illustrates the indicative free roof space available for the PV design to be applied to. Figure 7 illustrates the indicative free floor area on site available for the Wind Turbine Design and the Ground Source Heat Pump Array. Figure 6 -Available roof space for PV Panel Figure 7 - Available Terrace roof space for PV Panel The weather conditions at Southampton are based on the produced data from APACHE Weather data as used in previous reports. Below is a summary of the external summer and winter conditions at the proposed locations. 285.5 m2 Figure 5 - Site Plan of Project Building within City Centre Location 173.1 m2
  • 11.
    Report 5 –Mechanical – Low Carbon and Renewable Technology 7 Figure 8 - IES VE Provided Solar Path Analysis Summer Design Temperature: 28.900 C DB 19.400 C WB Peak Month: August Winter Design Temperature: -2.400 C DB -2.400 C WB Peak Month: February The provided information for the external weather conditions during the summer and winter periods will not benefit the design of the selected systems. The relevant information required for the systems are as follows. 5th June (North Facing Facades) 5th June (South Facing Facades) The PV Design is the process of converting direct sun light to DC electricity which is then used to provide the requirements intended for. Therefore the Solar path of the sun at the location specified needs to be analysed which can be done by using IES VE Software. As Figure 8 with the surrounding buildings being placed around the building model there is no obstructions to be seen at when the sun is most convenient in providing energy to the PV Panels. The wind turbines will be dependent upon the amount of air flow that will be experienced at the proposed location to stimulate the rotation of the wind turbines. The information with regards to the available wind flow at the proposed location will be provided by APACHE Weather data files, which is illustrated as a diagram by IES VE Software as shown in Figure 9. From the wind diagram as shown above, it provides an indicative idea of the mean wind velocity based on annual results acquired by IES VE software. This information will be later used for the Wind Turbine analysis within this report. 1 3 2 Figure 9 - IES VE Produced Wind Diagram
  • 12.
    Report 5 –Mechanical – Low Carbon and Renewable Technology 8 5. PHOTOVOLTAIC DESIGN APPRAISAL The Photovoltaic design will analyse the performance of 3 different photovoltaic panels which can produce the required load for the swimming pool space as indicated in Report 3 for Specialist Design, the most suitable inverter will also need to be sized to suit the array layout designed within this section of the report and then determine the annual energy prediction and payback period incorporated with the ideal PV Design layout for the swimming pools requirements. Initially the Photovoltaic panels will be made from Monocrystalline silicon cells instead of polycrystalline cells due to the higher efficiency of a range of 15-18% compared to the 13-16% efficiency from using polycrystalline. However, where the monocrystalline silicon cells benefit in better efficiency compared to the polycrystalline cells, they are more expensive because of this. However, monocrystalline silicon cells will be utilised within this project, as cost is not an option as outlined by the client who is after a sustainable final product. The installation of the PV Panels on the building is considered where to install them. The options on where to install them are as follows:  Sloping and Flat Roofs  Building Facades  Glass Roof Structures  Solar Shading Devices About the options outlined above, the flat roof surface is the most appropriate choice of installing the PV Panels on. This is because to incorporate the PV Panels into the building facades will disrupt the existing glazing render, as there is no visible space to place the PV Panels on the building façade. With regards to the glass roof structure, this does not seem a viable option due to the existence of plant within the ceiling void of the roof space which would be visible and may produce further problems with overheating risks of pipe runs and tempering of air flow within ductwork to the excess solar gain experienced. The use of solar shading devices within this project are utilised by the use of the balcony’s on each floor to each hotel space. However, the angle at which to install the PV Panels onto the balcony’s shows to be a none beneficial method of installation to maximise the direct sunlight experienced at peak times during the day based on the solar path diagram produced by IES VE Software. Therefore, the roof space makes to be a viable area of installing the PV Panels on due to the unlimited variations of orientation and angle of installing with use of different mounting methods to maximise the direct sunlight experienced. The installation process of the PV Panels on the roof will be taken up by the manufactures who install them directly to the project at the proposed space on the roof with reference to the roof space drawings produced by the Architectural Engineering Engineer, which will be produced within the drawings package. To summarise the roof mounted application for the PV Panel will be fitted using a metal frame at the proposed angle and orientation. The metal frame will need to consider the follow lowing criteria’s:  The electrical fittings and connections as well as cables will need protection as they are exposed to the elements being external  The metal frame must be able to withstand the forces that can occur on the PV Panels such as Wind and Snow.  The consideration of safe and easy access to the PV Panels for maintenance and cleaning. The Design process will consist of various stages to complete the design. The first part is to compare PV Modules technically which will be used in the design process. Therefore, Table 2 outlines the three PV Modules, which will be used to compare within the design process later on in this report. Figure 10 illustrates the process of how the Photovoltaic Design will benefit the design of the swimming pools requirements. Charge Controller Battery System Inverter AC Power DC Power Figure 10 - Illustration of how Photovoltaic Panels work
  • 13.
    Report 5 –Mechanical – Low Carbon and Renewable Technology 9 5.1 Photovoltaic Panel Comparison Within Table 2 three PV Module have been chosen from various manufactures with various technical specifications. Initially within the report it was stated as a product brief that the involvement of Polycrystalline modules will not be included within the selection however the stated efficiency by BP manufacture for polycrystalline modules are at 17% and the monocrystalline module produced by the same manufacture has an efficiency of 11.6% therefore the selection will be based on the efficiency of the modules rather than the type of material the modules are made from. Table 2 - Selection of PV Modules to be used in design calculation comparison Performance & Characteristic BP Solar 5170S Monocrystalline Module BP375 polycrystalline silicon module Hyundai - Solar Mono-crystalline Type 250 Maximum Power (Watts) 75 170 260 Maximum Voltage (Volts) 17.3 36.0 31.1 Maximum Current (Amps) 4.35 4.72 8.4 Open circuit voltage (Volts) 21.8 44.2 37.9 Short Circuit Current (Amps) 4.75 5.00 8.9 TC Short Circuit Current (%/°C) 0.065 0.065 0.032 TC Open Circuit Voltage (V/°C) - 0.08 -0.16 -0.33 TC Maximum Power (%/°C) - 0.5 -0.5 -0.45 Width (mm) 537 790 998 Length (mm) 1204 1593 1640 Module Efficiency (%) 11.6 17.0 15.9 From the produced PV Module comparison layout, the three different design comparisons can be carried out. As each calculation, process will be similar to each other. The Hyundai Solar Mono-crystalline Type 250 Module will be chosen to illustrate the full calculation process of determining the various electrical requirements and array design. Furthermore as there are two roof spaces where the PV Panels will be located, there will be two main calculations where the PV Panels will be orientated in two different positions with 2 sub calculations within each main calculation for the PV Panel string distribution. Therefore the total in four indicative PV Panel string distributions for each of the roof spaces are shown as follows. As each calculation process will be the same, from the two indicative locations chosen to locate the PV Panel array only one will be chosen to continue the calculation with. The final section of the PV Design appraisal will finalise the sized systems. An indicative image of the Photovoltaic Panel that will be used is shown in Figure 11 the chosen PV panel to continue with in the calculation process has the highest Maximum Power output and the most efficient panel as discussed within this section. Figure 11 - An Indicative image of the chosen Hyundai Solar Mono Crystaline Type 250 PV Module
  • 14.
    Report 5 –Mechanical – Low Carbon and Renewable Technology 10 5.1.1 PV Panel Array Output Calculation As mentioned in the earlier section of the report, the PV Panel array will be assorted in 4 different options. Each option has been sorted in such a way to emphasize the benefits of that distribution to overall PV Panel Array output and the feasibility of the distribution. The 4 different options have been outlined as follows below. Option 1 – 70 PV Panels – The PV Panels will be orientated in the given space on the roof space to maximise the amount of PV Panels that can be installed on which in this case is 70. The PV Panels will be connected to each other in one string connection to minimise the current used to utilise the PV Array, however the disadvantage of this method is that if one of the PV Panels receive insufficient direct Solar Gain from the Suns solar path then all the PV modules connected in series will stop working as they are in series. Option 1 has been illustrated as shown in Figure 12 below. Figure 12 - Option 1 on the Roof Space with 70 panels linked in one string Option 2 – 77 PV Panels – Orientating the PV Panel modules 90 degrees benefited this manoeuvre by increasing the maximum amiable PV Panels that can fitted into the space given. The PV Panels will be again connected in one series which provides the same risk as option 1 where if one of the modules do not receive direct Solar gain from the Sun solar path the other modules in series will be limited in maximising their potential of providing an output. Option 2 has been illustrated as shown in Figure 13 below Figure 13 - Option 2 on the Terrace Roof Space with 77 panels linked in one string Option 3 – 70 PV Panels – Analysing the recurring disadvantages outline from options 1 and 2, the current option consist of having 2 strings connecting the PV Panel modules where each string has 35 modules connected in series. The benefit of the split strings is so that it reduces the chance of a single module effecting the whole series if the total amount of modules are connected in two series so therefore if one string does get effected of the limited direct solar gain upon one of the modules in that series, the other series of 35 modules will be able to continue to provide sufficient output. Option 3 has been illustrated as shown in Figure 14 below.
  • 15.
    Report 5 –Mechanical – Low Carbon and Renewable Technology 11 Figure 14 - Option 3 on the Terrace Roof Space with 70 panels linked by 2 strings Option 4 – 77 PV Panels – by using the orientation chosen in option 2 where it was assessed that the maximum number of PV Panels could be fitted into the space given so therefore this has been chosen. Furthermore to Option 3’s analysis of using 2 strings in the PV Panel array design, this option will uses 7 strings with 11 modules in each string. This will benefit the overall design as using the solar path analysis from Figure 8 near the beginning of the report, it is clear to see that the terrace roof space being analysed will be at times be in shade during the day to the higher adjacent part of the building. For this reason, it seems ideal to maximise the amount of strings within this PV Panel array design to minimise the risk of a large section of the array being unable to produce an output due to the limit in modules in series. Option 4 has been illustrated as shown in Figure 15 below. Figure 15 - Option 4 on the Terrace Roof Space with 77 Panels linked by 11 Strings Each of the options outlined above will be used to calculate the various results to be used in a comparison of the suitability in sizing an inverter. Option 1 will be the chosen to carry out the full calculation processes of acquiring the following results.  Equation 1 – MFF Voltage @ 60°C (Volts)  Equation 2 – VocVoltage @ -10°C (Volts)  Equation 3 – String Voltage @ Min Module Voltage Range (Volts)  Equation 4 – String Voltage @ STC Module Voltage Range (Volts)  Equation 5 – String Voltage @ Maximum Module Voltage Range (Volts)  Equation 6 – Maximum Array Current (Amps)  Equation 7 – Required Inverted Rated Power (Watts) By acquiring the calculated results for each option, it can then be used to size the required inverter to suit.
  • 16.
    Report 5 –Mechanical – Low Carbon and Renewable Technology 12 5.1.2 Voltage Range Calculation Below are the reasonable minimum and maximum voltage ranges expected for the Hyundai Solar Mono- Crystalline panel. A Voltage of 31.1 has already been stated for Standard Test Conditions at 25°C. 𝑴𝑷𝑷 𝑽𝒐𝒍𝒕𝒂𝒈𝒆 @ 𝟔𝟎℃ = 𝑽𝒐𝒍𝒕𝒂𝒈𝒆 @ 𝟐𝟓℃ + (𝑻𝒆𝒎𝒑 𝒄𝒐𝒆𝒇𝒇 𝒐𝒇 𝑽𝒐𝒍𝒕𝒂𝒈𝒆 × (𝟔𝟎 − 𝟐𝟓)) Where: 𝑀𝑃𝑃 𝑉𝑜𝑙𝑡𝑎𝑔𝑒 @ 60℃ 𝑖𝑠 𝑡𝑜 𝑏𝑒 𝑐𝑎𝑙𝑐𝑢𝑙𝑎𝑡𝑒𝑑 𝑉𝑜𝑙𝑡𝑎𝑔𝑒 @ 25℃ 𝑡𝑜 𝑏𝑒 31.1 𝑉 𝑇𝑒𝑚𝑝 𝑐𝑜𝑒𝑓𝑓 𝑜𝑓 𝑉𝑜𝑙𝑡𝑎𝑔𝑒 𝑡𝑜 𝑏𝑒 − 0.33 V/°C Therefore: 𝑀𝑃𝑃 𝑉𝑜𝑙𝑡𝑎𝑔𝑒 @ 60℃ = 31.1 + (−0.33 × (60 − 25)) 𝑴𝑷𝑷 𝑽𝒐𝒍𝒕𝒂𝒈𝒆 @ 𝟔𝟎℃ = 𝟏𝟔. 𝟐𝟓 𝑽 Now the MPP Voltage @60°C has been confirmed, the Voc Voltage @-10°C can be confirmed using the value already stated in table …. For Standard Test Conditions at -10°C to be 37.9 V as shown below. 𝑽𝒐𝒄 𝑽𝒐𝒍𝒕𝒂𝒈𝒆 @ − 𝟏𝟎℃ = 𝑽𝒐𝒄 @ 𝟐𝟓℃ + (𝑻𝒆𝒎𝒑 𝒄𝒐𝒆𝒇𝒇 𝒐𝒇 𝑽𝒐𝒍𝒕𝒂𝒈𝒆 × (−𝟏𝟎 − 𝟐𝟓)) Where: 𝑉𝑜𝑐 𝑉𝑜𝑙𝑡𝑎𝑔𝑒 @ − 10℃ 𝑖𝑠 𝑡𝑜 𝑏𝑒 𝑐𝑎𝑙𝑐𝑢𝑙𝑎𝑡𝑒𝑑 𝑉𝑜𝑐 @ 25℃ 𝑖𝑠 𝑡𝑜 𝑏𝑒 37.9 𝑉 Therefore: 𝑉𝑜𝑐 𝑉𝑜𝑙𝑡𝑎𝑔𝑒 @ − 10℃ = 37.9 + (−0.33 × (−10 − 25)) 𝑽𝒐𝒄 𝑽𝒐𝒍𝒕𝒂𝒈𝒆 @ − 𝟏𝟎℃ = 𝟒𝟗. 𝟒 𝟓 𝑽 Using the acquired two voltage figures for different set conditions the Voltage range per string as shown below. The minimum String voltage value can be determined by using the following calculation. 𝑺𝒕𝒓𝒊𝒏𝒈 𝑽𝒐𝒍𝒕𝒂𝒈𝒆 @ 𝒎𝒊𝒏 𝒎𝒐𝒅𝒖𝒍𝒆 𝒗𝒐𝒍𝒕𝒂𝒈𝒆 = 𝑴𝒐𝒅𝒖𝒍𝒆 𝑴𝑷𝑷 𝑽𝒐𝒍𝒕𝒂𝒈𝒆 @ 𝟔𝟎℃ × 𝑺𝒕𝒓𝒊𝒏𝒈 𝑳𝒆𝒏𝒈𝒕𝒉 Where: 𝑆𝑡𝑟𝑖𝑛𝑔 𝑉𝑜𝑙𝑡𝑎𝑔𝑒 @ 𝑚𝑖𝑛 𝑚𝑜𝑑𝑢𝑙𝑒 𝑣𝑜𝑙𝑡𝑎𝑔𝑒 𝑡𝑜 𝑏𝑒 𝑐𝑎𝑙𝑐𝑢𝑙𝑎𝑡𝑒𝑑 𝑀𝑜𝑑𝑢𝑙𝑒 𝑀𝑃𝑃 𝑉𝑜𝑙𝑡𝑎𝑔𝑒 @ 60℃𝑖𝑠 𝑡𝑜 𝑏𝑒 16.25 𝑉 𝑆𝑡𝑟𝑖𝑛𝑔 𝐿𝑒𝑛𝑔𝑡ℎ 𝑖𝑠 𝑡𝑜 𝑏𝑒 70 𝑀𝑜𝑑𝑢𝑙𝑒𝑠 𝑖𝑛 𝑜𝑛𝑒 𝑠𝑡𝑟𝑖𝑛𝑔 Therefore: 𝑆𝑡𝑟𝑖𝑛𝑔 𝑉𝑜𝑙𝑡𝑎𝑔𝑒 @ 𝑚𝑖𝑛 𝑚𝑜𝑑𝑢𝑙𝑒 𝑣𝑜𝑙𝑡𝑎𝑔𝑒 = 16.25 × 70 = 1137.5 𝑺𝒕𝒓𝒊𝒏𝒈 𝑽𝒐𝒍𝒕𝒂𝒈𝒆 @ 𝒎𝒊𝒏 𝒎𝒐𝒅𝒖𝒍𝒆 𝒗𝒐𝒍𝒕𝒂𝒈𝒆 = 𝟏𝟏𝟑𝟕. 𝟓 𝑽 The Minimum voltage requirement has been determined per string, so therefore the STC voltage for each string needs to be confirmed using the following calculation. 𝑺𝒕𝒓𝒊𝒏𝒈 𝑽𝒐𝒍𝒕𝒂𝒈𝒆 @ 𝑺𝑻𝑪 𝒎𝒐𝒅𝒖𝒍𝒆 𝒗𝒐𝒍𝒕𝒂𝒈𝒆 = 𝑴𝒐𝒅𝒖𝒍𝒆 𝑴𝑷𝑷 𝑽𝒐𝒍𝒕𝒂𝒈𝒆 @ 𝟐𝟓℃ × 𝑺𝒕𝒓𝒊𝒏𝒈 𝑳𝒆𝒏𝒈𝒕𝒉 Where: 𝑆𝑡𝑟𝑖𝑛𝑔 𝑉𝑜𝑙𝑡𝑎𝑔𝑒 @ 𝑆𝑇𝐶 𝑚𝑜𝑑𝑢𝑙𝑒 𝑣𝑜𝑙𝑡𝑎𝑔𝑒 𝑖𝑠 𝑡𝑜 𝑏𝑒 𝑐𝑎𝑙𝑐𝑢𝑙𝑎𝑡𝑒𝑑 𝑀𝑜𝑑𝑢𝑙𝑒 𝑀𝑃𝑃 𝑉𝑜𝑙𝑡𝑎𝑔𝑒 @ 25℃ 𝑖𝑠 𝑡𝑜 𝑏𝑒 31.1 𝑉 Therefore: 𝑆𝑡𝑟𝑖𝑛𝑔 𝑉𝑜𝑙𝑡𝑎𝑔𝑒 @ 𝑆𝑇𝐶 𝑚𝑜𝑑𝑢𝑙𝑒 𝑣𝑜𝑙𝑡𝑎𝑔𝑒 = 31.1 × 70 𝑺𝒕𝒓𝒊𝒏𝒈 𝑽𝒐𝒍𝒕𝒂𝒈𝒆 @ 𝑺𝑻𝑪 𝒎𝒐𝒅𝒖𝒍𝒆 𝒗𝒐𝒍𝒕𝒂𝒈𝒆 = 𝟐𝟏𝟕𝟕 𝑽 The STC voltage requirement has been determined per string so therefore the Maximum Voltage for each string can now be confirmed using the following calculation. 𝑺𝒕𝒓𝒊𝒏𝒈 𝑽𝒐𝒍𝒕𝒂𝒈𝒆 @ 𝒎𝒂𝒙 𝒎𝒐𝒅𝒖𝒍𝒆 𝒗𝒐𝒍𝒕𝒂𝒈𝒆 = 𝑴𝒐𝒅𝒖𝒍𝒆 𝑴𝑷𝑷 𝑽𝒐𝒍𝒕𝒂𝒈𝒆 @ − 𝟏𝟎℃ × 𝑺𝒕𝒓𝒊𝒏𝒈 𝑳𝒆𝒏𝒈𝒕𝒉 Where: 𝑆𝑡𝑟𝑖𝑛𝑔 𝑉𝑜𝑙𝑡𝑎𝑔𝑒 @ 𝑚𝑎𝑥 𝑚𝑜𝑑𝑢𝑙𝑒 𝑣𝑜𝑙𝑡𝑎𝑔𝑒 = 𝑀𝑜𝑑𝑢𝑙𝑒 𝑀𝑃𝑃 𝑉𝑜𝑙𝑡𝑎𝑔𝑒 @ − 10℃ × 𝑆𝑡𝑟𝑖𝑛𝑔 𝐿𝑒𝑛𝑔𝑡ℎ 𝑆𝑡𝑟𝑖𝑛𝑔 𝑉𝑜𝑙𝑡𝑎𝑔𝑒 @ 𝑚𝑎𝑥 𝑚𝑜𝑑𝑢𝑙𝑒 𝑣𝑜𝑙𝑡𝑎𝑔𝑒 = 𝑀𝑜𝑑𝑢𝑙𝑒 𝑀𝑃𝑃 𝑉𝑜𝑙𝑡𝑎𝑔𝑒 @ − 10℃ × 𝑆𝑡𝑟𝑖𝑛𝑔 𝐿𝑒𝑛𝑔𝑡ℎ Therefore: 𝑆𝑡𝑟𝑖𝑛𝑔 𝑉𝑜𝑙𝑡𝑎𝑔𝑒 @ 𝑚𝑎𝑥 𝑚𝑜𝑑𝑢𝑙𝑒 𝑣𝑜𝑙𝑡𝑎𝑔𝑒 = 49.45 × 70 𝑺𝒕𝒓𝒊𝒏𝒈 𝑽𝒐𝒍𝒕𝒂𝒈𝒆 @ 𝒎𝒂𝒙 𝒎𝒐𝒅𝒖𝒍𝒆 𝒗𝒐𝒍𝒕𝒂𝒈𝒆 = 𝟑𝟒𝟔𝟏. 𝟓 𝑽
  • 17.
    Report 5 –Mechanical – Low Carbon and Renewable Technology 13 To be able to accurately size the inverter the maximum array current and the required inverter rated power has to be calculated. After this stage the inverter parameters have been found and a suitable inverter can be selected. To do so, the maximum array current, array power and the required inverter rated power need to be determined where the calculations are shown below. 𝑴𝒂𝒙𝒊𝒎𝒖𝒎 𝑨𝒓𝒓𝒂𝒚 𝑪𝒖𝒓𝒓𝒆𝒏𝒕 = 𝑴𝒂𝒙 𝑺𝒕𝒓𝒊𝒏𝒈 𝒄𝒖𝒓𝒓𝒆𝒏𝒕 × 𝑵𝒐. 𝒐𝒇 𝑺𝒕𝒓𝒊𝒏𝒈𝒔 Where: 𝑀𝑎𝑥𝑖𝑚𝑢𝑚 𝐴𝑟𝑟𝑎𝑦 𝐶𝑢𝑟𝑟𝑒𝑛𝑡 𝑛𝑒𝑒𝑑𝑠 𝑡𝑜 𝑏𝑒 𝑐𝑎𝑙𝑐𝑢𝑙𝑎𝑡𝑒𝑑 𝑀𝑎𝑥 𝑆𝑡𝑟𝑖𝑛𝑔 𝑐𝑢𝑟𝑟𝑒𝑛𝑡 𝑡𝑜 𝑏𝑒 8.4 𝐴𝑚𝑝𝑠 𝑇ℎ𝑒 𝑛𝑢𝑚𝑏𝑒𝑟 𝑜𝑓 𝑠𝑡𝑟𝑖𝑛𝑔𝑠 𝑤𝑖𝑙𝑙 𝑏𝑒 𝑜𝑛𝑒 𝑤ℎ𝑒𝑟𝑒 𝑡ℎ𝑒𝑟𝑒 𝑤𝑖𝑙𝑙 𝑏𝑒 70 𝑚𝑜𝑑𝑢𝑙𝑒𝑠 𝑐𝑜𝑛𝑛𝑒𝑐𝑡𝑒𝑑 𝑖𝑛 𝑠𝑒𝑟𝑖𝑒𝑠 𝑀𝑎𝑥𝑖𝑚𝑢𝑚 𝐴𝑟𝑟𝑎𝑦 𝐶𝑢𝑟𝑟𝑒𝑛𝑡 = 8.4 × 1 𝑴𝒂𝒙𝒊𝒎𝒖𝒎 𝑨𝒓𝒓𝒂𝒚 𝑪𝒖𝒓𝒓𝒆𝒏𝒕 = 𝟖. 𝟒 𝑨𝒎𝒑𝒔 The maximum current has been determined so therefore following this to finalise the selection of the inverter, a requirement of the expected array power output needs to be confirmed of the whole array which can be determined by using the following calculation. 𝑨𝒓𝒓𝒂𝒚 𝑷𝒐𝒘𝒆𝒓 (𝑾𝒂𝒕𝒕𝒔) = 𝑴𝒐𝒅𝒖𝒍𝒆 𝑷𝒎𝒂𝒙 × 𝑵𝒐. 𝒐𝒇 𝒎𝒐𝒅𝒖𝒍𝒆𝒔 Where: 𝐴𝑟𝑟𝑎𝑦 𝑃𝑜𝑤𝑒𝑟 (𝑊𝑎𝑡𝑡𝑠) 𝑡𝑜 𝑏𝑒 𝑐𝑎𝑙𝑐𝑢𝑙𝑎𝑡𝑒𝑑 𝑀𝑜𝑑𝑢𝑙𝑒 𝑃𝑚𝑎𝑥 𝑡𝑜 𝑏𝑒 260 𝑊 𝑁𝑢𝑚𝑏𝑒𝑟 𝑜𝑓 𝑚𝑜𝑑𝑢𝑙𝑒𝑠 𝑡𝑜 𝑏𝑒 70 𝑖𝑛 𝑡ℎ 𝑒𝑠𝑖𝑧𝑒𝑑 𝑎𝑟𝑟𝑎𝑦 Therefore: 𝐴𝑟𝑟𝑎𝑦 𝑃𝑜𝑤𝑒𝑟 (𝑊𝑎𝑡𝑡𝑠) = 260 × 70 𝑨𝒓𝒓𝒂𝒚 𝑷𝒐𝒘𝒆𝒓 (𝑾𝒂𝒕𝒕𝒔) = 𝟏𝟖𝟐𝟎𝟎 𝑾 Now that the final total array power has been determined, this power requirement needs to be within the capabilities of the selected inverter to produce as AC Current into the Building. Therefore using the following calculation the required inverter rated power can be determined. 𝑹𝒆𝒒𝒖𝒊𝒓𝒆𝒅 𝑰𝒏𝒗𝒆𝒓𝒕𝒆𝒓 𝑹𝒂𝒕𝒆𝒅 𝑷𝒐𝒘𝒆𝒓 = 𝑨𝒓𝒓𝒂𝒚 𝑷𝒐𝒘𝒆𝒓 × 𝑷𝒓𝒆𝒇𝒆𝒓𝒓𝒆𝒅 𝑰𝒏𝒗𝒆𝒓𝒕𝒆𝒓 𝑺𝒊𝒛𝒆 Where: 𝑅𝑒𝑞𝑢𝑖𝑟𝑒𝑑 𝐼𝑛𝑣𝑒𝑟𝑡𝑒𝑟 𝑅𝑎𝑡𝑒𝑑 𝑃𝑜𝑤𝑒𝑟 𝑖𝑠 𝑡𝑜 𝑏𝑒 𝑐𝑎𝑙𝑐𝑢𝑙𝑎𝑡𝑒𝑑 𝐴𝑟𝑟𝑎𝑦 𝑃𝑜𝑤𝑒𝑟 ℎ𝑎𝑠 𝑏𝑒𝑒𝑛 𝑐𝑎𝑙𝑐𝑢𝑙𝑎𝑡𝑒𝑑 𝑡𝑜 𝑏𝑒 18200 𝑊 𝑃𝑟𝑒𝑓𝑒𝑟𝑟𝑒𝑑 𝐼𝑛𝑣𝑒𝑟𝑡𝑒𝑟 𝑆𝑖𝑧𝑒 𝑡𝑜 𝑏𝑒 𝑎 𝑓𝑎𝑐𝑡𝑜𝑟 𝑜𝑓 0.8 Therefore: 𝑅𝑒𝑞𝑢𝑖𝑟𝑒𝑑 𝐼𝑛𝑣𝑒𝑟𝑡𝑒𝑟 𝑅𝑎𝑡𝑒𝑑 𝑃𝑜𝑤𝑒𝑟 = 18200 × 0.8 𝑹𝒆𝒒𝒖𝒊𝒓𝒆𝒅 𝑰𝒏𝒗𝒆𝒓𝒕𝒆𝒓 𝑹𝒂𝒕𝒆𝒅 𝑷𝒐𝒘𝒆𝒓 = 𝟏𝟒𝟓𝟔𝟎 𝒓𝒂𝒕𝒆𝒅 𝑾𝒂𝒕𝒕𝒔 As a similar calculation process will be carried out for the other options shown in Figures 12, 13, 14 and 15 they have been carried out and summaried in Table 3 for the various variables and options they relate to as shown below. Table 3 - PV Panel Option Comparison Option 1 Option 2 Option 3 Option 4 MPP Voltage @ 60℃ (Volts) 16.25 16.25 16.25 16.25 Voc Voltage @-10℃ (Volts) 49.45 49.45 49.45 49.45 String Voltage @ min module voltage (Volts) 1137.5 1251.25 568.75 178.75 String Voltage @ STC module voltage (Volts) 2177 2394.7 1088.5 342.1 String Voltage @ max module voltage (Volts) 3461.5 3807.65 1730.75 543.95 Maximum Array Current (Amps) 8.4 8.4 16.8 58.8 Array Power (Watts) 18200 20020 18200 20020 Required Inverter Rated Power (Watts) 14560 16016 14560 16016 From the produced summary of values for each of option analysed it shows clearly that each option is not capatiable with the required interter sizing.
  • 18.
    Report 5 –Mechanical – Low Carbon and Renewable Technology 14 5.2 Inverter Selection To determine the suitable inverter to the produced table in previous chapter summarising the finalised optins for the PV Panel module a selection process is required as shown in this section of the report. The requirement of the the inverters is to change the received solar gain stored within the PV Panels into DC Electricity which is then used within the uilding to feed the requiremens it is inteneded for. Using the acquired information from the previous chapter on required inverter rated powers for the various options, the suitable inverters can be selected as shown below. 5.2.1 Summary of Inverter size Choices From the outlined requirements for the inverter slection as shown in Table 4 the ideal inverters to those options have been outlined as follows in Table 4. Table 4 - comparison of chosen Array Design and chosen Inverter Suitability Inverter rated power (Watts) Minimum MMP Input Voltage less than (Volts) Maximum MMP Input Voltage greater than (Volts) Midrange of MMP Voltage Range to be circa (Volts) Maximum Input Current greater than (Amps) Option 1 14560 1137.50 3461.50 2177.00 8.40 Option 2 16016 1251.25 3807.65 2394.70 8.40 Option 3 14560 568.75 1730.50 1088.50 16.80 Option 4 16016 178.75 543.95 342.10 58.80 Indicative Inverter Selection 20440 150 1000 800 33 From the produced table above it is clear to see the produced option do not comply with the required invter sizing. Below is a summary of how each option does not comply with the required inverter sizing as follows.  Option 1 – The minimum input and maximum voltage requirements for this option far exceeds the capability of the sized Inverter however the maximum input current requirements is within the requirement of the invter  Option 2 – Option 2 is similar to Option 1 where the maximum and minimum input voltages far exceed the capabilities of the inverter hwoever the input current requirement is within the inverters capabilities.  Option 3 – Option 3 is yet again similar to Options 1 and 2 however has shown improvements in the magnitude of how much the option exceeds the inverters requirements in the maximum and minimum input voltages range however an increase in the maximum input current has been experienced although still within the inverters requirements.  Option 4 – This option is the most suitable option to the sized inverter as the maximum and minimum input voltage ranges are within the capabilities of the inverter although the maximum input current exceeds the capabilities of the sized inverter. Following the analysis of each option, Option 4 seems to be the most suitable option although there is a single requirement which does not fit the invertes requirements. Therefore a further analysis into this option to find a suitable inverter will be carried out as follows. 5.2.2 Revised PV Array Selection Option 4 is proposed to run on two separate inverters which will then feed the corresponding battery as follows. Therefore the following loads will be acquired for each inverter following the same calculation process as shown previously within this report as follows. From the previous analysis, it has been found that each string consists of too much voltage capacity for a suitable inverter to size. Therefore with this revised option it has been optimised to maintain aa low maximum urrent whilst also maintaining a a sufficient amoun t of voltage capacity within each sting with wil have its own inverter to suit. Therefore two further options have been created to optimise the appropriate inverter selection.
  • 19.
    Report 5 –Mechanical – Low Carbon and Renewable Technology 15 The first option consists of 70 modules where each string will conist of 14 modules with 5 inverters fitting to each set of 14 modules therefore 5 inverters will be required each with the same loads. To illustrate this option, Figure 16 shows this. Figure 16 - Indicative PV Panel array design of 70 Modules with 5 inverters connected The second option produced consists of 77 modules which will been arranged where one string will contain 11 modules connected inseries and also linked to one inverter. Therefore in total there will be a total of 7 separate strings each with their own sized inverter to suit. To illustrate this option Figure 17 shows this. Figure 17 - Indicative PV Panel array design of 77 Modules with 7 inverters connected From the produced illustration of how the the PV array will be formed, the following inverter sizes to suit each section of the PV Array can be determined by the following Inverter analysis as provided by Table 5.
  • 20.
    Report 5 –Mechanical – Low Carbon and Renewable Technology 16 Table 5 - Comparison of Final two options for PV Panel Array design Option 1 Option 2 Number of PV Modues 14 11 Array power (Watts) 3640 2860 Inverter rated power (Watts) 2912 2288 Minimum MMP Input Voltage less than (Volts) 227.5 178.75 Maximum MMP Input Voltage greater than (Volts) 692.3 543.95 Midrange of MMP Voltage Range to be circa (Volts) 435.4 342.1 Maximum Input Current greater than (Amps) 8.4 8.4 From the produced table above the new selection for the PV Array has been confirmed. Using the tabe contents the suitable inverter can be sized. This will be confirmed by a comparison of the most suitable inverter to the provided selection of eavh section of the total PV Array. This is shown as follows in Table 6. Table 6 - Inverter Comparison to best suit final selected PV Panel Array Options Inverter rated power (Watts) Minimum MMP Input Voltage less than (Volts) Maximum MMP Input Voltage greater than (Volts) Midrange of MMP Voltage Range to be circa (Volts) Maximum Input Current greater than (Amps) Inverter 1 2650 80 600 260 - 500 10 Inverter 2 6280 150 750 350 - 500 15 Inverter 3 5200 150 750 175 - 500 15 Option 1 2912 227.5 692.3 435.4 8.4 Inverter 1 as proven to be inacapable of supporting the required inverter requirements Inverter 2 & 3 fits this criteria appropriately with sufficient performance gap sized Inverter 2 & 3 fits this criteria appropriately with sufficient performance gap sized All of the selected invierters fit this criteria Inverter 1 fits this criteria appropriately with sufficient performance gap sized Option 2 2288 178.75 543.95 342.1 8.4 Inverter 1 fits this criteria appropriately with sufficient performance gap sized All of the selected inverters fit this criteria Inverter 1 fits this criteria appropriately with sufficient performance gap sized All of the selected inverters fit this criteria Inverter 1 fits this criteria appropriately with sufficient performance gap sized From the produced table above with the analysis of the selected 3 inverters to suit the two poptions produced, it seems there have been two outcomes made from this.
  • 21.
    Report 5 –Mechanical – Low Carbon and Renewable Technology 17  Option 1 – Inverter 3 – the reason for the selected inverter is that between inverter options 2 & 3 the rated power is the main variance where inverter 2 has a rated power of 6280 watts and inverter 3 has a rated power of 5200 therefore inverter 3 is closer to the required capabilities of the sized option 1 array so has been selected as the appropriate inverter choice.  Option 2 – Inverter 1 – this inverter selection suits the 2nd array options most appropriately from the inverter rated power to the maximum current available. All of the requirements stated by the technical data sheet for the inverter mst suit the sized array option. The other advantage is that from the produced analysis in table …. It shows that there is very little margin of oversizing between the created option and the chosen inverter therefore utilising the sized inverter as much as possible for the sized option. This is illustrated as follows in Figure 18. Figure 18 - Efficiency Curve for Chosen Inverter Selection (sma.co.uk) From the produced graph above in Figure 18 this shows that the designed PV array for the selected inverter works the inverter at the sized peak period at 86% which shows by the curve on the graph that is almost maximises the inverters requirements which also mimimise wastage of capabilities of the sized inverter. Between the two options produced and the corresponding inveter slections to match, it has been decided that ption 2 is the most ppropiate design for the required application therefore a total of 7 of the same sized inverters will be required. From the selected design for the PV array the Annual Energy prediction can be detrmined as follows in the next secton of this report.
  • 22.
    Report 5 –Mechanical – Low Carbon and Renewable Technology 18 5.3 Annual Energy Prediction With using the Photovoltaic system as well as the exisiting boilers to provide the Hot Water supply for the Swimming Pool Space needs to be justified as there is an immediate loss for the client in acquiring these two systems to provide on erequirement. However the use of the Photovoltaic System provides a benefit where the system can pay back the cost of acquiring that system and possibly provide savings to the client as the system has paid its debts. This can be determined with the use of the following calculations where the annual mean Irradation value needs to be determined which is as shown as follows. The total area of the sized array has to be determined by the use of the following calculation process. 𝑨𝒓𝒓𝒂𝒚 𝑨𝒓𝒆𝒂 = 𝟕𝟕 × (𝟏. 𝟔𝟒 × 𝟎. 𝟗𝟗𝟖) = 𝟏𝟐𝟔. 𝟎𝟑 𝒎 𝟐 From the calculated array value, the installed maximum array power needs to be also oncfmed before proceeding which has been calculated as follows. 𝑰𝒏𝒔𝒕𝒂𝒍𝒍𝒆𝒅 𝑴𝒂𝒙𝒊𝒎𝒖𝒎 𝑷𝒐𝒘𝒆𝒓 = 𝟐𝟔𝟎 × 𝟕𝟕 = 𝟐𝟎𝟎𝟐𝟎 𝑾(𝟐𝟎. 𝟎𝟐 𝒌𝑾) CIBSE Guide A Table 2.27 quotes data in 30° increments from 30-90°, due to there being no data for the roof angle of 33.5° the data has been interpolated to provide more accurate data. Column 4 in Figure 22 provides the data required for the rest of the calculation. Table 7 - Interpolated data of CIBSE Guide A Table 2.27 to find out irradiation at 33.5° Tilt Angle Mean Total Irradiation (°) 30 45 33.5 January 987 1071 1006.6 February 1697 1768 1713.56 March 2565 2574 2567.1 April 3950 3887 3935.3 May 4838 4652 4794.6 June 5059 4781 4994.13 July 4997 4758 4941.23 August 4616 4501 4589.16 September 3291 3315 3296.6 October 2343 2480 2374.96 November 1342 1467 1371.16 December 833 925 854.46 Annual Mean 3043 3015 3036.46 From the produced table above for the Tilt angle mean total irradiation value, the annyal solar global irradiation value can be confirmed by using the following calculation. 𝑰 𝒂𝒏𝒏𝒖𝒂𝒍 (𝑻&𝑶) = 𝑴𝒆𝒂𝒏 𝑨𝒏𝒏𝒖𝒂𝒍 𝑰𝒓𝒓𝒂𝒅𝒊𝒂𝒕𝒊𝒐𝒏 × 𝑫𝒂𝒚𝒔 𝒊𝒏 𝒂 𝒀𝒆𝒂𝒓 Where: 𝐼 𝑎𝑛𝑛𝑢𝑎𝑙 (𝑇&𝑂) 𝑤𝑖𝑙𝑙 𝑏𝑒 𝑐𝑎𝑙𝑐𝑢𝑙𝑎𝑡𝑒𝑑 𝑀𝑒𝑎𝑛 𝐴𝑛𝑛𝑢𝑎𝑙 𝐼𝑟𝑟𝑎𝑑𝑖𝑎𝑡𝑖𝑜𝑛 ℎ𝑎𝑠 𝑏𝑒𝑒𝑛 𝑑𝑒𝑡𝑒𝑟𝑚𝑖𝑛𝑒𝑑 𝑡𝑜 𝑏𝑒 3036.46 𝐷𝑎𝑦𝑠 𝑖𝑛 𝑎 𝑌𝑒𝑎𝑟 𝑖𝑠 𝑡𝑜 𝑏𝑒 362.25 𝑑𝑎𝑦𝑠 Therefore: 𝐼 𝑎𝑛𝑛𝑢𝑎𝑙 (𝑇&𝑂) = 3036.46 × 365.25 𝑰 𝒂𝒏𝒏𝒖𝒂𝒍 (𝑻&𝑶) = 𝟏𝟏𝟎𝟗. 𝟎𝟕 𝒌𝑾𝒉/𝒚𝒓/𝒎 𝟐 Using the calculated total annual solar irridation value we can now determine the uncorrected and corrected annual array energy output as shown below. 𝑬 𝒂𝒓𝒓𝒂𝒚 𝒖𝒏𝒄𝒐𝒓𝒓𝒆𝒄𝒕𝒆𝒅 = 𝑰 𝒂𝒏𝒏𝒖𝒂𝒍 (𝑻&𝑶) × 𝑴𝒐𝒅𝒖𝒍𝒆 𝑬𝒇𝒇𝒊𝒄𝒊𝒆𝒏𝒄𝒚 × 𝑨𝒓𝒓𝒂𝒚 𝑨𝒓𝒆𝒂 Where: 𝐸 𝑎𝑟𝑟𝑎𝑦 𝑢𝑛𝑐𝑜𝑟𝑟𝑒𝑐𝑡𝑒𝑑 𝑖𝑠 𝑡𝑜 𝑏𝑒 𝑐𝑎𝑙𝑐𝑢𝑙𝑎𝑡𝑒𝑑 𝑀𝑜𝑑𝑢𝑙𝑒 𝐸𝑓𝑓𝑖𝑐𝑖𝑒𝑛𝑐𝑦 𝑖𝑠 𝑡𝑜 𝑏𝑒 97.2%
  • 23.
    Report 5 –Mechanical – Low Carbon and Renewable Technology 19 𝐴𝑟𝑟𝑎𝑦 𝐴𝑟𝑒𝑎 𝑖𝑠 𝑡𝑜 𝑏𝑒 126.03 𝑚2 Therefore: 𝐸 𝑎𝑟𝑟𝑎𝑦 𝑢𝑛𝑐𝑜𝑟𝑟𝑒𝑐𝑡𝑒𝑑 = 1109.07 × 0.972 × 126.03 𝑬 𝒂𝒓𝒓𝒂𝒚 𝒖𝒏𝒄𝒐𝒓𝒓𝒆𝒄𝒕𝒆𝒅 = 𝟏𝟑𝟓𝟖𝟔𝟐. 𝟑𝟔𝟐 𝒌𝑾𝒉/𝒚𝒓 From the calculated Uncorrected energy array value the corrected value needs to be calculated by appliying the Energy array uncorrected constant as shown below. 𝑬 𝒂𝒓𝒓𝒂𝒚 𝒄𝒐𝒓𝒓𝒆𝒄𝒕𝒆𝒅 = 𝑬 𝒂𝒓𝒓𝒂𝒚 𝒖𝒏𝒄𝒐𝒓𝒓𝒆𝒄𝒕𝒆𝒅 × 𝑪𝑭 𝑺𝑴𝑫𝑻 Where: 𝐸 𝑎𝑟𝑟𝑎𝑦 𝑐𝑜𝑟𝑟𝑒𝑐𝑡𝑒𝑑 𝑖𝑠 𝑡𝑜 𝑏𝑒 𝑐𝑎𝑙𝑐𝑢𝑙𝑎𝑡𝑒𝑑 Earray uncorrected has been calculated to be 135862.362 kWh/yr 𝐶𝐹𝑆𝑀𝐷𝑇 𝑖𝑠 𝑖𝑠 𝑡𝑜 𝑏𝑒 0.9 Therefore: 𝐸 𝑎𝑟𝑟𝑎𝑦 𝑐𝑜𝑟𝑟𝑒𝑐𝑡𝑒𝑑 = 135862.362 × 0.9 𝑬 𝒂𝒓𝒓𝒂𝒚 𝒄𝒐𝒓𝒓𝒆𝒄𝒕𝒆𝒅 = 𝟏𝟐𝟐𝟐𝟕𝟔. 𝟏𝟐𝟔 𝒌𝑾𝒉/𝒚𝒓 From the corrected energy array output calculated the annual system energy output can be termeined as follows. 𝑬 𝒔𝒚𝒔𝒕𝒆𝒎 = 𝑬 𝒂𝒓𝒓𝒂𝒚 𝒄𝒐𝒓𝒓𝒆𝒄𝒕𝒆𝒅 × 𝑪𝑭 𝑩𝑶𝑺 Where: 𝐸𝑠𝑦𝑠𝑡𝑒𝑚 𝑖𝑠 𝑡𝑜 𝑏𝑒 𝑐𝑎𝑙𝑐𝑢𝑙𝑎𝑡𝑒𝑑 𝐸 𝑎𝑟𝑟𝑎𝑦 𝑐𝑜𝑟𝑟𝑒𝑐𝑡𝑒𝑑 ℎ𝑎𝑠 𝑏𝑒𝑒𝑛 𝑐𝑎𝑙𝑐𝑢𝑙𝑎𝑡𝑒𝑑 𝑡𝑜 𝑏𝑒 122276.126 𝑘𝑊ℎ/𝑦𝑟 𝐶𝐹𝐵𝑂𝑆 𝑖𝑠 𝑡𝑜 𝑏𝑒 0.85 Therefore: 𝐸𝑠𝑦𝑠𝑡𝑒𝑚 = 122276.126 × 0.85 𝑬 𝒔𝒚𝒔𝒕𝒆𝒎 = 𝟏𝟎𝟑𝟗𝟑𝟒. 𝟕𝟎𝟕 𝒌𝑾𝒉/𝒚𝒓 Finally from the calculated annual system energy value the final yield can be determined as shown below. 𝑭𝒊𝒏𝒂𝒍 𝑨𝒏𝒏𝒖𝒂𝒍 𝒀𝒊𝒆𝒍𝒅 (𝒀 𝒇) = 𝑨𝒏𝒏𝒖𝒂𝒍 𝑬𝒏𝒆𝒓𝒈𝒚 𝑶𝒖𝒑𝒖𝒕 (𝒌𝑾𝒉) 𝑰𝒏𝒔𝒕𝒂𝒍𝒍𝒆𝒅 𝑴𝒂𝒙𝒊𝒎𝒖𝒎 𝑷𝒐𝒘𝒆𝒓 (𝒌𝑾𝒑) Where: 𝐹𝑖𝑛𝑎𝑙 𝐴𝑛𝑛𝑢𝑎𝑙 𝑌𝑖𝑒𝑙𝑑 (𝑌𝑓) 𝑖𝑠 𝑡𝑜 𝑏𝑒 𝑐𝑎𝑙𝑐𝑢𝑙𝑎𝑡𝑒𝑑 𝐴𝑛𝑛𝑢𝑎𝑙 𝐸𝑛𝑒𝑟𝑔𝑦 𝑂𝑢𝑝𝑢𝑡 (𝑘𝑊ℎ) ℎ𝑎𝑠 𝑏𝑒𝑒𝑛 𝑐𝑎𝑙𝑐𝑢𝑙𝑎𝑡𝑒𝑑 𝑡𝑜 𝑏𝑒 103934.707 𝐼𝑛𝑠𝑡𝑎𝑙𝑙𝑒𝑑 𝑀𝑎𝑥𝑖𝑚𝑢𝑚 𝑃𝑜𝑤𝑒𝑟 (𝑘𝑊𝑝) ℎ𝑎𝑠 𝑏𝑒𝑒𝑛 𝑎𝑞𝑢𝑖𝑟𝑒𝑑 𝑓𝑟𝑜𝑚 𝑆𝑜𝑢𝑡ℎ𝑒𝑟𝑛 𝐶𝑜𝑢𝑛𝑐𝑖𝑙 𝑡𝑜 𝑏𝑒 2.46 Therefore: 𝐹𝑖𝑛𝑎𝑙 𝐴𝑛𝑛𝑢𝑎𝑙 𝑌𝑖𝑒𝑙𝑑 (𝑌𝑓) = 103934.707 2.46 𝑭𝒊𝒏𝒂𝒍 𝑨𝒏𝒏𝒖𝒂𝒍 𝒀𝒊𝒆𝒍𝒅 (𝒀 𝒇) = 𝟒𝟐𝟐𝟒𝟗. 𝟖𝟖 𝒌𝑾𝒉 𝒌𝑾𝒑⁄ 𝒑𝒆𝒓 𝒚𝒆𝒂𝒓 From the finalised calculated final annual yield value, the PV Design for the swimming pool application has been designed.
  • 24.
    Report 5 –Mechanical – Low Carbon and Renewable Technology 20 6. WIND TURBINE DESIGN APPRAISAL The wind turbines design appraisal will follow a selection process with regards to the following sizing process of the wind turbines that will be required for the swimming pool space requirements. The design of the wind turbine is unique in the way it is a renewable enrgy source. The way the wind turbine aquires its energy requirement is by utilising its blades which will be made in the form of an aerofoil as found on an aircraft for its wing. Lift will be generated as air passes over the blade although instead of lifting an aircraft off the ground as it is commonly used in practice. In th wind turbine technology the blades will rotate the shaft which will generate the power needed for its purpose. The aerofoil used in the wind turbine technology will use a pressure differene created between the top and bottom of the aerofoil. Therefore the low pressure air experienced at the top of the aerofoil tries to suck the aerofoil and the air under it upwards hence the air under it upwards therefore the air beneath the aerofoil is trying to push th aerofoil upwards to reach the low pressure. The reaction experienced here is what is expereicned in practice with aircrafts when lift is generated. The wind turbine system will incorporate a horizontal rotor shaft as it is the most common in practice and range in size from a few hundred Watts to several Megawatts. The turbine system will include the following main parts to make each turbine as follows.  A rotor which will consist of 3 blades that will be converting the winds energy into rotational shaft energy  A tower to support the rotor and drive train  A Nacelle containing a drive train which will include a gearbox to minimise stress on the rotor when running at high speeds  Electronic equipment such as controls, electrical cables, inter connection equipment and ground support equipment. An illustrated diagram is shown in figure … which shows how the wind turbine will work to generate the electricity as shown below. The wind turbine equipment will be provided by the manufactuer from which the wind turbine will be sized from. The wind turbine will be utilising a battery system where the wind turbine will be charging a battery bank via a control unit. A controller will be required to ensure that the batteries are not over or under charged and can direct electrical power to another load which will be towards the solar thermal water heating system only when the batteries are fully charged. Due to the possibility of oversizing the batteries and invenvitable disadvantage with regards to cost, a careful analysis of the ideal amount of batteries to be sized will follow in this wind turbine appraisal. The benefits of carefully selecting the appropriate battery size for the wind turbine design is as follows. Figure 20 - Indicative Wind Turbine to be used in Hotel Project for Swimming Pool Electrical requirements Figure 19 – An illustrated diagram of a wind turbine to show how the electricity will be generated Inflow of Wind Inflow of Wind activates Rotar and Blades Rotor and Blades spin the main shaft and gearbox which spins the generator resulting in electrical output
  • 25.
    Report 5 –Mechanical – Low Carbon and Renewable Technology 21  Batteries life span will increase due to consistently using them  Cost savings due to careful design and selection of batteries appropriate to wind turbine capabilities of generating electricity. The wind turbines will be free standing on the free space surrounding the hotel building in the site indicated in Figure 4, the wind turbine will be best suited in this location due to the minimal interference of surrounding obstructions of other buoldings or objects to prevent the wind flow to the turbines. The site also can withstand environmental conditions such as small living organisms from underground and acidic rainfall the surface has to be waterproof, armoured, and UV Stable. The wind turbine will be supported using a tower whihch will improve the general performance of the turbine due to the height has been increased. Ideally the wind turbine should be located on site at a minimum height of 9 meters above any obstruction and likewise horizontally at a distance of 100 meters. The wind turbine will be design to a maximum experienced wind speed however if there is an ocurance of an abnormal increase in peak wind speed the turbine will be designed to turn off to prevent damage to the rotars but re-start operation as usual when the wind speed is well within the capabilities of the sized turbine. The structure of the turbine will be designed with consideration of the following.  Prevention of unauthorised access or climbing up the turbines will be designed.  The turbine should be able to be capable of being pivoted and lowered to the ground for maintenance issues.  All parts of the turbine should be corrosion proof due to the sea water evaporating into the air as well as the acidic rainwater.  The structure of the turbine should prevent adverse effects caused by vibration from the rotar. A diagram as shown in Figure 21 illustrates the indicative design layout of the Wind turbine design to the swimming pools electrical requirements as well as the possible supply to the water heating requiremnts of the swimming pool. To complete the wind turbie design, initially the sizing of the wind turbne must be determined. To do this the electrical requirement of the swimming pool space must be analysed which has been stated below.  Peak Electrical Swimming Pool Requirements - 9160 Watts The wind turbine will be designed to the Swimming Pools peak electrical requirements as it will be required to be able to handle the peak demands generated for that period of time. However it should be noted that the wind turbine may not always be able to generate the required amount of electricity for the Swimming pool space cosnstently due to the possible periods during the year where there is a lack of wind energy experienced. Therefore the existing electrical generator will remain sized to produce the required peak electrical demand as it can modulate depending on the load needed to satisfy from the sawimming pool space as well as the electrical supply from the Widn Turbine generated. The wind turbine and the electrical generator will take on a shared load of the peak requirement as discussed previously within this section.  Wind Turbine Share of Peak Electrical Demand to be 60%  Electrical Generator Share of Peak Electricaal Demand to be 40% The wind turbine will therefore be designed to the shared peak load as shown above. Firstly it should be determined the amout of Wind energy that will be experienced dueing the year which is shown as follows in the next secton of this report. DC – AC Inverter Bi-Directional Utility Meter Meter Battery Supply to Swimming Pool Electrical Requirements Supply to Swimming Pool Hot Water Heating Requirements Figure 21 - Indicative diagram illatrating how the wind turbine system will generate electricity for the swimming pool space
  • 26.
    Report 5 –Mechanical – Low Carbon and Renewable Technology 22 6.1 Linear Wind Velocity Calculation This section of the report will determine the range of which the wind energy experienced annualy will be by using the following calculation processes. By producing a graph at the end of the calculayion process will provide an indicative idea at how much the wind turbine technology will be able to satisfy the shared peak electrical load required to produce for the Swimming Pool Space. From the wind analysis using IES VE software, it was confirmed from the wind diagram that the area where the wind speed will be averaged at its highest annually is shown in Figure 22 as South to South West Region. The mean linear velocity has been determined as stated below by using IES VE Wind Analysis.  Mean Linear Velocity – 15.49 m/s at 40m Using the acquired mean linear velocity as stated above it can now be predict the Wind regime at the locaton at the hub height of 40m by using Rayleighs Probability Density function calculaton as shown below. 𝒇(𝒖) = 𝝅 × 𝒖 𝟐 × 𝒖 𝒎𝟏 𝟐 × 𝐞𝐱𝐩× (−𝟎. 𝟐𝟓 × 𝝅 × ( 𝒖 𝒖 𝒎𝟏 ) 𝟐 ) Where: 𝒇(𝒖) 𝒊𝒔 𝒕𝒉𝒆 𝑹𝒂𝒚𝒍𝒆𝒊𝒈𝒉 𝑷𝒓𝒐𝒃𝒂𝒃𝒊𝒍𝒊𝒕𝒚 𝑫𝒆𝒏𝒔𝒊𝒕𝒚 𝒇𝒖𝒏𝒄𝒕𝒊𝒐𝒏 𝒕𝒐 𝒃𝒆 𝒄𝒂𝒍𝒄𝒖𝒍𝒂𝒕𝒆𝒅 𝒖 𝒊𝒔 𝒕𝒉𝒆 𝒗𝒂𝒓𝒊𝒂𝒃𝒍𝒆 𝒘𝒊𝒏𝒅 𝒗𝒆𝒍𝒐𝒄𝒊𝒕𝒚 𝒗𝒂𝒍𝒖𝒆 𝒓𝒂𝒏𝒈𝒊𝒏𝒈 𝒇𝒓𝒐𝒎 𝟎 𝒎/𝒔 𝒕𝒐 𝟑𝟎 𝒎/𝒔 𝒖 𝒎𝟏 𝟐 𝒊𝒔 𝒕𝒉𝒆 𝒈𝒊𝒗𝒆𝒏 𝒍𝒊𝒏𝒆𝒂𝒓 𝒎𝒆𝒂𝒏 𝒗𝒆𝒍𝒐𝒄𝒊𝒕𝒚 𝒗𝒂𝒍𝒖𝒆 𝒐𝒇 𝟏𝟓. 𝟒𝟗 𝒎/𝒔 Therefore using the equation above the table below summaries the values acquired. Table 8 - Probability of Wind Speed occurance using Rayleigh Probability Calculation Wind Velocity (m/s) Probability f(u) 0 0.0000 2 0.0131 4 0.0252 6 0.0353 8 0.0429 10 0.0476 12 0.0494 14 0.0485 16 0.0454 18 0.0408 20 0.0352 22 0.0293 24 0.0236 26 0.0183 28 0.0138 30 0.0101 From the produced results from the table above, the grap illustrates the Rayleigh Distribtuin Density function across the range of wind velocities as calculated. Figure 22 - Incoming Wind Direction on Site of Hotel Project
  • 27.
    Report 5 –Mechanical – Low Carbon and Renewable Technology 23 Figure 23 - Graph showing probability of achieving Wind Speed in proposed site From the produced graph as shown above it can be seem that the range of velcoities calculated for the Wind turbine design vary as the wind velocity ranges from 0 m/s to 30 m/s and the probability of acquiring those velocities. As shown the range has a strong chance of aquring wind energy from a wide range of wind velocities from the mean velocity acquired from IES VE Software. 6.2 Power Output calculation Furthermore the Power output that can be obtained by the Wind energy across these veolicity ranges are as follows. Although to continue the determination of the Power output thaw oud be experienced across the range velocities as outlined, a Wind Turbine system needs to be selected. Therefore as shown below is the Wind Turbine system that has been selected for the Swimming pools requirments as showm below. The wind turbine specification is shown below as follows. Manufactuer – Ghrepower Model – FD21 – 100/12 Rotor Diameter – 21 meters Nuumber of Blades – 3 Working Wind Speed – 3 to 25 m/s Cut in Wind Spped – 3 m/s Rated Wind Speed – 12 m/s Survival Wind Speed – 50 m/s Rated Output Power – 100 kW Maximum Output Power – 118 kW Tower – 36 meters From the selected Wind Turbine as shown above the estimated Power output across the working wind speed as indicated by the Wind Turbine manufactuer data can be be then used to predicit the Power output. This can be achieved by utilising the following equation as follows. 𝑃𝑜𝑤𝑒𝑟𝑜𝑢𝑡𝑝𝑢𝑡 = 𝑃𝑜𝑤𝑒𝑟𝑛𝑜𝑚𝑖𝑛𝑎𝑙 × ( 𝑢2 − 𝑢 𝑐𝑖 2 𝑢 𝑛𝑜𝑚𝑖𝑛𝑎𝑙 2 − 𝑢 𝑐𝑖 2 ) Where: 𝑃𝑜𝑤𝑒𝑟𝑜𝑢𝑡𝑝𝑢𝑡 𝑖𝑠 𝑡𝑜 𝑏𝑒 𝑐𝑎𝑙𝑐𝑢𝑙𝑎𝑡𝑒𝑑 𝑑𝑒𝑝𝑒𝑛𝑑𝑖𝑛𝑔 𝑜𝑛 𝑡ℎ𝑒 𝑣𝑎𝑟𝑖𝑜𝑢𝑠 𝑤𝑖𝑛𝑑 𝑠𝑝𝑒𝑒𝑑𝑠 𝑃𝑜𝑤𝑒𝑟𝑛𝑜𝑚𝑖𝑛𝑎𝑙 ℎ𝑎𝑠 𝑏𝑒𝑒𝑛 𝑝𝑟𝑜𝑣𝑖𝑑𝑒𝑑 𝑏𝑦 𝑡ℎ𝑒 𝑚𝑎𝑛𝑢𝑓𝑎𝑐𝑡𝑢𝑒𝑟𝑠 𝑑𝑎𝑡𝑎 𝑡𝑜 𝑏𝑒 100 𝑘𝑊 𝑢 𝑖𝑠 𝑡ℎ𝑒 𝑟𝑎𝑛𝑔𝑒 𝑜𝑓 𝑤𝑖𝑛𝑑 𝑠𝑝𝑒𝑒𝑑𝑠 𝑐𝑎𝑝𝑎𝑏𝑙𝑒 𝑏𝑦 𝑡ℎ𝑒 𝑊𝑖𝑛𝑑 𝑡𝑢𝑟𝑏𝑖𝑛𝑒 𝑓𝑜𝑟 𝑡ℎ𝑒 𝑃𝑜𝑤𝑒𝑟 𝑜𝑢𝑡𝑝𝑢𝑡 𝑡𝑜 𝑏𝑒 𝑏𝑎𝑠𝑒𝑑 𝑜𝑛 0.0000 0.0100 0.0200 0.0300 0.0400 0.0500 0.0600 0 2 4 6 8 10 12 14 16 18 20 22 24 26 28 30 Probability(f(u)) Wind Speed (m/s) Probabilit y f(u) Figure 24 - Indicative representation of Wind Turbine Technology used in Hotel
  • 28.
    Report 5 –Mechanical – Low Carbon and Renewable Technology 24 𝑢 𝑐𝑖 ℎ𝑎𝑠 𝑏𝑒𝑒𝑛 𝑝𝑟𝑜𝑣𝑖𝑑𝑒𝑑 𝑏𝑦 𝑡ℎ𝑒 𝑚𝑎𝑛𝑢𝑓𝑎𝑐𝑡𝑢𝑒𝑟𝑠 𝑑𝑎𝑡𝑎 𝑡𝑜 𝑏𝑒 3 𝑚/𝑠 𝑢 𝑛𝑜𝑚𝑖𝑛𝑎𝑙 ℎ𝑎𝑠 𝑏𝑒𝑒𝑛 𝑝𝑟𝑜𝑣𝑖𝑑𝑒𝑑 𝑏𝑦 𝑡ℎ𝑒 𝑚𝑎𝑛𝑢𝑓𝑎𝑐𝑡𝑢𝑒𝑟𝑠 𝑑𝑎𝑡𝑎 𝑡𝑜 𝑏𝑒 12 𝑚/𝑠 𝑢 𝑐𝑜 ℎ𝑎𝑠 𝑏𝑒𝑒𝑛 𝑝𝑟𝑜𝑣𝑖𝑑𝑒𝑑 𝑏𝑦 𝑡ℎ𝑒 𝑚𝑎𝑛𝑢𝑓𝑎𝑐𝑡𝑢𝑒𝑟𝑠 𝑑𝑎𝑡𝑎 𝑡𝑜 𝑏𝑒 25 𝑚/𝑠 Therefore from the provided initial data the following table can be produced to estimate the Power output experienced through the range of the wind speeds that the wind turbine sized is capable of as follows. Table 9 - Calculated Power Output dependant on Wind Speed Wind Speed (m/s) Power Output (kW) 0 -6.67 2 -3.70 4 5.19 6 20.00 8 40.74 10 67.41 12 100.00 14 138.52 16 182.96 18 233.33 20 289.63 22 351.85 24 420.00 26 494.07 28 574.07 30 660.00 From the produced table above the power outputs from the range of wind speeds capable from the sized Wind turbine have been analysed and produced certain assumptions which can be made which are aso follows. Firstly the output experieed at wind speeds below 3 m/s show a negative figure due to the limitation of wind speed being 3 m/s where at any wind speeds less than that of 3 m/s the wind turines motor will stop generating power and apply its mechanical brakes to the spinning blades to come to a stand still. Secondly utilising the locations means linear wind speed of 15.49 m/s the power output produced by the Wind Turbine at those speeds are proven to be a reasonable amount however it must be noted that the mean linear wind speed experienced in the proposed location for the project is not the peak wind speed. To create the third assumption made from the results obtained from Table 9 a graph has to be created to illustrate the relation with regards to the Wind Speed and the Power output with another graph line showing the relation with Wind Speed and the probability of acquiring those wind speeds as shown below. Figure 25 - Graph comparing Probability of Wind Speed and corresponding Power Output 0.00 100.00 200.00 300.00 400.00 500.00 600.00 700.00 0.0000 0.0100 0.0200 0.0300 0.0400 0.0500 0.0600 0 2 4 6 8 10 12 14 16 18 20 22 24 26 28 30 PowerOutput(kW) Probability(f(u)) Wind Speed (m/s) Probab ility f(u) Power Output (kW)
  • 29.
    Report 5 –Mechanical – Low Carbon and Renewable Technology 25 The produced graph above illustrates the power output produced across the range of wind speeds capable of the win turbine as well as looking into the probability of those wind speeds being achieved whilst be located in the proposed location for the project. The assumption can be made that the probability peak is around the regions where the wind turbine’s output is at its rated output rate of a 100 kW. It can also be assumed that based on the produced results with regards to the probability of wind speed experienced at the location will favour the power output of the wind turbine up to the stated range of the wind turbine by where if the wind speed goes past 25 m/s the mechanica brakes will be applied to the spinning rotor blades and no more electricity will be generated for protection of the equipment of the Wind Turbine system due to high wind speeds. 6.3 Total Energy Output Calculation Following the determination of how the power output will depend on the amount of wind speed produced in the porposed location and how often. the average ppower produced at a particular wind speed over a period of time will need to be calculated. The calculation process for aquring this value is demonstatred as shown below. 𝐴𝑣𝑟𝑎𝑔𝑒 𝑃𝑜𝑤𝑒𝑟 𝑂𝑢𝑡𝑝𝑢𝑡 @ 𝑢 = 𝑃𝑜𝑤𝑒𝑟 𝑂𝑢𝑡𝑝𝑢𝑡 @ 𝑢 × 𝑃𝑟𝑜𝑏𝑎𝑏𝑖𝑙𝑖𝑡𝑦 𝑓(𝑢) As shown above the calculation process for determing the average power output for a particular wind speed has been given. The same calculation process is required to determine the Average Energy requirement where the calculation process for acquiring this value is shown as follows below. 𝐴𝑣𝑟𝑎𝑔𝑒 𝐸𝑛𝑒𝑟𝑔𝑦 @ 𝑢 = 𝐴𝑣𝑒𝑟𝑎𝑔𝑒 𝑃𝑜𝑤𝑒𝑟 𝑂𝑢𝑡𝑝𝑢𝑡 @ 𝑢 × 8760 ℎ𝑜𝑢𝑟𝑠 Therefore applying both equations to the originally acquired values calculated previously the table below summaries the new calculated values for the average power output and delivered energy output for a particular wind speed as shown below. Table 10 - Calculation of Total Energy Delivered for Wind Turbine Technology Wind Speed (m/s) Power Output (kW) Probability f(u) Average Power Output (P × f(u)) Delivered Energy (kWh) 0 -6.67 0.0000 0.000 0.00 2 -3.70 0.0131 0.000 0.00 4 5.19 0.0252 0.130 1142.83 6 20.00 0.0353 0.706 6187.76 8 40.74 0.0429 1.748 15315.91 10 67.41 0.0476 3.209 28111.28 12 100.00 0.0494 4.937 43249.49 14 138.52 0.0485 6.715 58822.02 16 182.96 0.0454 8.307 72772.81 18 233.33 0.0408 9.512 83328.74 20 289.63 0.0352 10.197 89321.42 22 351.85 0.0293 10.313 90339.96 24 420.00 0.0236 9.898 86706.21 26 494.07 0.0183 9.054 79309.46 28 574.07 0.0138 7.918 69363.83 30 660.00 0.0101 6.639 58156.38 89.284 782128.09 From the produced table as shown above two assumptions can be made which are as follows.  Average Power – 89.284 kW  Total Energy – 782128.09 kWh Using the acquired values produced as stated above compared to the required power load for the swimming pool space’s electrical requirements it shows that the wind turbine technology is over sized for the swimming pool electrical requirmeents. Therefore the generated power will seem to be just stored within the off grid battery systems until required. However the Wind turbine will be designed to be able to produce the required electrtical requirements for he swimming pool space as well as supplying the top up requirement for the immersion heater to supply the hot water for the swimming pool space. The supply requirmeents for the Immersion heater will be done by diverging the supply to the battery with the aid of a Bi-directional Utility meter which will control the amount of electrical supply being supplied into the Immersion heater.
  • 30.
    Report 5 –Mechanical – Low Carbon and Renewable Technology 26 6.4 Off Grid Battery Sizing Now that the final inverters have been confirmed for both selections the corresponding battery sizing will need to be conducted. The stored AC Curent within the Battery will be utlisied by the Swimming Pools requirements. However if the Swimming Pools requirmeents are not required in such condition as the occupation hours have past and there is still AC Current being stored by the ongoing Solar Gain collection by the PV Panels. Then that AC Currrent will be stored by the batteries for later use as of when the Swimming Pools requirements are needed. The swimming pools requirements in particular is to feed the heating requirements for the pool space via an immersion heater which will be sized later on in this report. Therefore the batteries will be providing the required AC Current to the immersion heaters alongside the Boilers which will be working as top up to maintain peak periods where the PV Design will not be sufficient in providing the required heating for the pools heating requirements. To size the required battery, the inverter rated power will be used to size this. Using manufactuers data this can be determined to size the appropriate Battery storage system. The battery sized is based on a diversity factor of the required inverter rated power as it is important to undersize the required batter size. This is to not size the battery at the PV Panel design’s peak load as it has been confirmed from the IES VE Solar Path Analysis that the solar gain experienced will not be at peak levels during the day and more importantly every day. Therefore by underszing the battery this enables the battery to fully utlise its capacity of storing the AC Current. This will benefit the battery cells as it will prevent the battey from reducing its life expectancy due to not fully utilising the battery cells. Figure 26 shows an indicative battery that will be used in the PV Panel design. This battery system is known as an Off Grid System as the AC Current generated is not being directly supplied into the Swimming Pools requirements and supply back into the National Grid. However is being stored in the Off Grid Battery system to be used by the Swimming Pool Space when required. Figure 26 - Example of Off Grid Battery Bank System to be used in Project (fusionenergy.co.uk) It should be noted that the renewable tehnology included in the design for the Swimming pool space will be Photovltaic and Wind Turbine technology where wind turbine technology produced AC Current so therefore will need to be converted into DC current before hand and stored. For when the DC Current stored equired it will be converted back into AC Current to supply into the swimming pools requirements. This therefore produces many issues with regards to the effcency of the conversion of the DC to AC to DC current changes as the power requirements are generated. Thererore an alternative solution will also be analysed as follows to resolve this efficiency matter with regards to supplying the swimming pools electrical requirementrs.
  • 31.
    Report 5 –Mechanical – Low Carbon and Renewable Technology 27 7. RENEWABLE TECHNOLGY APPLICABILITY The purpose of this report was to analyse two different renewable systems applicability to the Swimming Pool Space. This was acquired by firstly utilising a Photovoltaic System to supply the Pool space with the Hot Water by supplying the Immersion heater which generates the hot water with the generated AC Current from the collected Solar Gain as well as the top up requirement from the Top up boilers to supply the hot water for the pool space. The second renewable system is the Wind Turbine system which has been designed to produce the electricity requirments for the Swimming Pool Space. This is done by generating the DC Current by the motion of the rotars on the turbine which is then converted into AC Current by the inverters then stored into the Off Grid Batteries. At the batteries a supply feed of AC Current will provide the requirements of the Swimming pools electrical requirmeents. Th eexisting electrical generator supplying the electrical requirmeents of the swimming pool space will remain as it will act as a top up system for when the wind turbine system does not provide sufficient electrical output for the requiremnts of the swimming pool space. The benfits of using these systems is to minimise the use of the Boilers and the electrical generator system in providing the swimming pool space’s energy requirements and to utlise renewable technology as much as possible as an alternative. Instead of using fossil fuel based systems and by using renewable technologies to supply the requiremnts of the space results in a much more greener building. The existing boiler and electrical generator will remain the same size as sized previously. This is because the aim of sizing the renewable technologies was to run the existing traditional systesm on part load so as to not provide as much carbon emissions as before. Therefore with the renewable tecologies sized this provides a carbon saving by monimising the use of the boiler and electrical generator when supplying the requirements for the Swimming Pool space. Both the Photoovltaic Panel system and Wind Turbine system have been appraised through the analysis of both technologies within this report has proven that point. The two systems are able to work alongside each other in supplying the Swimming Pool requirement of Hot water supply and Electrical requirmeents. In order to achieve a robust and greater efficiency in the systems as well as the maintenance and overall costs of the whoe systemapplied. Some of the equipment used in both design can be combined into one system. A representation of this is the use of an Energy Storage equipment. To size the required energy storage system the calculated wind turbine and Photovoltaic Panel system output must be confirmed as calculated within this report. The final output values have been summarised as shown below.  Photovoltaic Panel System = 11.865 kW  Wind Turbine System – 89.284 kW  Total Energy Storage Requiremnt – 101.149 kW From the produced summary of requirments for the renewable tehnoligies the following Energy Storage equipment has been specified as shown below. Figure 27 - Example of Energy Storage equipment to be used for Hotel Project (energystoragesystem.co.uk) The sized energy storage system is based on the total energy storage system requirement from both renewable techlogies. The selected Energy Storage system will be responsible for converting the DC Current generated by the renewable technologies and storing the AC Current until required for use by the Swimming Pools Hot water and electrical requirements. Combining the two inverters and off grid battiery systems into one whole system beenfits the design of the overall system as it reduces the overall system error as one system passes through the next till it reaches the supply source. On the following two pages are illustrated diagrams showing how the Photoovltaic Panels and the Wind Turbine System working along side the existing sized Boiler and Electrical generator with the original inverter, off grid and meter strategy layout as well as the improved final strategy with the Energy Storage System being responsible on the conversion from DC to AC current and storage of AC Current till required for Swimming Pool Space requirements as follows.
  • 32.
    Report 5 –Mechanical – Low Carbon and Renewable Technology 28 Top up Boiler Supply to Swimming Pool Electrical Requirements Supply to Swimming Pool Hot Water Heating Requirements Electrical Generator DC – AC Inverter Battery Meter DC – AC Inverter Battery Meter Immersion Heater Bi-Directional Utility Meter
  • 33.
    Report 5 –Mechanical – Low Carbon and Renewable Technology 29 Top up Boiler Supply to Swimming Pool Electrical Requirements Supply to Swimming Pool Hot Water Heating Requirements Electrical Generator Energy Storage System Immersion Heater
  • 34.
    Report 5 –Mechanical – Low Carbon and Renewable Technology 30 From the finalised schematics produced, this shows the renewable technologies working together in producing the requirements of the Swimming pool as stated earlier in this report. Furthermore the sized equipment will need analysis to produce an assumption as to whether the sized equipment will provide any excess amounts of power at any given point during the year as sized above. Therefore the following table outlines the final produced output annually and the requirements of the swimming pool design. Table 11 - Swimming Pool Electrical Requirements Swimming Pool Requirmeents Electrical Load (kW) Hot Water Requireents 38.700 Electrical Requirements 9.160 From the produced requirements in Table 11 the table below outlines the produced electrical load by the renewable technologies as follows Table 12 - Renewable Technologies Electrical Output Renewable Technology Electrical Load (kW) Photovoltaic Panel Design 11.865 Wind Turbine Design 89.284 From the two produced tables as shown above this shows that the total renewable technologies electrical load produced satisfies the electrical requirements of the swimming pool design although wit the sized battery system to go with the appraised renewable technology system the electrical load produced by the renewable technology will not be wasted as such it will be stored for when it is required by the swimming pools requirements. Figure 28 - Energy prices within the United Kingdom based on UKPower.com
  • 35.
    Report 5 –Mechanical – Low Carbon and Renewable Technology 31 7.1 Redesign of Renewable Technologies Furthermore when reffering to the research carried out from the analysis of the selected literature articles to review, the point came across that electricity is much of a carbon emitting energy source than that of gas. This point has been proven from the produced price list of known energy sources within the United Kingdom for 1 kWh of energy as shown in Figure 28 furthermore it seems unnecessary to offset the gas requirements in the building however more so beneficial to offset the buildings electrical requirements as electricity is the most expensive energy requirement of the building. This point can be proven further by the produced graph in Figure 29 where it shows the annual and estimated world population and energy demand. Analysing this graph shows that the wolds electricity demand is forever increasing. Therefore the use of renewable technologies such as what has been designed for this project is highly beneficial for not just the projects renewable energy source but also providing a sustainable solution to the global energy crisis. Figure 29 - Annual and estimated world population and energy demand (A.M.Omer 2007) Therefore the final decision has been made to utlise the renewable energy technolgigies sized for this project to offset the electrical requirements of the whole project and not just the swimming pool space. Table 13 provides the total electrical requirements of the building and the total energy output produced by the renewable technologies with the final oversizing or undersizing of energy provision as shown below. Table 13 - Calculation of Renewable Technology Oversize Total Building Electrical Requirement (kW) 787.356 Total Renewable Energy Technology Electrical Output (kW) 101.149 Percentage Oversize (%) -87.15 7.2 Payback Period Calculation Following the produced table above, the assumption can be made that the renewable technogy sized will not be able to offset the total electrical load of the building however will be able to offset 12.85 % Of the electrical requirements. The following calculation process will provide an indicative payback period for applying the Photovoltaic System and Wind Turbine Technology into the Project as follows.  Phtovoltaic System Cost – £ 150,000  Wind Turbine System Cost – £ 255,000  Renewable Technology Equipment Cost - £ 25,750  Total Installation Cost - £ 430,750 Therefore from the provided initial installation costs as acquired from the renewable technoigies respected manufactueres the following calculation process can determine the overall payback period as follows. Firstly the annual power displaced can be determined as follows. 𝑨𝒏𝒏𝒖𝒂𝒍 𝑪𝒐𝒔𝒕 𝒐𝒇 𝑷𝒐𝒘𝒆𝒓 𝑫𝒊𝒔𝒑𝒍𝒂𝒄𝒆𝒅 = 𝑨𝒏𝒏𝒖𝒂𝒍 𝑬𝒏𝒆𝒓𝒈𝒚 𝑪𝒓𝒆𝒂𝒕𝒆𝒅 × 𝑬𝒍𝒆𝒄𝒕𝒓𝒊𝒄𝒊𝒕𝒚 𝒄𝒐𝒔𝒕 Where: 𝐴𝑛𝑛𝑢𝑎𝑙 𝐶𝑜𝑠𝑡 𝑜𝑓 𝑃𝑜𝑤𝑒𝑟 𝐷𝑖𝑠𝑝𝑙𝑎𝑐𝑒𝑑 𝑖𝑠 𝑡𝑜 𝑏𝑒 𝑐𝑎𝑙𝑐𝑢𝑙𝑎𝑡𝑒𝑑 𝐴𝑛𝑛𝑢𝑎𝑙 𝐸𝑛𝑒𝑟𝑔𝑦 𝐶𝑟𝑒𝑎𝑡𝑒𝑑 ℎ𝑎𝑠 𝑏𝑒𝑒𝑛 𝑐𝑎𝑙𝑐𝑢𝑙𝑎𝑡𝑒𝑑 𝑡𝑜 𝑏𝑒 886.065 𝑀𝑊ℎ 𝐸𝑙𝑒𝑐𝑡𝑟𝑖𝑐𝑖𝑡𝑦 𝑐𝑜𝑠𝑡 𝑡𝑜 𝑏𝑒 15.4 𝑝𝑒𝑛𝑐𝑒 𝑝𝑒𝑟 𝑘𝑊ℎ 𝑏𝑎𝑠𝑒𝑑 𝑜𝑛 𝑎𝑞𝑢𝑖𝑟𝑒𝑑 𝑣𝑎𝑙𝑢𝑒 𝑓𝑟𝑜𝑚 𝑈𝐾𝑃𝑜𝑤𝑒𝑟. 𝑐𝑜𝑚
  • 36.
    Report 5 –Mechanical – Low Carbon and Renewable Technology 32 Therefore: 𝐴𝑛𝑛𝑢𝑎𝑙 𝐶𝑜𝑠𝑡 𝑜𝑓 𝑃𝑜𝑤𝑒𝑟 𝐷𝑖𝑠𝑝𝑙𝑎𝑐𝑒𝑑 = (886.065 103 ) × (15.4 × 10⁻²) 𝑨𝒏𝒏𝒖𝒂𝒍 𝑪𝒐𝒔𝒕 𝒐𝒇 𝑷𝒐𝒘𝒆𝒓 𝑫𝒊𝒔𝒑𝒍𝒂𝒄𝒆𝒅 = £ 𝟏𝟑𝟔, 𝟒𝟓𝟒. 𝟎𝟏 From the produced Annual Cost of Power displaced, the cost of maintenance can be calculated as follows. 𝑨𝒏𝒏𝒖𝒂𝒍 𝑪𝒐𝒔𝒕 𝒐𝒇 𝑴𝒂𝒊𝒏𝒕𝒆𝒏𝒂𝒏𝒄𝒆 = 𝑨𝒏𝒏𝒖𝒂𝒍 𝑬𝒏𝒆𝒓𝒈𝒚 𝑪𝒓𝒆𝒂𝒕𝒆𝒅 × 𝑬𝒍𝒆𝒄𝒕𝒓𝒊𝒄𝒊𝒕𝒚 𝒄𝒐𝒔𝒕 Where: 𝐴𝑛𝑛𝑢𝑎𝑙 𝐶𝑜𝑠𝑡 𝑜𝑓 𝑀𝑎𝑖𝑛𝑡𝑒𝑛𝑎𝑛𝑐𝑒 𝑖𝑠 𝑡𝑜 𝑏𝑒 𝑐𝑎𝑙𝑐𝑢𝑙𝑎𝑡𝑒𝑑 𝐴𝑛𝑛𝑢𝑎𝑙 𝐸𝑛𝑒𝑟𝑔𝑦 𝐶𝑟𝑒𝑎𝑡𝑒𝑑 ℎ𝑎𝑠 𝑏𝑒𝑒𝑛 𝑐𝑎𝑙𝑐𝑢𝑙𝑎𝑡𝑒𝑑 𝑡𝑜 𝑏𝑒 886.065 𝑀𝑊ℎ 𝑀𝑎𝑖𝑛𝑡𝑒𝑛𝑎𝑛𝑐𝑒 𝑐𝑜𝑠𝑡 𝑡𝑜 𝑏𝑒 1 𝑝𝑒𝑛𝑐𝑒 𝑝𝑒𝑟 𝑘𝑊ℎ 𝑏𝑎𝑠𝑒𝑑 𝑜𝑛 𝑎𝑞𝑢𝑖𝑟𝑒𝑑 𝑣𝑎𝑙𝑢𝑒 𝑓𝑟𝑜𝑚 𝑀𝑎𝑛𝑢𝑓𝑎𝑐𝑡𝑢𝑒𝑟𝑠 Therefore: 𝐴𝑛𝑛𝑢𝑎𝑙 𝐶𝑜𝑠𝑡 𝑜𝑓 𝑀𝑎𝑖𝑛𝑡𝑒𝑛𝑎𝑛𝑐𝑒 = (886.065 103 ) × (1 × 10⁻²) 𝑨𝒏𝒏𝒖𝒂𝒍 𝑪𝒐𝒔𝒕 𝒐𝒇 𝑴𝒂𝒊𝒏𝒕𝒆𝒏𝒂𝒏𝒄𝒆 = £ 𝟖, 𝟖𝟔𝟎. 𝟔𝟓 From the calculated maintenance cost calculated above, the net annual cost savig can be determined as follows. 𝑨𝒏𝒏𝒖𝒂𝒍 𝑵𝒆𝒕 𝑺𝒂𝒗𝒊𝒏𝒈 = 𝑨𝒏𝒏𝒖𝒂𝒍 𝑪𝒐𝒔𝒕 𝒐𝒇 𝑷𝒐𝒘𝒆𝒓 𝑫𝒊𝒔𝒑𝒍𝒂𝒄𝒆𝒅 − 𝑨𝒏𝒏𝒖𝒂𝒍 𝑪𝒐𝒔𝒕 𝒐𝒇 𝑴𝒂𝒊𝒏𝒕𝒆𝒏𝒂𝒏𝒄𝒆 Where: 𝐴𝑛𝑛𝑢𝑎𝑙 𝑁𝑒𝑡 𝑆𝑎𝑣𝑖𝑛𝑔 𝑖𝑠 𝑡𝑜 𝑏𝑒 𝑐𝑎𝑙𝑐𝑢𝑙𝑎𝑡𝑒𝑑 𝐴𝑛𝑛𝑢𝑎𝑙 𝐶𝑜𝑠𝑡 𝑜𝑓 𝑃𝑜𝑤𝑒𝑟 𝐷𝑖𝑠𝑝𝑙𝑎𝑐𝑒𝑑 ℎ𝑎𝑠 𝑏𝑒𝑒𝑛 𝑐𝑎𝑙𝑐𝑢𝑙𝑎𝑡𝑒𝑑 𝑡𝑜 𝑏𝑒 £ 136,454.01 𝐴𝑛𝑛𝑢𝑎𝑙 𝐶𝑜𝑠𝑡 𝑜𝑓 𝑀𝑎𝑖𝑛𝑡𝑒𝑛𝑎𝑛𝑐𝑒 ℎ𝑎𝑠 𝑏𝑒𝑒𝑛 𝑐𝑎𝑙𝑐𝑢𝑙𝑎𝑡𝑒𝑑 𝑡𝑜 𝑏𝑒 £ 8,860.65 Therefore: 𝐴𝑛𝑛𝑢𝑎𝑙 𝑁𝑒𝑡 𝑆𝑎𝑣𝑖𝑛𝑔 = 136454.01 − 8860.65 𝑨𝒏𝒏𝒖𝒂𝒍 𝑵𝒆𝒕 𝑺𝒂𝒗𝒊𝒏𝒈 = £ 𝟏𝟐𝟕, 𝟓𝟗𝟑. 𝟑𝟔 From the determined net saving from utilising the renewable systems used in the Hotel project, the fina payback period can now be determined by using the following calculation process as follows. 𝑷𝒂𝒚𝒃𝒂𝒄𝒌 𝑷𝒆𝒓𝒊𝒐𝒅 = 𝑰𝒏𝒊𝒕𝒊𝒂𝒍 𝑪𝒐𝒔𝒕 𝒐𝒇 𝑹𝒆𝒏𝒆𝒘𝒂𝒃𝒍𝒆 𝑻𝒆𝒄𝒉𝒏𝒐𝒍𝒐𝒈𝒊𝒆𝒔 𝑨𝒏𝒏𝒖𝒂𝒍 𝑵𝒆𝒕 𝑺𝒂𝒗𝒊𝒏𝒈 Where: 𝑃𝑎𝑦𝑏𝑎𝑐𝑘 𝑃𝑒𝑟𝑖𝑜𝑑 𝑖𝑠 𝑡𝑜 𝑏𝑒 𝑐𝑎𝑙𝑐𝑢𝑙𝑎𝑡𝑒𝑑 𝐼𝑛𝑖𝑡𝑖𝑎𝑙 𝐶𝑜𝑠𝑡 𝑜𝑓 𝑅𝑒𝑛𝑒𝑤𝑎𝑏𝑙𝑒 𝑇𝑒𝑐ℎ𝑛𝑜𝑙𝑜𝑔𝑖𝑒𝑠 ℎ𝑎𝑠 𝑏𝑒𝑒𝑛 𝑐𝑎𝑙𝑐𝑢𝑙𝑎𝑡𝑒𝑑 𝑡𝑜 𝑏𝑒 £ 430,750 𝐴𝑛𝑛𝑢𝑎𝑙 𝑁𝑒𝑡 𝑆𝑎𝑣𝑖𝑛𝑔 ℎ𝑎𝑠 𝑏𝑒𝑒𝑛 𝑐𝑎𝑙𝑐𝑢𝑙𝑎𝑡𝑒𝑑 𝑡𝑜 𝑏𝑒 £ 127,593.36 Therefore: 𝑃𝑎𝑦𝑏𝑎𝑐𝑘 𝑃𝑒𝑟𝑖𝑜𝑑 = 430750 127593.36 𝑷𝒂𝒚𝒃𝒂𝒄𝒌 𝑷𝒆𝒓𝒊𝒐𝒅 = 𝟑. 𝟑𝟖 𝒚𝒆𝒂𝒓𝒔 As calculated above to apply the reneable technology to the Hotel building, the initial costs applied will be paid back to the client within the next 3.5 years which from then on the client will continue to save on the renewable technology system designed which is a rather large costs effective system being applied. Therefore to summarise this renewable technology appraisal for the Hotel project the final schematic as follows provides an iddicative illustration of how the apprased reneewabel technology will feed the Hotel project’s electrical requirements.
  • 37.
    Report 5 –Mechanical – Low Carbon and Renewable Technology 33 Supply to Swimming Pool Electrical Requirements Electrical Generator located in Swimming Pool Plant Room for Swimming Pool Energy Storage System Electrical Generator located in Electrical Plant Room for Hotel Supply to Swimming Pool Electrical Requirements Hotel Consumer Unit Swimming Pool Consumer Unit
  • 38.
    Report 5 –Mechanical – Low Carbon and Renewable Technology 34 8. DRAWINGS 8.1 Renewable Technology Hotel Integrated System Schematic (Full Size A1 Drawing Available)
  • 39.
    Report 5 –Mechanical – Low Carbon and Renewable Technology 35 9. FURTHER DESIGN CONSIDERATIONS Following the completion of the Low carbon and renewable technology design appraisal to the Hotel project, the Photovoltaic and Wind Turbine technology designed to provide the required electrical requirements to Hotel whilst providing cost savings to the client after a small payback period as calculated above within this report. Furthermore, the initial requirements for the renewable technologies were changed due to the requirements initially designed for does not offset the greatest energy supply cost of the building which turned out to be Electricity instead of Gas which in comparison is a much cheaper use of fuel with much less carbon emissions generated as outlined by UKPower.com. To improve the renewable technology design, more renewable technology will be required to be designed to completely offset the electrical requirements of the building, which is the biggest fuel supply cost as previously discussed. This will ultimately improve the buildings carbon ratings and be seen as Hotel building with a renewable technology system, which can supply its own energy requirements as supply other applications around.
  • 40.
    Report 5 –Mechanical – Low Carbon and Renewable Technology 36 10. BIBLIOGRAPHY Assiciation, E. N. (2012). Engineering Recomendations G83. Energy Networks Association . Cibse Guide A. (2006). CIBSE. Guide to the installation of Photovoltaic Systems. (2012). ECA. Hyundai Solar Module RG-Series Data Sheet. (2015). Hyundai Solar Module. Mcglen, S. (2015). Renewable Systems Part 3. Northumbria University. McGlen, S. (2015). Renewable Systems Part 4. Northumbria University. McGlen, S. (2015). Renewable Systems Part 5. Northumbria University. Pennycook, K. (2008). The Illustrated Guide to Renewable Technologies. BSRIA. SMA. (2015). Sunny Boy 1.5/2.5 Data Sheet. SMA Solutions. Solution, R. E. (2016). Energy Storage System. Renewable Energy Solution.
  • 41.
    Report 5 –Mechanical – Low Carbon and Renewable Technology 37 11. APPENDICES 11.1 Photovoltaic Panel Manufacture Data
  • 42.
    Report 5 –Mechanical – Low Carbon and Renewable Technology 38 11.2 Inverter Manufacture Data
  • 43.
    Report 5 –Mechanical – Low Carbon and Renewable Technology 39 11.3 Wind Turbine Manufacture Data
  • 44.
    Report 5 –Mechanical – Low Carbon and Renewable Technology 40 11.4 Energy Storage System Manufacture Data