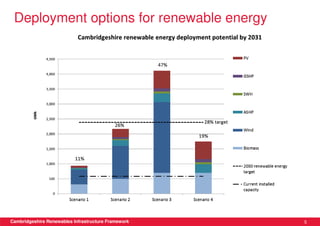
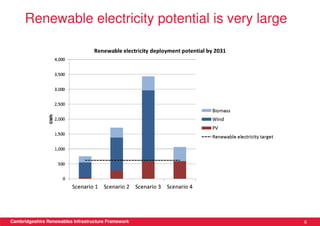
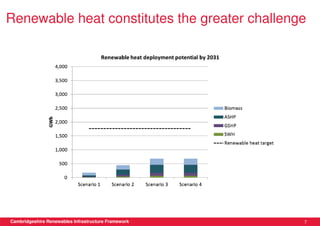
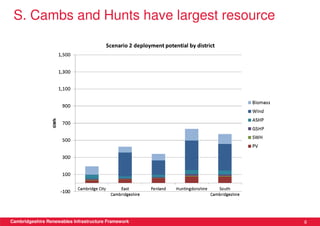
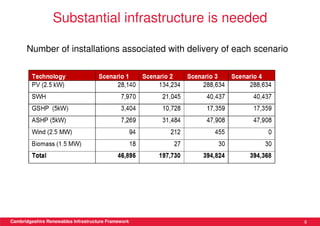
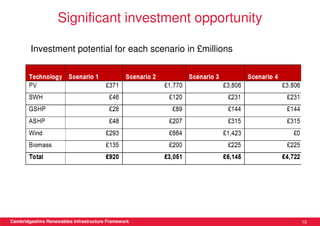
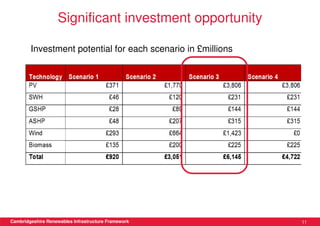
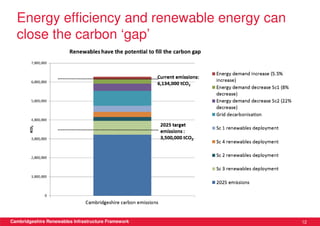
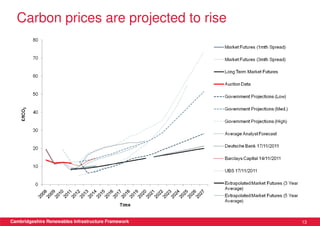
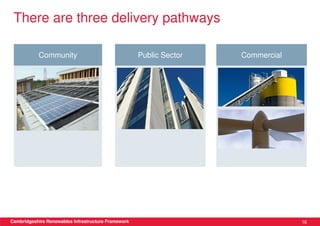
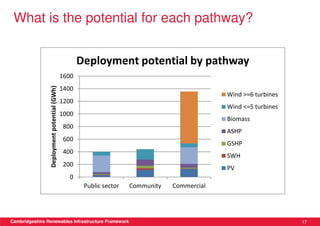
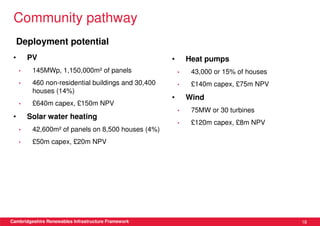
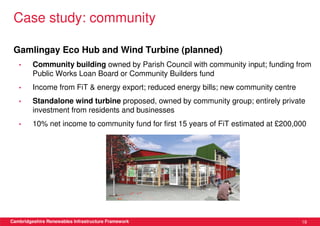
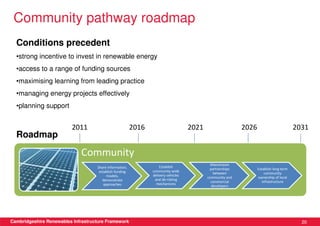
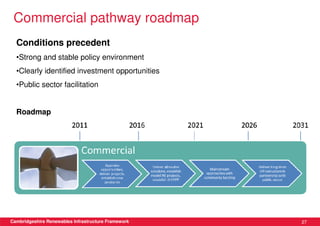
This document discusses renewable energy potential and deployment scenarios in Cambridgeshire, England. It finds that Cambridgeshire has significant potential for renewable electricity and heat, especially from solar, biomass, heat pumps, and wind. Modeling four scenarios, the medium to high scenarios could deliver UK renewable energy and carbon targets by 2031, representing £3-6 billion in investment potential. Three primary delivery pathways are examined: public sector, community, and commercial, with community having potential from solar, heat pumps, wind, and solar water heating totaling hundreds of millions of pounds in capital expenditures.

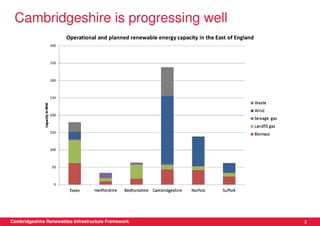
![Modelling renewable energy deployment potential
Scenario 4
Scenario 1 Scenario 2 Scenario 3 (high without
Inputs (low) (medium) (high) wind)
Discount rate 9% 7% 6% 6%
DECC - 'high DECC - 'high
Energy price DECC - 'low' DECC - 'high' high' energy high' energy
[1]
energy prices energy prices prices prices
current rates current rates
(FIT/ RHI (FIT/ RHI
designed to designed to
give fixed give fixed
return & will return & will
Financial lower than adjust to adjust to
incentives current tariff energy energy
(FIT/RHI) rates current rates prices) prices)
Project
deployment
rate
(wind/biomas 30% (0% for
s/EfW) 8% 15% 30% wind)
Green policy
support (for
building
integrated
technologies) Low Medium High High
Cambridgeshire Renewables Infrastructure Framework 4](https://image.slidesharecdn.com/criffinalpresentation191211finalissued090112-120112034433-phpapp01/85/CRIF-Final-Presentation-Camco-5-320.jpg)