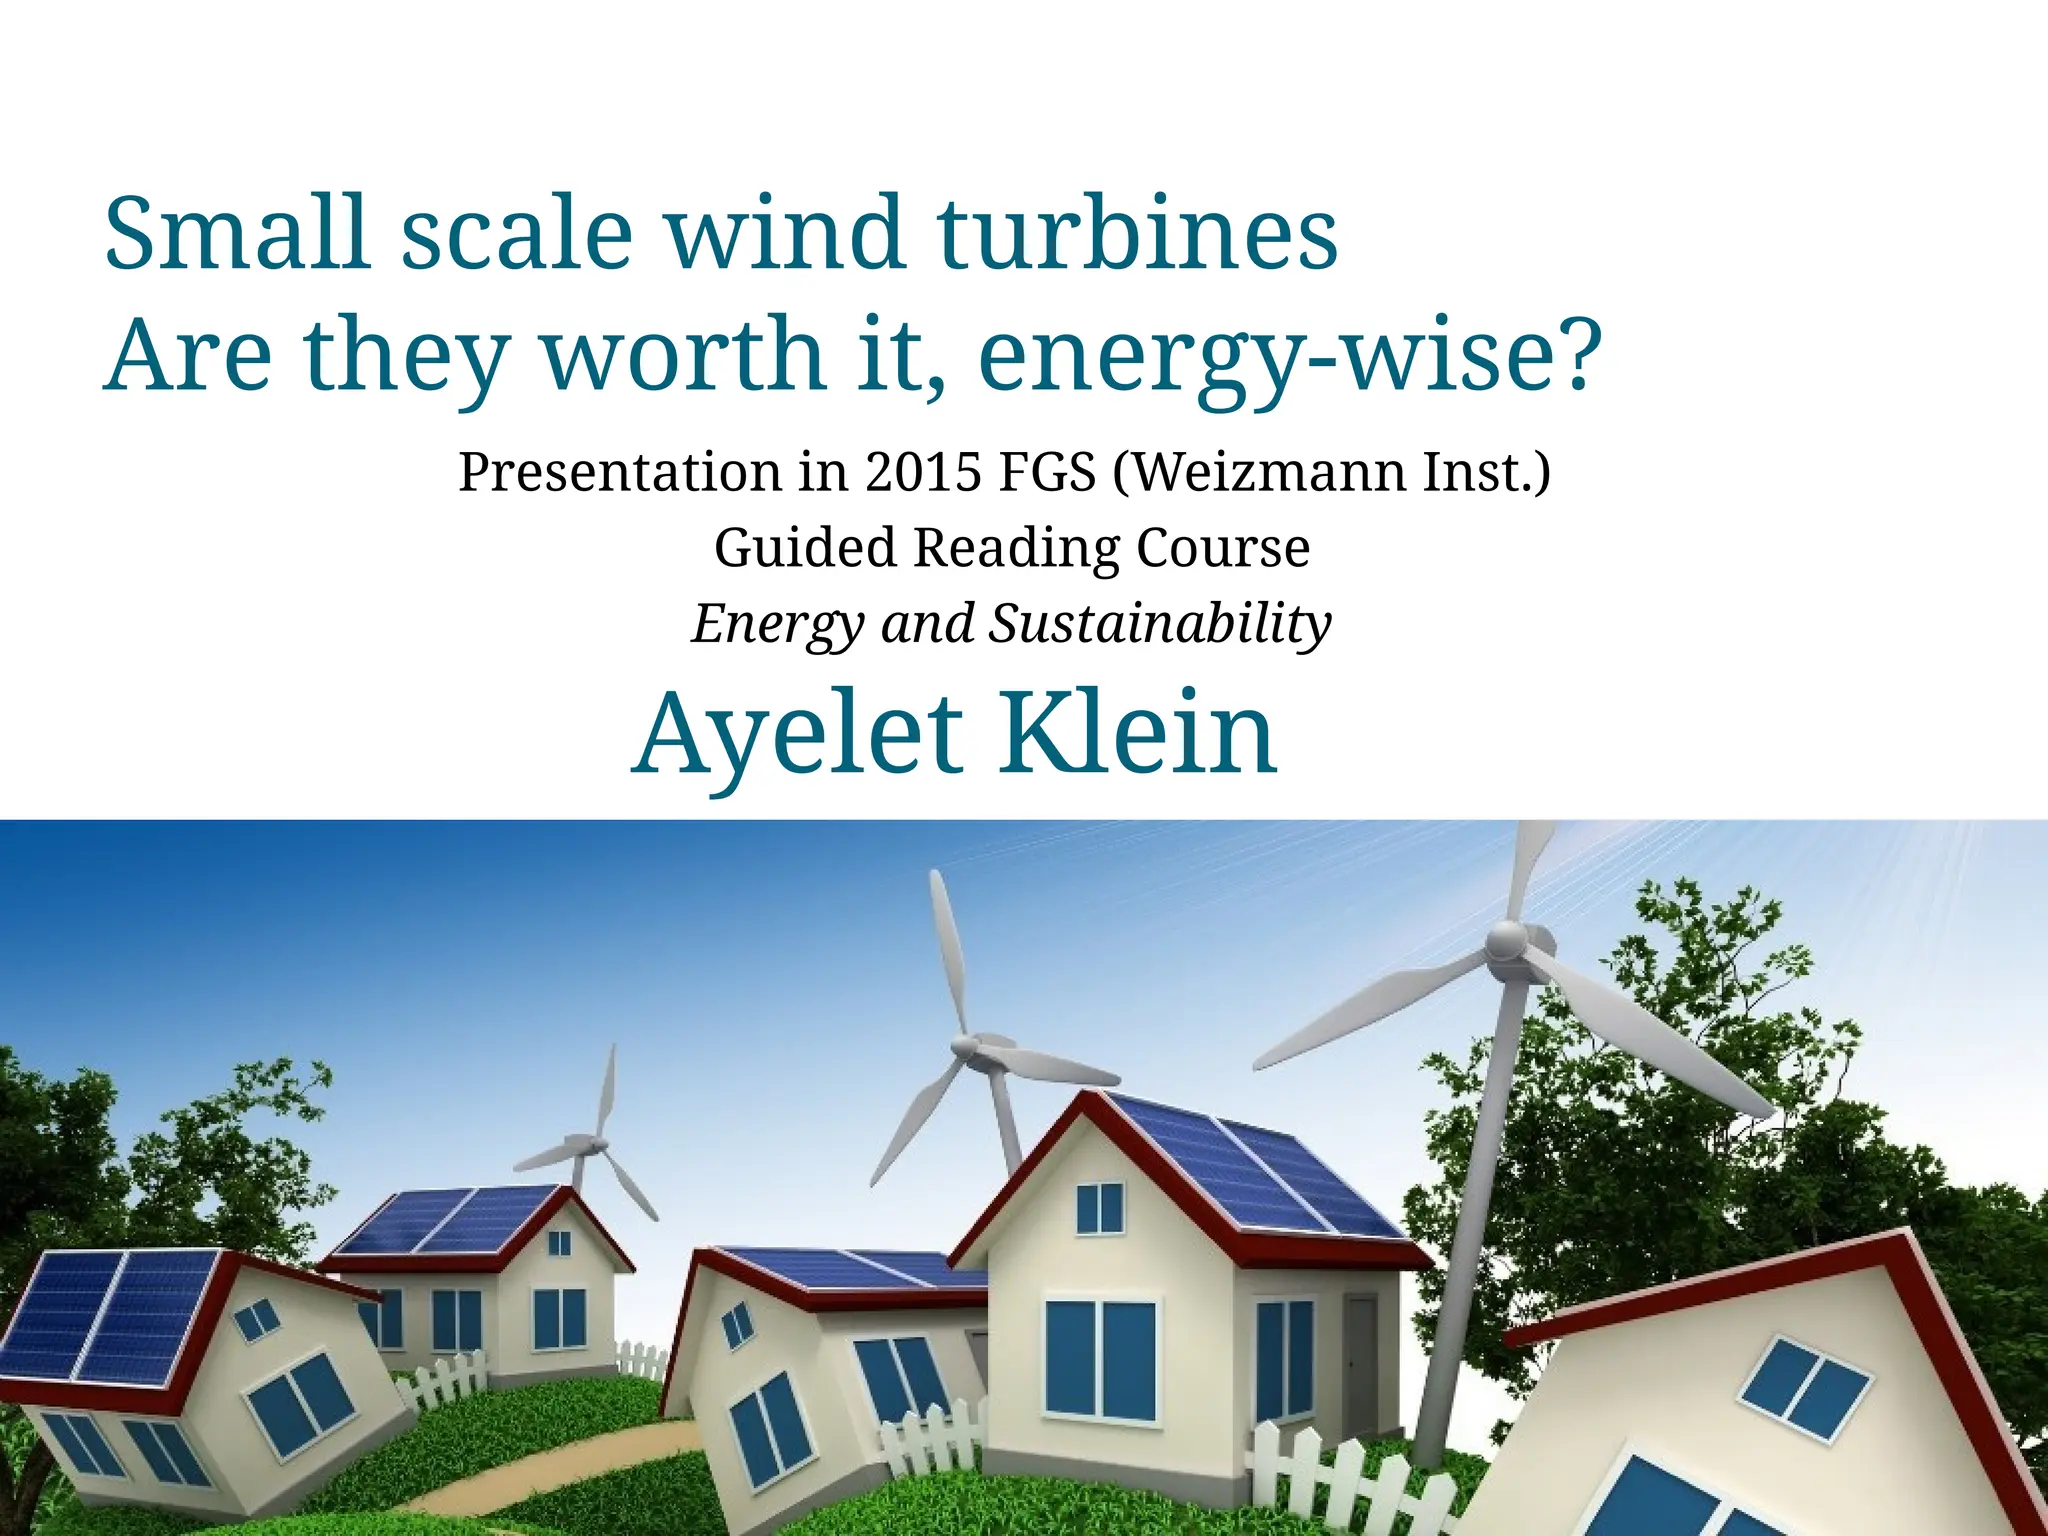
Small Scale Wind Turbines Document for basic understanding
1.
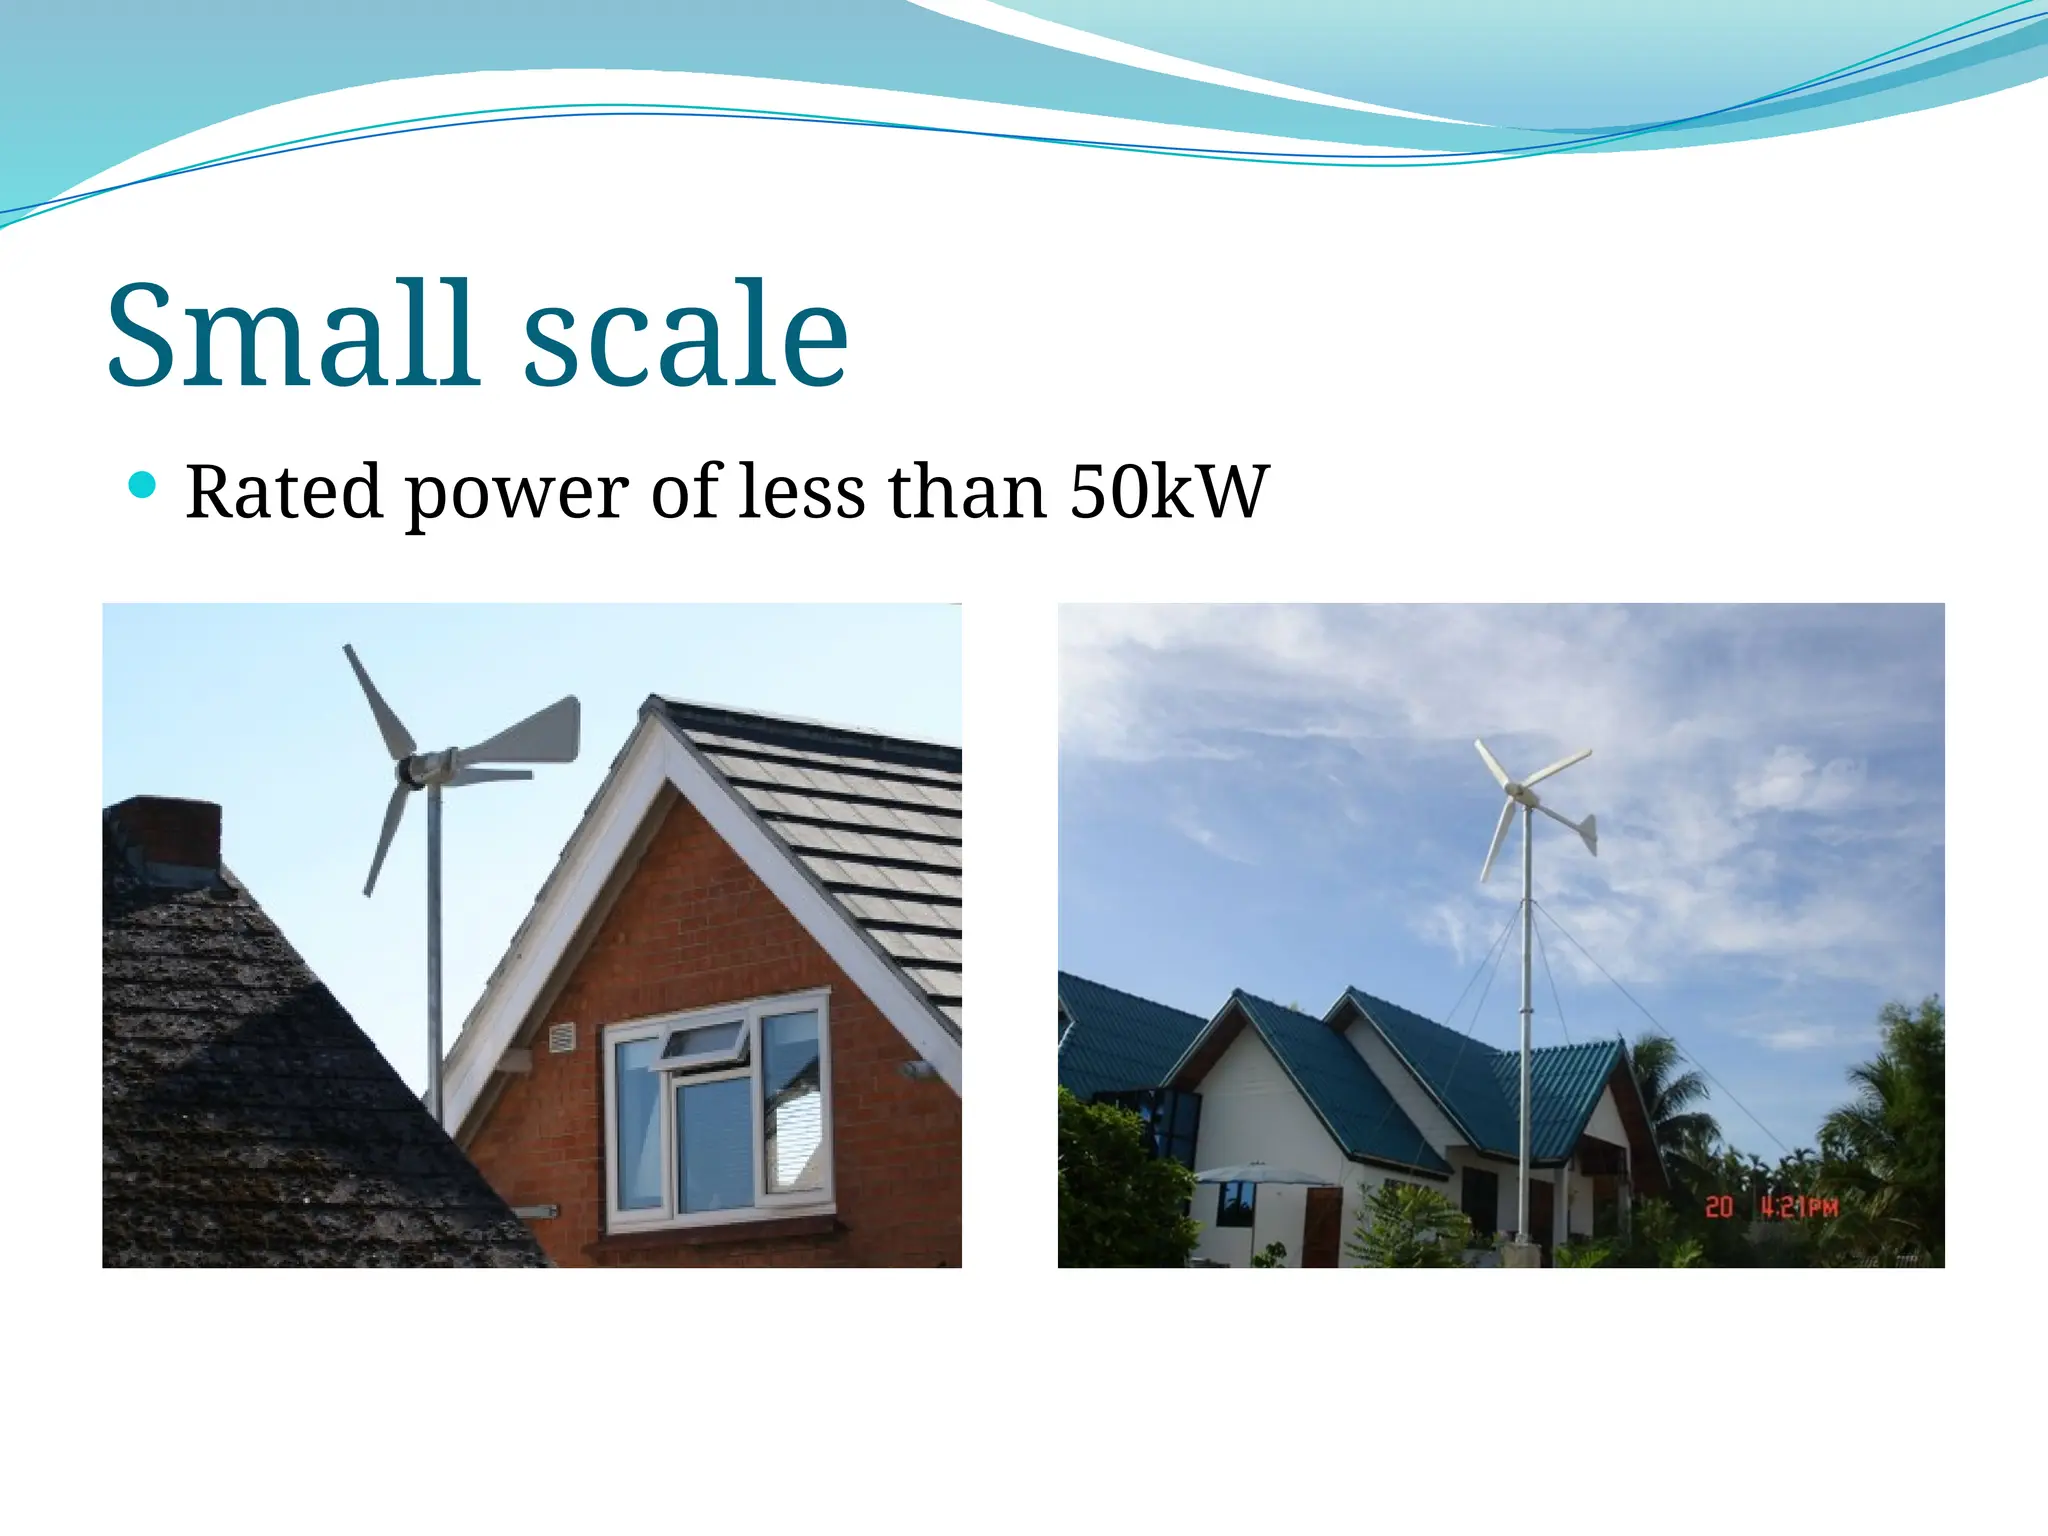
Small scale windturbines
Are they worth it, energy-wise?
Ayelet Klein
Presentation in 2015 FGS (Weizmann Inst.)
Guided Reading Course
Energy and Sustainability
2.
History
Persian drag
machine design,
usedfor water
pumping and grain
grinding Water pumping
machines on the
Island of Crete
An early mill on the
Mediterranean coast
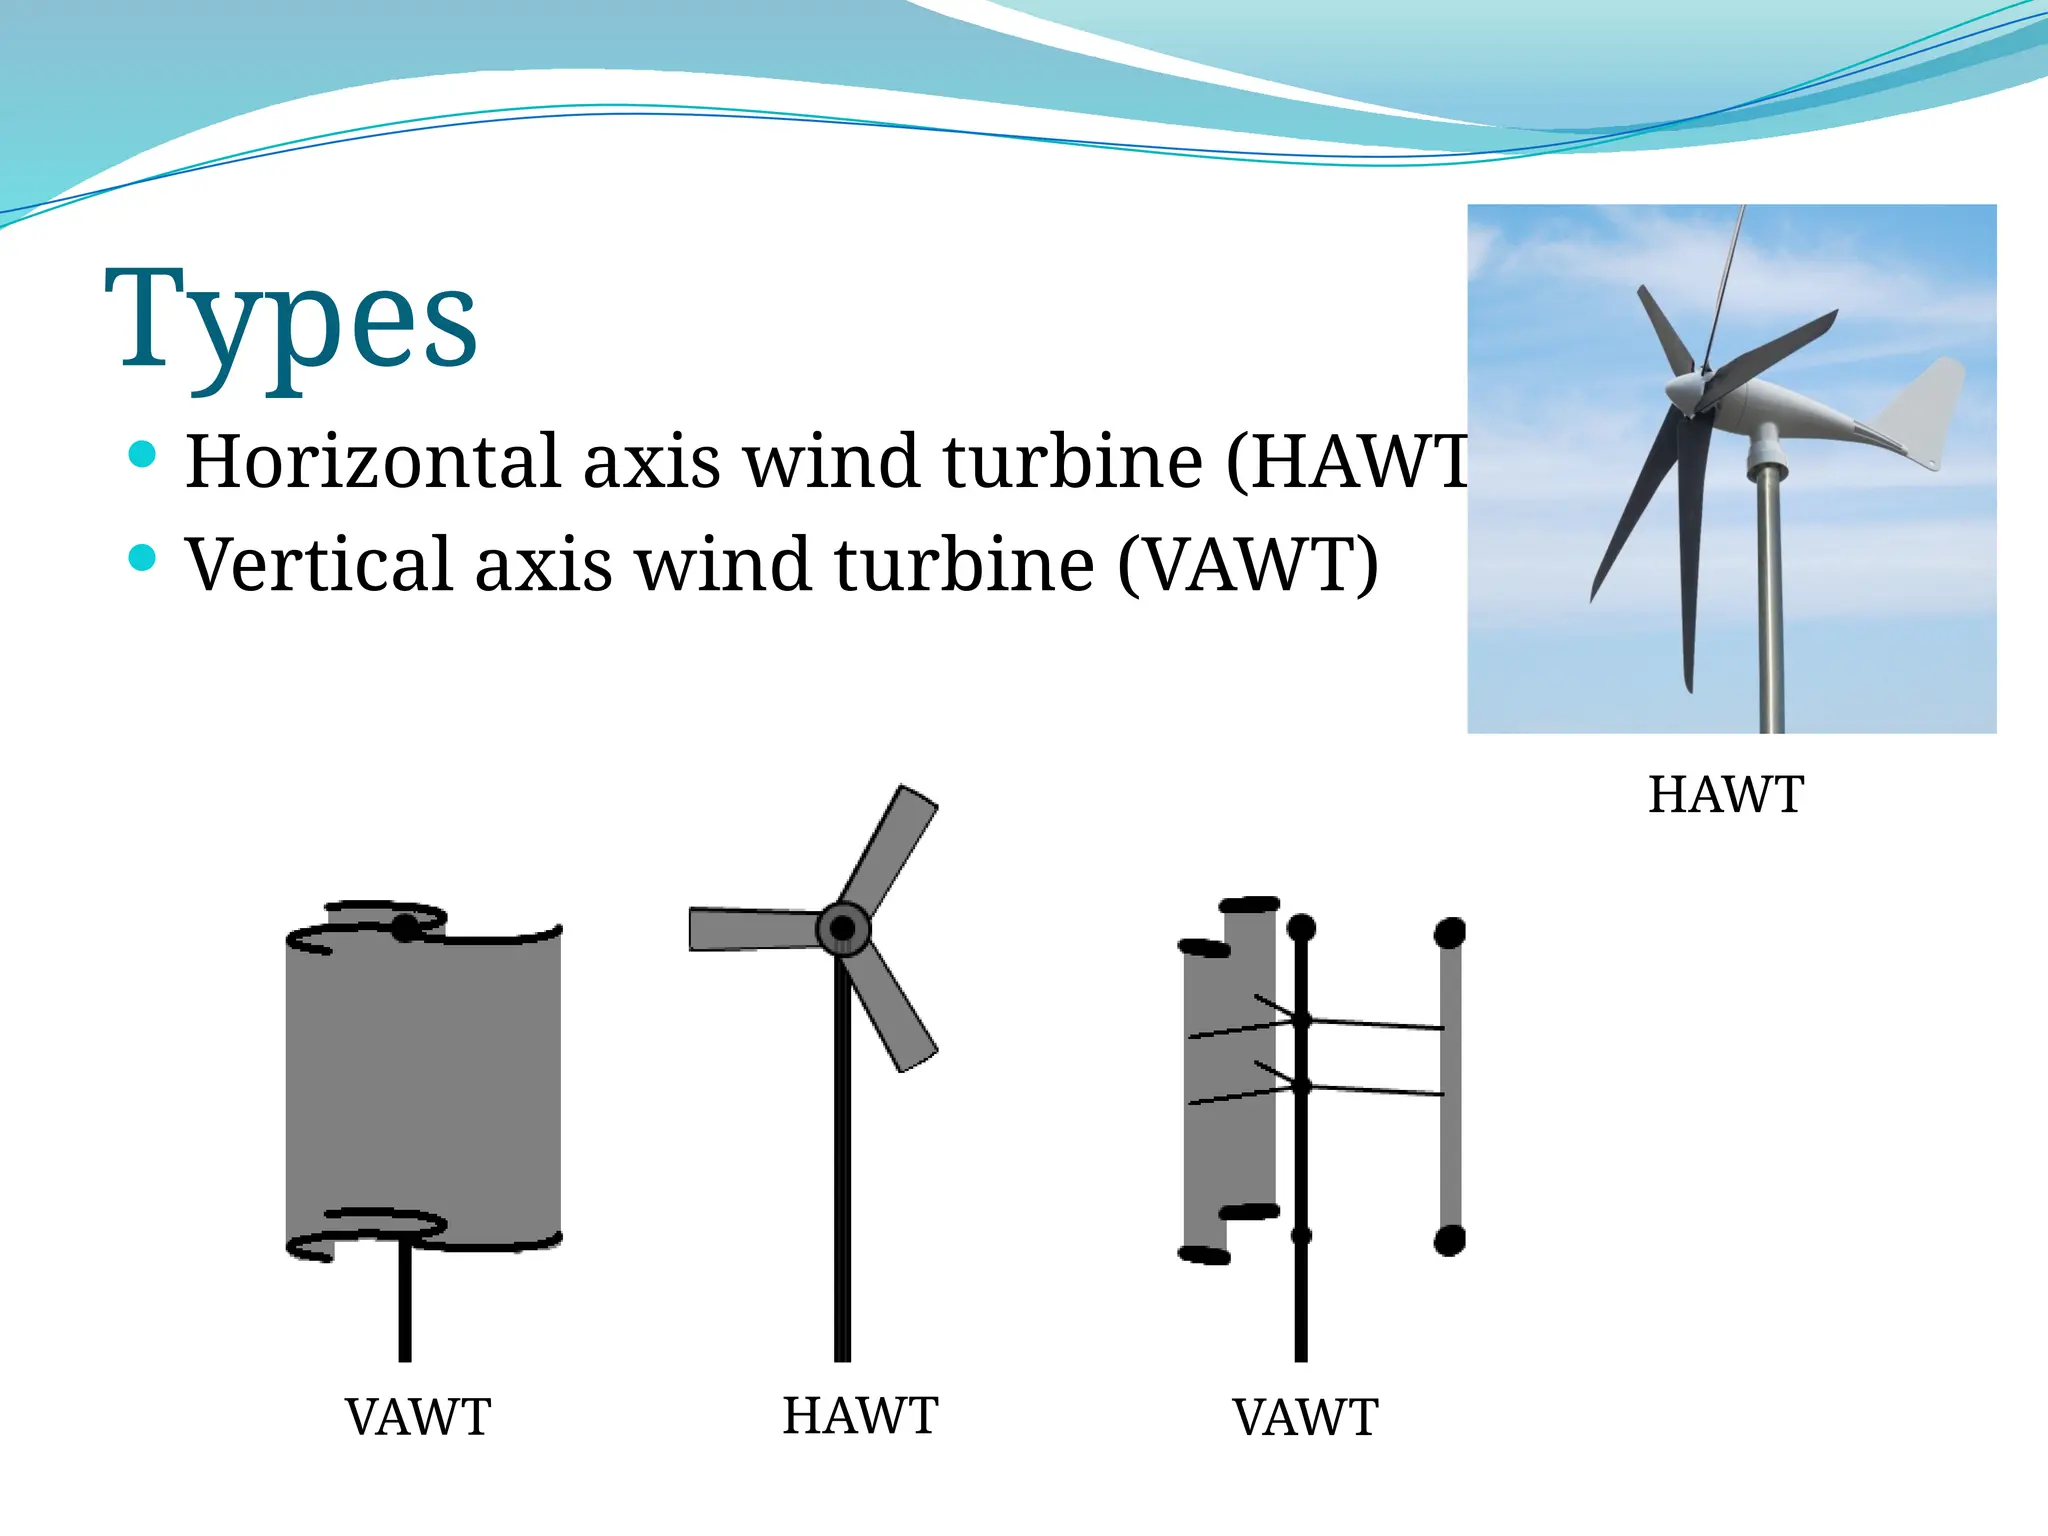
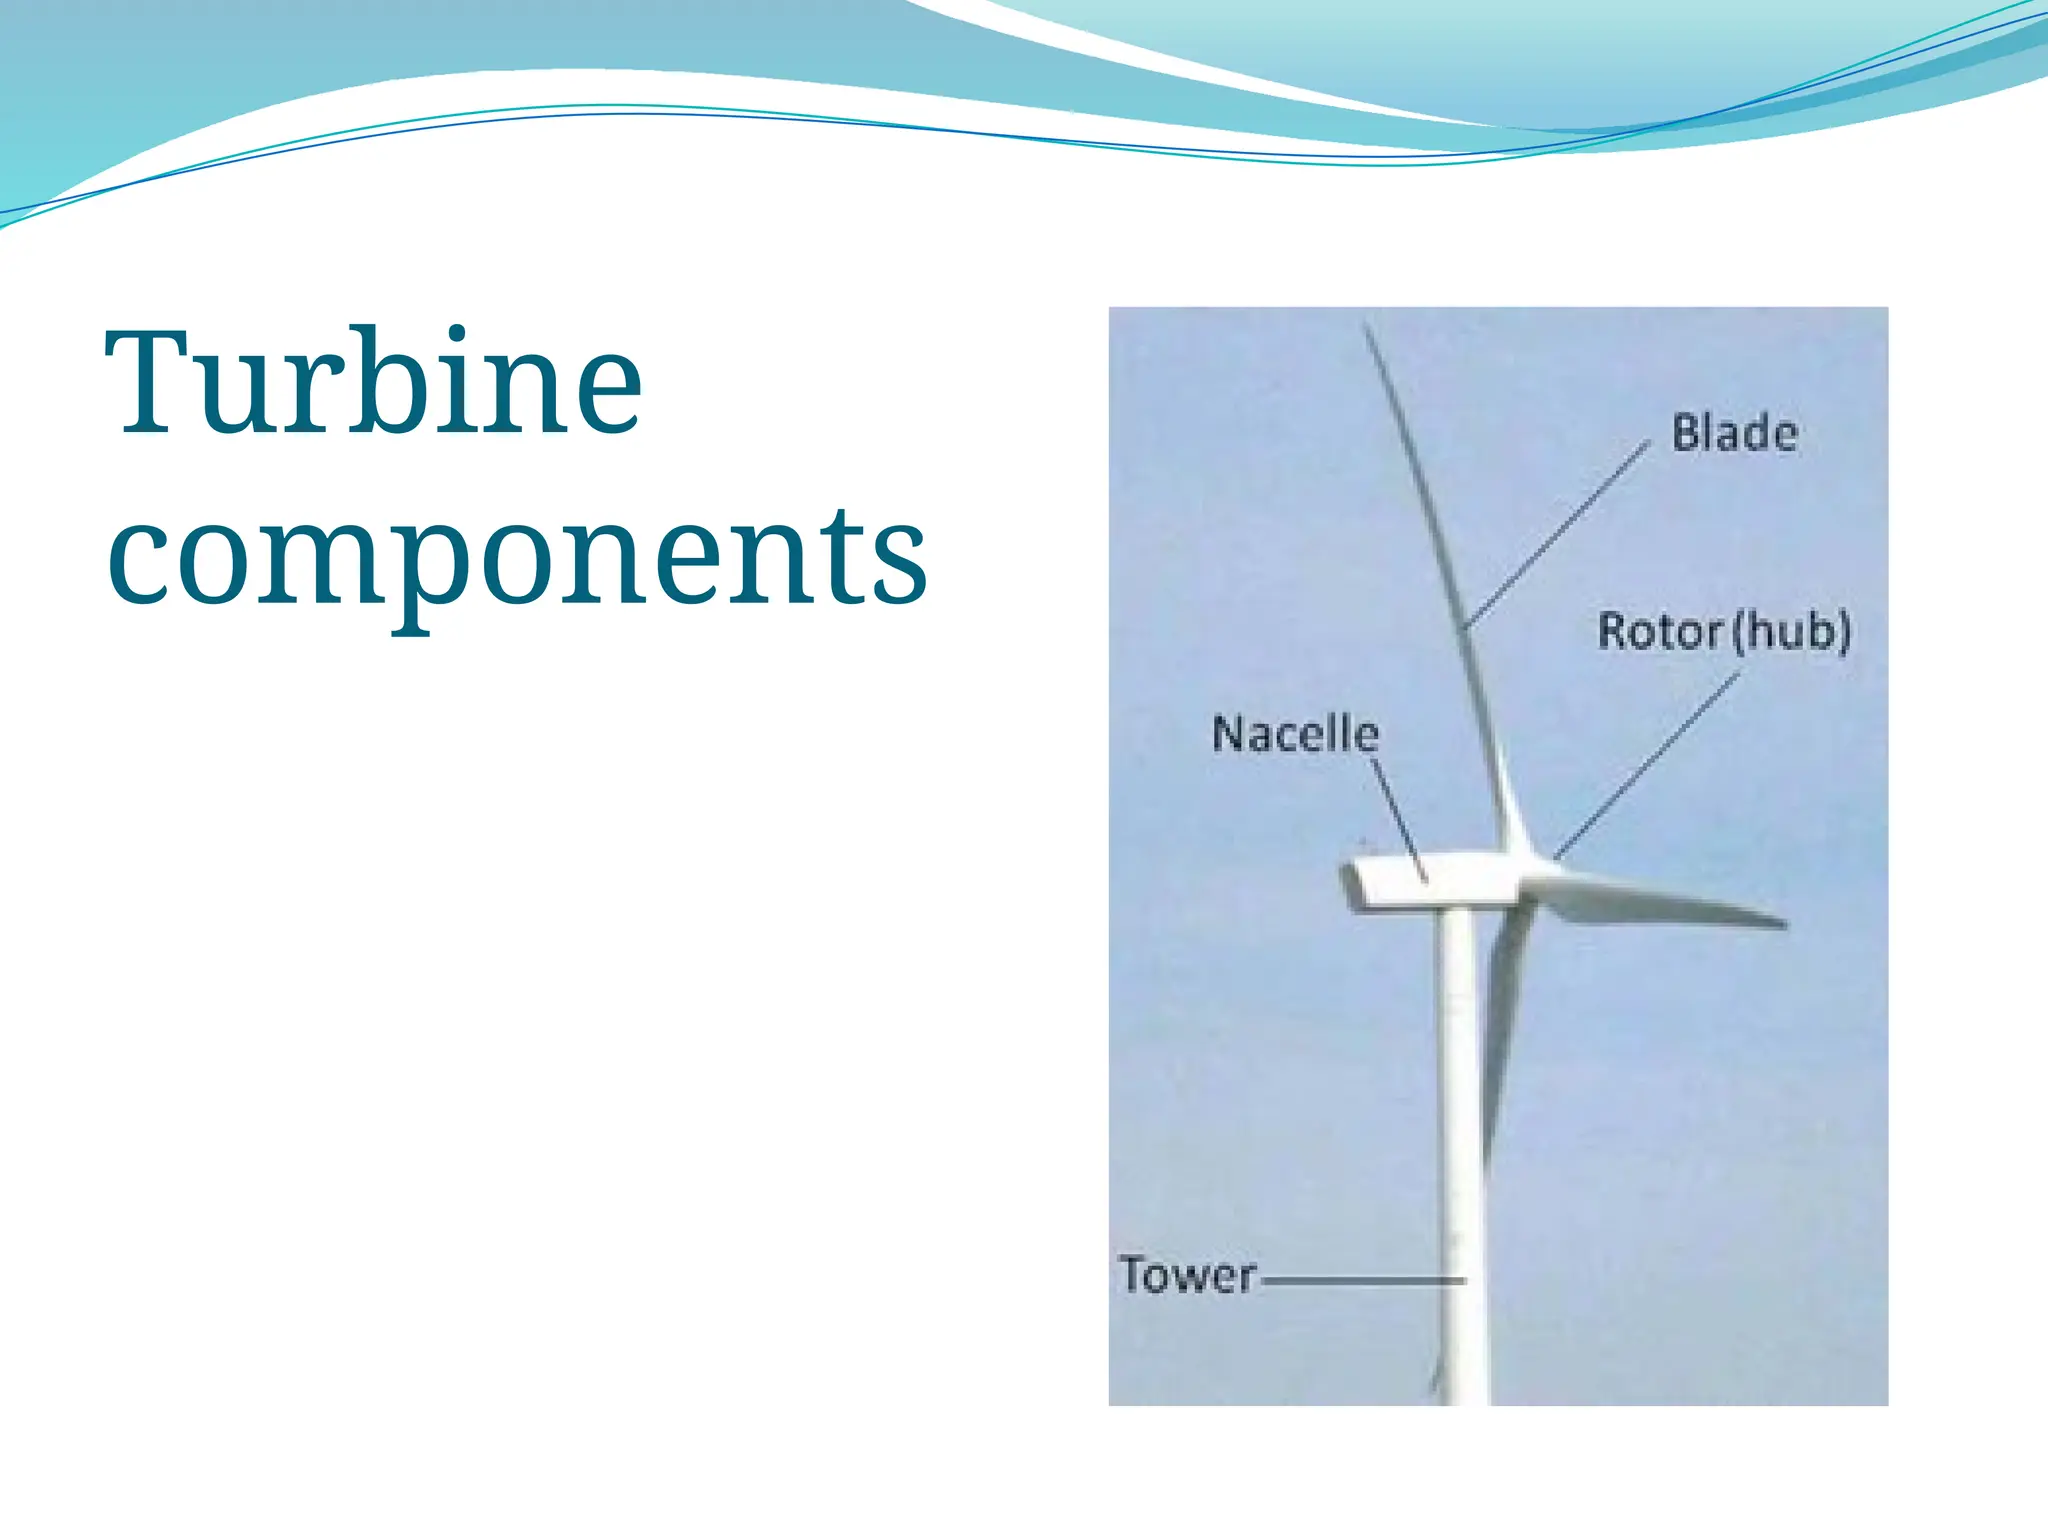
HAWT VAWT
Mainrotor shaft and
electrical generator at
the top of the tower
Must be pointed into
the wind
Main rotor shaft
arranged vertically
The generator and
gearbox can be placed
near the ground
Does not need to be
pointed into the wind
Relatively low
rotational speed
5.
Gross power
–rotor diameter
– air density
– wind velocity
[Sahin et al. 2006]
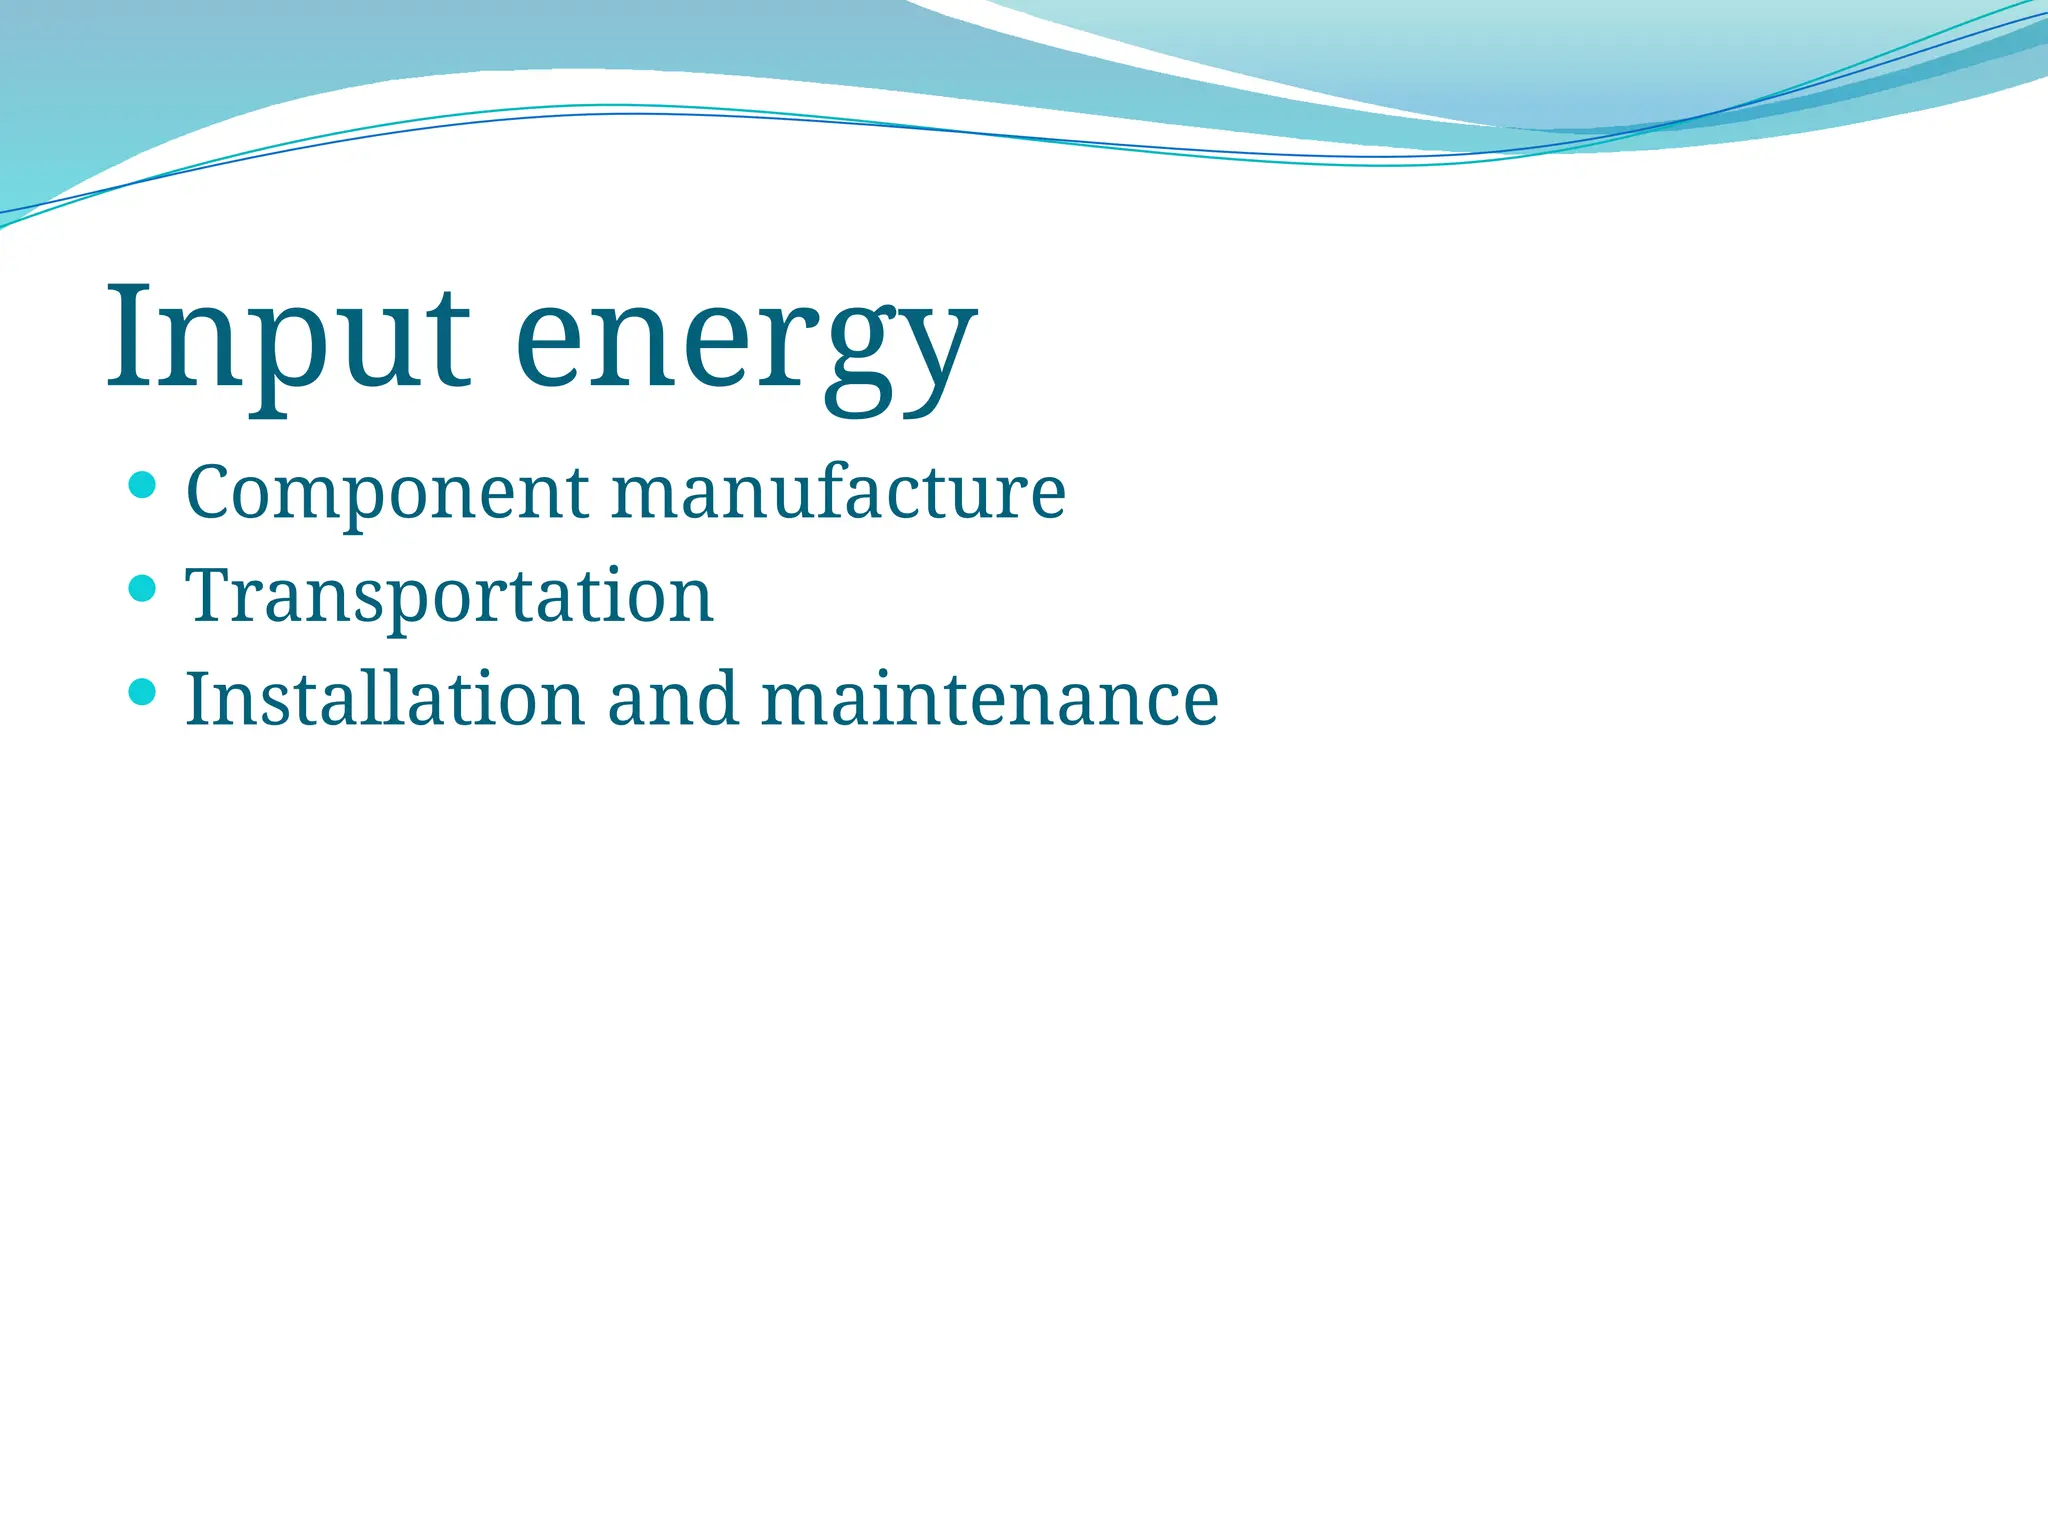
Component manufacture
Material
Energy consumptionper kg
without recycled aluminium
(MJ)
Energy consumption per
kg with recycled
aluminium (MJ)
Steel 7 7
Aluminium 145 72
Recycled
aluminium (100%) - 7
Copper 1 1
Epoxy 2 2
Carbon fibre 8 8
Total 163 97
Total for 95 kg 15430 9190
[Allen et al., 2008 & Rankine et al. ,2006 ]
Total input energy
Energyconsumption
(MJ)*
Energy consumption
with 50% recycled
aluminium(MJ)*
Component
manufacure 15430 9190
Transportatio
n 6230 6230
Installation
and
maintenance 205 205
Total 21870 15625
[Allen et al., 2008 & Rankine et al. ,2006 ]
27.
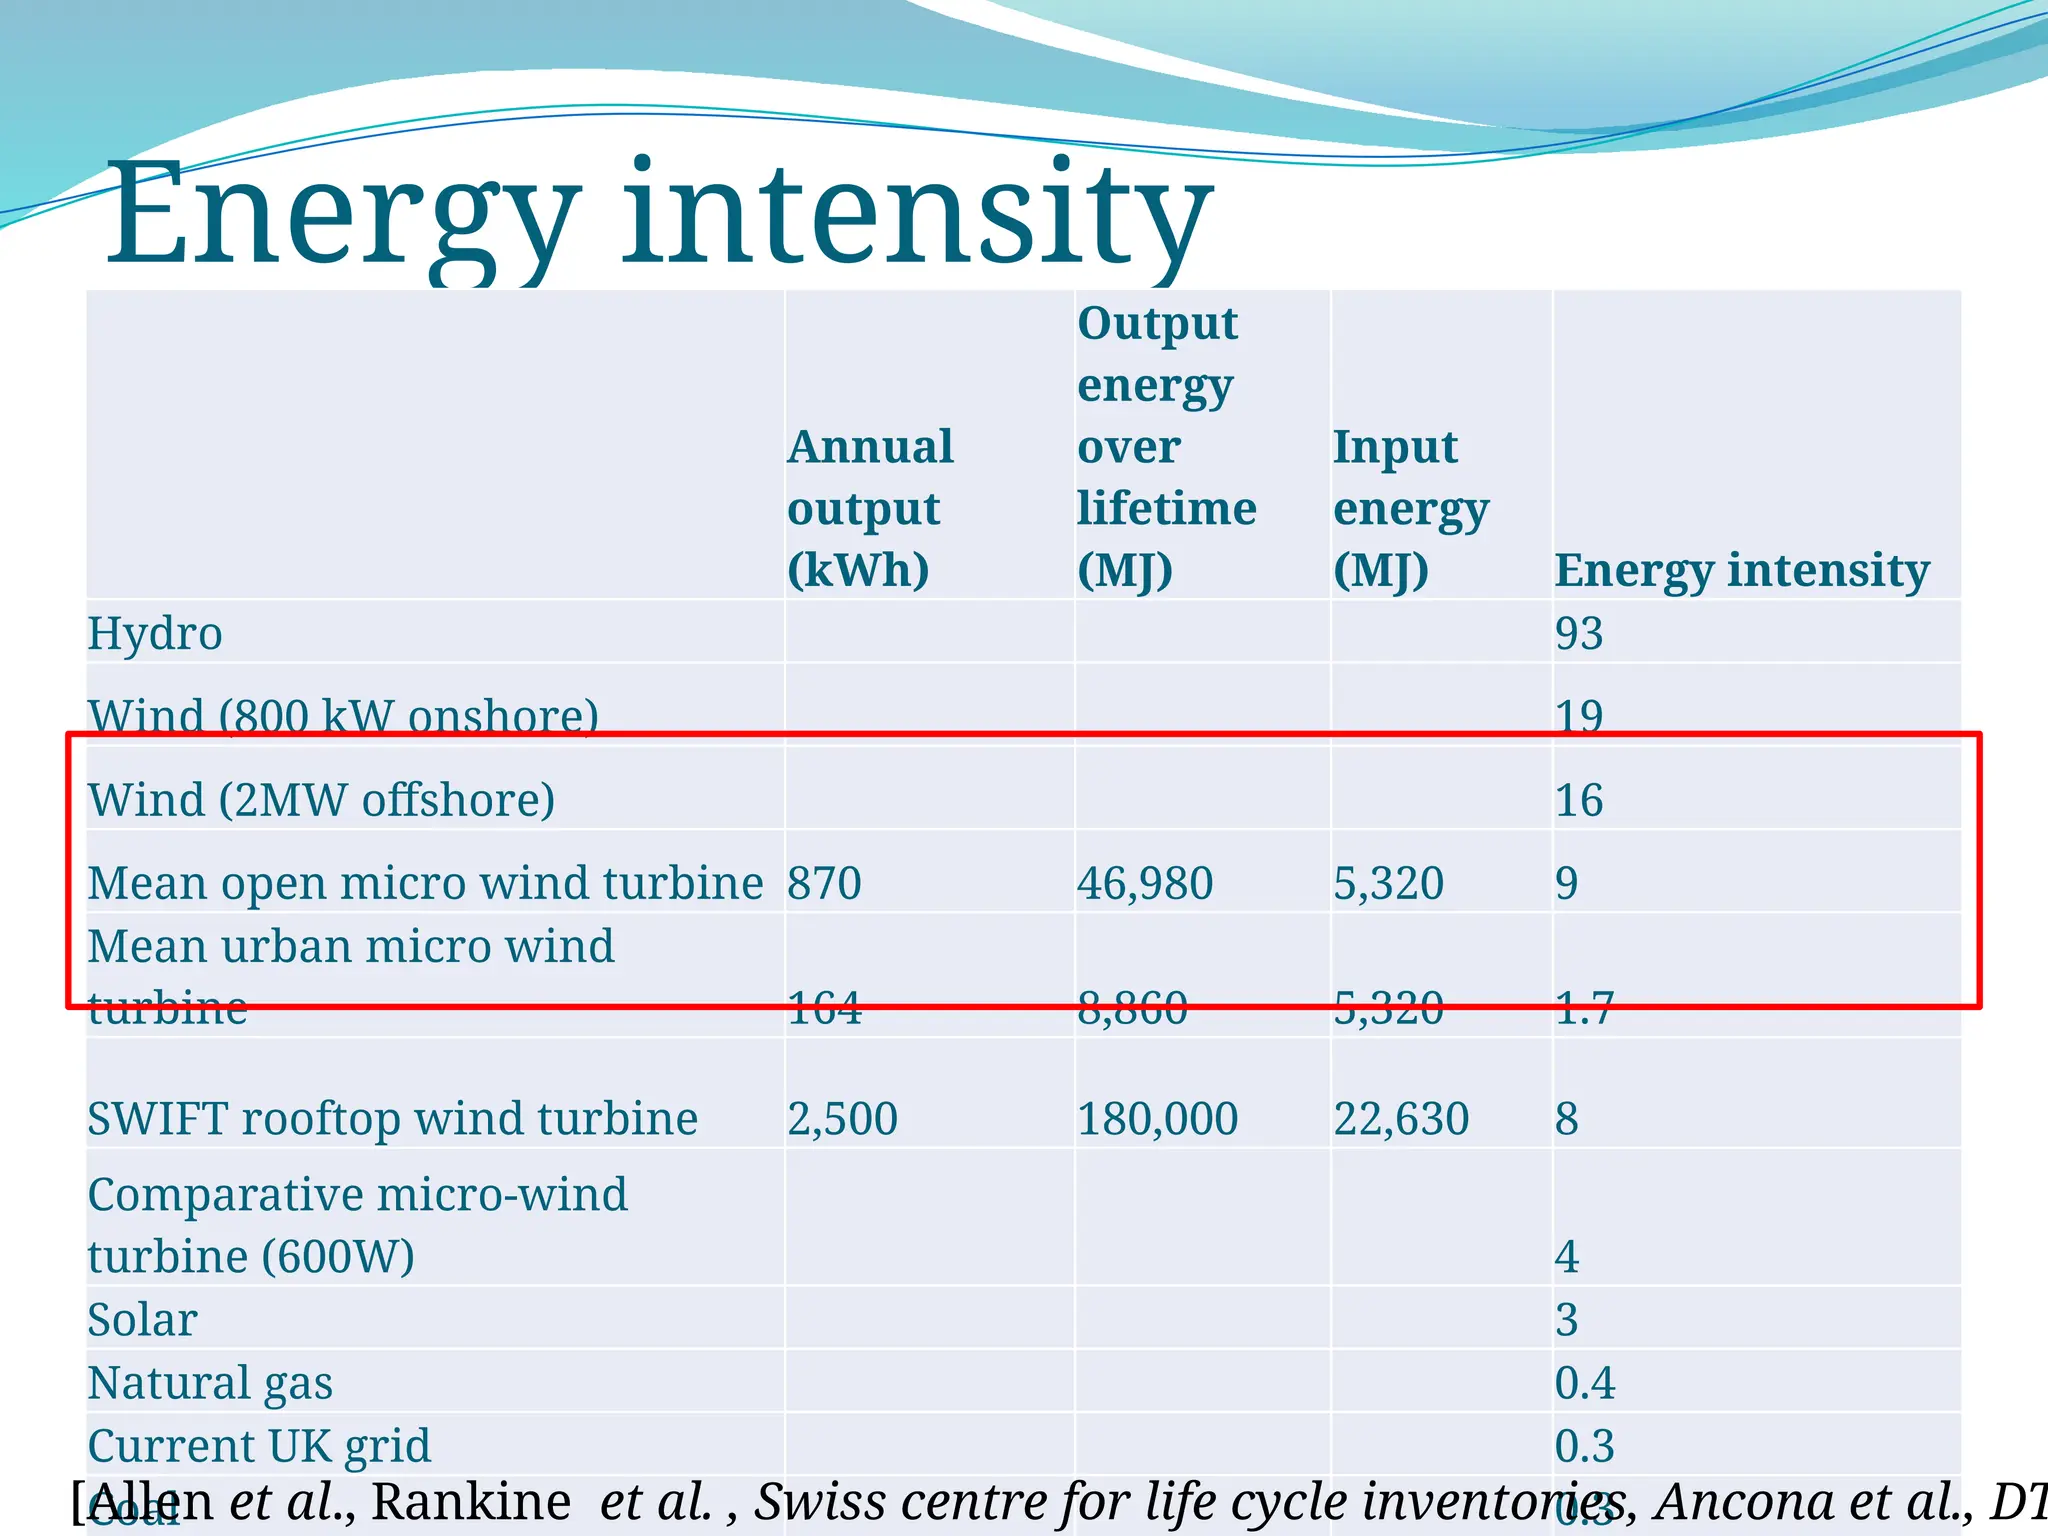
Energy intensity
Annual
output
(kWh)
Output
energy
over
lifetime
(MJ)
Input
energy
(MJ) Energyintensity
Hydro 93
Wind (800 kW onshore) 19
Wind (2MW offshore) 16
Mean open micro wind turbine 870 46,980 5,320 9
Mean urban micro wind
turbine 164 8,860 5,320 1.7
SWIFT rooftop wind turbine 2,500 180,000 22,630 8
Comparative micro-wind
turbine (600W) 4
Solar 3
Natural gas 0.4
Current UK grid 0.3
Coal 0.3
[Allen et al., Rankine et al. , Swiss centre for life cycle inventories, Ancona et al., DT
28.
Payback time
Annual output
energy(MJ)
Input energy
(MJ) Payback time (y)
Mean urban
micro wind
turbine 590 5320 9
Mean open
micro wind
turbine 3130 5320 1.7
SWIFT
rooftop wind
turbine 9000 22630 2.5
[Allen et al., 2008 & Rankine et al. ,2006 ]
29.
References
Bahaj, A.S.,Myers, L., and James, P. A. B. Urban energy generation: influence of
micro-wind turbine output on electricity consumption in buildings.EnergyBuild.,
2007, 39(2), 154–165.
Sahin,A.D.,Dincer, I.,andRosen,M. A.Thermodynamic analysis of wind energy.
Int. J. Energy Res., 2006, 30(8), 553–566.
Betz, A. Windenergie und ihre Ausnutzung durch Windmühlen, 1946 (Vandenhoek
and Ruprecht, Göttingen).
Entec - http://www.entec-international.com/
Roth, M. Review of atmospheric turbulence over cities. Q. J. R.Meteorol. Soc., 2000,
126, 941–990.
S. R. Allen, G. P. Hammond, and M. C. McManus, Energy analysis and
environmental life cycle assessment of a micro-wind turbine, J. Power and
Energy, 2008, 669-683.
DBERR. Energy consumption tables: domestic energy consumption tables. 2007,
available
from:http://www.dti.gov.uk/energy/statistics/publications/ecuk/domestic/
page18071.html, accessed 13 August 2007.
DCLG. Live tables on stock. 2007, available from:
http://www.communities.gov.uk/index.asp?id=1156006,accessed 13 August 2007.
30.
References
Dutton, A.G., Halliday, J. A. , and Blanch, A. J., The feasibility of building-mounted/integrated
wind turbines. (BUWTs): Achieving their potential for carbon emission reductions. Final report,
4 May 2005, p. 109.
Ancona, D. and McVeigh, J. Wind turbine – materials and manufacturing fact sheet, Prepared
by Princeton Energy Resources International, LLC for the Office of Industrial Technologies, US
Department of Energy,2001.
Rankine, R. K., Chick, J. P. and Harrison, G. P. Energy and carbon audit of a rooftop wind
turbine. Proc. InstnMech. Engrs, Part A: J. Power and Energy, 2006, 220(7),643–654
R.H. Crawford, Life cycle energy and greenhouse emissions analysis of wind turbines and the
effect of size on energy yield, Renewable and Sustainable Energy Reviews 13 (2009) 2653–2660
Carbon trust - http://www.carbontrust.com/media/77248/ctc738_small-scale_wind_energy.pdf
http://energy.gov/eere/wind/history-wind-energy
Illustrated history of wind power development - http://
energy.gov/eere/wind/history-wind-energy
Swiss Centre for Life Cycle Inventories. Ecoinvent database [v1.3], 2007 (EPMA, Switzerland).
DTI.Digest ofUnitedKingdomenergy statistics 2005, 2006 (Department of Trade and Industry,
London).
Manfred Lenzen, *, Jesper Munksgaardb, Energy and CO2 life-cycle analyses of wind turbines
—review and applications. Renewable energy, 26 (2002) 339–362
Editor's Notes
#1 Wind power was very popular in the search for renewable energy sources, it is quite developed.
What was interesting to me was to see what will happen if we use small scale wind turbines in our homes. What will be the influence.
No cover for financial information
#2 The first wind-mills were developed in Persia and probably in Chaina between 500-900 B.C to automate the tasks of water-pumping and grain grinding .
From there the use of wind-mills spread from Persia to the surrounding areas in the middle east , where it was used in food production.
Around 1,000 A.D., wind power technology spread north to European countries such as The Netherlands, which adapted windmills to help drain lakes and also to grind grain, with a new design for the wind mill – a tower mill.
The technology developed
Between 1850 and 1970, over six million mostly small (1 horsepower or less) mechanical output wind machines were installed in the U.S. alone.
#3 The most common type in the UK is the HAWT [Bahaj et al., (1)]
#4 Most of the small scale (and in general) wind turbines are horizontal axis – more efficient, usually
Most early ones – vertical
In Europe - horizontal
#5 Wind turbine - a device that converts kinetic energy from the wind into electrical power.
U (cubic) and D (square) are the dominant factor
Has cubic dependence on wind velocity
#6 16/27 or 59% of the Gross power. Betz's law calculates the maximum power that can be extracted from the wind.
Real turbine extract less than Betz limit due to aerodynamics and power conversion losses.
Figure: representative micro-wind turbine power curve, compared with the Gross power and the Betz limit.
#7 Entec – a company that de sign environmental solutions and products
http://www.entec-international.com/
Cut-in speed: At very low wind speeds, there is insufficient torque exerted by the wind on the turbine blades to make them rotate
Rated power: the power output reaches the limit that the electrical generator is capable of – keep the power at const level
Cut-out speed: There is a risk of damage to the rotor
#8 Globally, winds are caused by pressure gradients generated by the differential heating of the Earth’s surface by the Sun
Within the atmospheric boundary layer the shear stresses caused by the Earth’s surface extract momentum from the wind,
and cause a variation of velocity with height. Topography,surface roughness etc.
Urban environments typically have the greatest surface roughness, and climatological processes in such environments are accordingly complex.
#9 Turbulence intensity as a function of height in urban environments
#14 The mean annual wind speed in rural environments ranges between 2.8-7.8 m/s, in urban environments – 2.3 – 5.2 m/s (more affected by turbulence – power robbing effect of 50%, compared with 15% in rural environments).
Capacity factor = actual energy production/output in rated power continually %
Estimations:
1. Wind speed data was taken between 1990-2006 in 26 sites, 18 rural and 8 urban.
2. Position : a. rural – mounted upon a 10m mast away from rural household
b. urban – mounted upon a building
3. The estimations were corrected for turbulence intensity
4. The wind turbine works 90% of the time (breakdown, maintenance).
5. All the energy is consumed by the household or exported to the grid (no transmission losses)
#16 The electricity consumption is broadly const.
~4450 kwh per year (in the us it’s 11700 kWh/year) and ~2000kWh per person http://shrinkthatfootprint.com/average-household-electricity-consumption
https://www.gov.uk/government/uploads/system/uploads/attachment_data/file/338662/ecuk_chapter_3_domestic_factsheet.pdf
#17 870 ~ 1/5 of the household consumption
164 ~1/25 of the household consumption
Now its financially unattractive, but need also to consider environmental impacts
#20 Very different from large scale wind-turbines – no concrete, less steel
#22 The number were taken as an average over different values presented in the following articles
#23 The difference is probably a result of a varying proportion of aluminum that is recycled for use within the turbines.
The Ecoinvent database used in the present study estimates that to produce 1 kg of virgin aluminum takes 201 MJ, but to produce 1 kg of recycled aluminum takes only 23 MJ.
By using virgin Aluminium in all relevant parts of the generator, the energy used in production changes to 8220 MJ. This compares with 5320 MJ when using the
recycled content adopted for this study (just over 50 per cent recycled, not including alloys or powder coatings). Using virgin aluminium for turbine production
means that the amount of energy used to produce the turbine per kg increases to 224 MJ.
#24 * Delivery distance of 533 km was calculated on the basis of the average distance between Edinburgh and all major cities (Rankine). In Allen they took 400 km – I took an average
** Used diesel for trucks and regular petrol for the car
#25 *** km in 40 min
The energy from this activity was taken to be equivalent to those of a light commercial vehicle operating for 40 min.
#26 comparing with Allen's article: (5320-1645)/37=~99, similar to 97.6 in slide 19
* for a 95 kg turbine
#27 Energy intensity is defined as Output energy over the turbine life time divided by the input energy invested in the turbine production
#28 Annual energy output 164 kWh=590MJ
Annual energy input 5320/15=354MJ
Primary: wind, solar, hydro
Secondary: fossil fuel
Payback time – Energy invested in turbine divided by the annual output energy
![Gross power
– rotor diameter
– air density
– wind velocity
[Sahin et al. 2006]](https://image.slidesharecdn.com/course2015small-scalewindturbines0-250331033241-f091c6f4/75/Small-Scale-Wind-Turbines-Document-for-basic-understanding-5-2048.jpg)
![Betz limit - Max power of
[Betz 1946]](https://image.slidesharecdn.com/course2015small-scalewindturbines0-250331033241-f091c6f4/75/Small-Scale-Wind-Turbines-Document-for-basic-understanding-6-2048.jpg)
![Power curve
[Entec]](https://image.slidesharecdn.com/course2015small-scalewindturbines0-250331033241-f091c6f4/75/Small-Scale-Wind-Turbines-Document-for-basic-understanding-7-2048.jpg)
![Wind resource
[Entec]](https://image.slidesharecdn.com/course2015small-scalewindturbines0-250331033241-f091c6f4/75/Small-Scale-Wind-Turbines-Document-for-basic-understanding-8-2048.jpg)
![Turbulence
[Roth, 2000]](https://image.slidesharecdn.com/course2015small-scalewindturbines0-250331033241-f091c6f4/75/Small-Scale-Wind-Turbines-Document-for-basic-understanding-9-2048.jpg)
![[Carbon trust]](https://image.slidesharecdn.com/course2015small-scalewindturbines0-250331033241-f091c6f4/75/Small-Scale-Wind-Turbines-Document-for-basic-understanding-11-2048.jpg)
![Turbine comparison
micro HAWT
Swift rooftop
wind turbine
Power rating
(kW) 0.6 1.5
Mean annual
output (kWh) 870 / 164 * 2000-3000
Rotor
diameter (m) 1.7 2
Lifetime (y) 15 20
Rated velocity
(m/s) 12 12
[Allen et al., 2008 & Rankine et al. ,2006 ]](https://image.slidesharecdn.com/course2015small-scalewindturbines0-250331033241-f091c6f4/75/Small-Scale-Wind-Turbines-Document-for-basic-understanding-12-2048.jpg)
![Annual energy output
[Allen et al., 2008]](https://image.slidesharecdn.com/course2015small-scalewindturbines0-250331033241-f091c6f4/75/Small-Scale-Wind-Turbines-Document-for-basic-understanding-14-2048.jpg)
![Annual household electricity
consumption
[DBERR, DCLG ]](https://image.slidesharecdn.com/course2015small-scalewindturbines0-250331033241-f091c6f4/75/Small-Scale-Wind-Turbines-Document-for-basic-understanding-16-2048.jpg)
![Annual energy output
[Allen et al., 2008(6)]
870 kwh
164 kwh
1
5
1
5
1
25](https://image.slidesharecdn.com/course2015small-scalewindturbines0-250331033241-f091c6f4/75/Small-Scale-Wind-Turbines-Document-for-basic-understanding-17-2048.jpg)
![Small scale turbine components
Component Item Material
Percentage
of total mass
Tower Aluminium 40%
Nacelle
Frame &
cover Aluminium 25%
Generator Steel 15%
Copper 2%
Rotors Blades
carbon fibre-
reinforced epoxy
(CFRP) 4%
Hub and
bolts Aluminium 1%
Steel 1%
[Allen et al., 2008 & Rankine et al. ,2006 ]](https://image.slidesharecdn.com/course2015small-scalewindturbines0-250331033241-f091c6f4/75/Small-Scale-Wind-Turbines-Document-for-basic-understanding-20-2048.jpg)
![Small scale turbine components
Aluminium 70%
Steel 16 %
Copper 2%
Epoxy resin 4%
Others 4%
[Rankine et al. ,2006]](https://image.slidesharecdn.com/course2015small-scalewindturbines0-250331033241-f091c6f4/75/Small-Scale-Wind-Turbines-Document-for-basic-understanding-21-2048.jpg)
![Component manufacture
Material
Energy consumption
(MJ/kg)
concrete 4
Stainless Steel 60
Steel 42
Aluminium 206
Recycled aluminium
(100%) 19
Copper 67
Epoxy 46
Glass fiber 115
[Allen et al., Rankine et al., Crawford, Schleisner , Lenzen et al., Fleck et al.]](https://image.slidesharecdn.com/course2015small-scalewindturbines0-250331033241-f091c6f4/75/Small-Scale-Wind-Turbines-Document-for-basic-understanding-22-2048.jpg)
![Component manufacture
Material
Energy consumption per kg
without recycled aluminium
(MJ)
Energy consumption per
kg with recycled
aluminium (MJ)
Steel 7 7
Aluminium 145 72
Recycled
aluminium (100%) - 7
Copper 1 1
Epoxy 2 2
Carbon fibre 8 8
Total 163 97
Total for 95 kg 15430 9190
[Allen et al., 2008 & Rankine et al. ,2006 ]](https://image.slidesharecdn.com/course2015small-scalewindturbines0-250331033241-f091c6f4/75/Small-Scale-Wind-Turbines-Document-for-basic-understanding-23-2048.jpg)
![Transportation
Vehicle
Fuel
consumption
(l/km)
Average
distance*
(km)
Fuel
consumptio
n (l)
Energy
consumptio
n (MJ/l)**
Total energy
consumption
(MJ)
Curtain-
sided truck 0.34 470 160 39 6230
Light
commercia
l vehicle 0.08 470 37 39 1440
Medium-
sized car 0.07 470 31 35 1090
[Allen et al., 2008 & Rankine et al. ,2006 ]](https://image.slidesharecdn.com/course2015small-scalewindturbines0-250331033241-f091c6f4/75/Small-Scale-Wind-Turbines-Document-for-basic-understanding-24-2048.jpg)
![Installation and
maintenance
Vehicle
Fuel
consumptio
n (l/km)
Average
distance**
* (km)
Fuel
consumptio
n (l)
Energy
consumption
(MJ/l)**
Total energy
consumptio
n (MJ)
Light
commercial
vehicle 0.08 66 5 40 205
[Rankine et al. ,2006]](https://image.slidesharecdn.com/course2015small-scalewindturbines0-250331033241-f091c6f4/75/Small-Scale-Wind-Turbines-Document-for-basic-understanding-25-2048.jpg)
![Total input energy
Energy consumption
(MJ)*
Energy consumption
with 50% recycled
aluminium(MJ)*
Component
manufacure 15430 9190
Transportatio
n 6230 6230
Installation
and
maintenance 205 205
Total 21870 15625
[Allen et al., 2008 & Rankine et al. ,2006 ]](https://image.slidesharecdn.com/course2015small-scalewindturbines0-250331033241-f091c6f4/75/Small-Scale-Wind-Turbines-Document-for-basic-understanding-26-2048.jpg)
![Payback time
Annual output
energy (MJ)
Input energy
(MJ) Payback time (y)
Mean urban
micro wind
turbine 590 5320 9
Mean open
micro wind
turbine 3130 5320 1.7
SWIFT
rooftop wind
turbine 9000 22630 2.5
[Allen et al., 2008 & Rankine et al. ,2006 ]](https://image.slidesharecdn.com/course2015small-scalewindturbines0-250331033241-f091c6f4/75/Small-Scale-Wind-Turbines-Document-for-basic-understanding-28-2048.jpg)
![References
Dutton, A. G., Halliday, J. A. , and Blanch, A. J., The feasibility of building-mounted/integrated
wind turbines. (BUWTs): Achieving their potential for carbon emission reductions. Final report,
4 May 2005, p. 109.
Ancona, D. and McVeigh, J. Wind turbine – materials and manufacturing fact sheet, Prepared
by Princeton Energy Resources International, LLC for the Office of Industrial Technologies, US
Department of Energy,2001.
Rankine, R. K., Chick, J. P. and Harrison, G. P. Energy and carbon audit of a rooftop wind
turbine. Proc. InstnMech. Engrs, Part A: J. Power and Energy, 2006, 220(7),643–654
R.H. Crawford, Life cycle energy and greenhouse emissions analysis of wind turbines and the
effect of size on energy yield, Renewable and Sustainable Energy Reviews 13 (2009) 2653–2660
Carbon trust - http://www.carbontrust.com/media/77248/ctc738_small-scale_wind_energy.pdf
http://energy.gov/eere/wind/history-wind-energy
Illustrated history of wind power development - http://
energy.gov/eere/wind/history-wind-energy
Swiss Centre for Life Cycle Inventories. Ecoinvent database [v1.3], 2007 (EPMA, Switzerland).
DTI.Digest ofUnitedKingdomenergy statistics 2005, 2006 (Department of Trade and Industry,
London).
Manfred Lenzen, *, Jesper Munksgaardb, Energy and CO2 life-cycle analyses of wind turbines
—review and applications. Renewable energy, 26 (2002) 339–362](https://image.slidesharecdn.com/course2015small-scalewindturbines0-250331033241-f091c6f4/75/Small-Scale-Wind-Turbines-Document-for-basic-understanding-30-2048.jpg)


![Global Nes P Pt 2009 A Finals Copy[1]](https://cdn.slidesharecdn.com/ss_thumbnails/globalnesppt2009afinalscopy1-124735138781-phpapp01-thumbnail.jpg?width=640&height=640&fit=bounds)


