SlideShare a Scribd company logo
I. Introduction
It is probable that whenever thinking of core industries playing a critical role in maintaining a
sustainable development or boosting the economy, seldom does the idea of rubber industry
spring on our mind because of the fact that not every country is endowed with fertile soil for
planting, and then favorable weather for some specific kinds of trees to flourish. Vietnam is a
tropical country which is quite an ideal place for rubber to thrive, and actually, our nation has
benefited from this type of tree to develop quite a new field- rubber industry. Basically, rubber-
related companies manufacture their products from rubber to serve both domestic and global
demands. In this industry, DRC – Danang rubber joint stock company is a well-known
corporation that has gained a lot of remarkable achievements contributing to our country’s long-
term economic development. In order for a deep insight into the company’s “health” , it is crucial
to probe into its performance via analyzing both quantitative and qualitative information which is
a proper base for an investment decision making to reach in terms of potential investors. This
report is divided into three main parts. In the first place, the paper starts with a panorama of
rubber industry from which an analysis about company strategy, operations and assessment of
the quality of financial reporting are made. After that qualitative appraisal, the report continues
to dig more deeply into the quantitative aspect through financial analysis. Finally, from the
historical figures, the paper intents to make a forecast about the future development direction
which is a reliable foundation for investors to draw the investment decision. Hopefully, this
material will be a valuable reference for further research.
II. Main contents
1. Company overview
Danang Rubber Joint Stock Company (DRC) is located at Ngu Hanh Son district, in Da Nang
city. Established in 1975, the firm has been developing for more than 35 years and has so far
accomplished remarkable achievements in rubber industry in particular and in dynamic
Vietnamese market in general.
DRC has largely put its emphasis on producing, importing and exporting rubber materials and
products as well as manufacturing and installing machinery and equipment serving for rubber
production. Besides, the firm also expands its business to participate in commercial activities.
DRC was officially listed on HCM Stock Exchange in December-2006.
Cooperating with European experts and applying the most modern technology to production
line, DRC has installed an advanced manufacturing system encompassing significantly high-
1
quality and widely diversified types of products: Light truck tires, heavy truck tires, super heavy
duty tires for agriculture tractors, retreaded tires, bicycle and motorcycle tires, as well as rubber
products meeting various needs in traffic construction work, ports and automobile rubber parts.
To obtain a fruitful outcome and firm prestige, DRC has indeed has formed and maintained an
appropriate corporate strategy via its slogan: Safe and reliable on all terrain, highly performable
on heavy load, endurable over the time – DRC conquers all the roads. In the first place, DRC
has so far aimed at upgrading and improving the quality of products for the sake of its loyal
customers and for the long-lasting prosperity and development of the firm. More noticeably, its
pursuit to superior products is always accompanied by the utmost concern for ecological
maintenance. What is more, DRC has been actually marked a deep stamp in the mind of the
customers by its considerate serving. In effect, these developing plans have indeed created the
unique competitive advantage for DRC.
DRC has been proud to receive a variety of governmental awards for its fruitful operation and
brilliant performance in many years such as: The Vietnam Golden Star Prize 2010, The
Prestigious Stock Brand 2009, Top 50 Leading Listed companies on Vietnamese stock market
2009… Currently, DRC has occupied about 35% of the market share, ranking the second in
producing motorbike, bicycle tires. Its products are consumed nationwide and exported to nearly
30 countries throughout the world like: India, Hongkong, Singapore, Brazil…
2. Industry analysis
Porter 5-forces method has helped us examining the development of an industry under the
constraints of 5 different factors: Buyer power, Supplier power, Rivalry among firms, treat of
new entrants, Threat of substitutes.
First of all, the power of buyer in the tire and tube industry is low, because the product is one
kind of necessity. Besides, due to the requirement of traffic safety, buyers become the price taker
in order to ensure about the product quality. The demand is nearly inelastic to price change and
the steady demand automatically pulls products through distribution channels. Although the tire
and tube sector accounts for 75% to 85% rubber product market share, the seller can easily raise
the price when needed.
However, the power of domestic supplier is high. Because of the shortage in natural resource,
the bargaining position of the natural rubber seller has powerful bargaining power to tire and
rube companies. The power of foreign supplier is medium due to high price which results from
high import taxation.
2
Industry competition is quite high. The 3 main competitors are Da Nang rubber company,
Casumina Company and Gold star rubber company. Despite the harsh competition, there is still
cooperation among those companies. Furthermore, each company has its own advantages and
market. The main rival for Viet Nam rubber companies comes from abroad. The foreign
companies have their competitive edge in the quality. Moreover, they can produce some products
that Viet Nam companies cannot such as Radial tube. Even DRC began to produce Radial tube in
2011, for temporary it is hard to compete with the quality of foreign radial tires
Threat of new entrant is low in this industry because of capital intensive requirement.
Furthermore it is hard for new company to compete with the brand of big existing companies.
The invasion of foreign companies is low due to the import barriers and the low attractive
Vietnam small market size for rubber product.
Threat of substitute is zero as there is still no other product that can replace tire and tube.
3. Company strategy analysis
3.1. Nature of the product
DRC is now offering a wide range of different product lines to meet the demand of the market.
The main products of the company can be divided into three main categories:
- Tires for motorbikes, bicycles, and technical rubber: which is the traditional product of
DRC
- Special truck tires: which DRC has the absolute advantage in Vietnamese market, with
lower price but higher quality
- Bias technology tires: to meet the demand of the big trucks
It is the fact that DRC is applying the differentiation strategy, which is illustrated by the great
effort to catch up with the demand of the consumers, and reduce the competition and market
share of the foreign producers in Vietnam. Comparing with its two close competitors, Caosumina
which majoring in producing motorbikes and light truck tires, and SRC which majoring in
producing bicycle tires, DRC seems always to be the first comer to come up with new product
ideas. Like being stated above, with more than 3,000 billion invested in the Radial project, and
the expected production capacity of more than 600,000 tires /year, DRC is becoming the first
business to produce successfully the special tires for super trucks used in special purposes.
Moreover, in the year 2010, DRC was honored to receive the golden cup for the “most effective
3
business in applying technology”. This is once again emphasizes the leading and creative role of
DRC in manufacturing and developing their products.
3.2. Degree of integration within value chain
Concerning the distribution channels, DRC is experiencing great integration with its
distributors. This company is building up its own distribution network all over the country with
more than 150 point of sales. The revenue also comes mainly from this channel with more than
75%. DRC is also the main supplier of tires for such big auto-producers in Vietnam as Truong
Hai auto, TMT, HuynDai… With the stable growth of the domestic truck manufacturing
industry, this cooperation between DRC and those companies is expected to benefit the company
in the long term. Moreover, DRC is exploiting new opportunities in foreign market such as
Malaysia, Laos, Singapore … Especially with the products of tires for super trucks, used in coal
and mineral industry, DRC has its strategic consumer Vinacomin, and the other part will be
exported to India and SinDRC.
Concerning the integration with the supplier within its value chain, this company has great
support from the parent company VinaChem. With the contract of mutual support between
Vinachem and VinaGroup (VRG), the alliance of extracting latex companies, members in the
VRG will supply raw latex for members of the VinaChem. Specifically, DRC will receive the
supply from Chư Sê, Chư Prông, Quang Tri entities. And in exchange, those companies will
consume the tires product of DRC.
3.3. Geographical diversification
About manufacturing, all the production activities of DRC are located in Da Nang. And by this
time, company is step-by-step moving its factories to the outskirt of Da Nang. As the schedule,
in the 4th
quarter of this year, it will finish the displacement of factories producing tires for bike
and motorbike from inner Da Nang to Lien Chieu industrial zone. After that, the movement of
other factories which produce tires for trucks and tractors will be continuously moved during the
time of 2012 – 2013.
However, in contrast to that, the distribution network of DRC is widespread. As we said above,
DRC has about 150 points of sale in all 64 provinces which helps to bring products to last
customer. Besides that, DRC also speeds up exporting activities. Up to now, it has the customer-
base in 27 countries in Asia, Europe and America. Especially, it has established direct sale agents
in Laos, Cambodia, and Singapore. An optimistic result is that about 25% revenue of DRC
comes from exporting.
4
3.4. Industry diversification
DRC just focuses on horizontal diversification by manufacturing, distributing and providing
related services in tire producing industry. In June 2011, Board of Management decided to add
real estate business in the Business Registration of the company. However, it has been clarified
that this activity doesn’t mean that DRC will invest in real estate market but it only leases unused
offices and factories
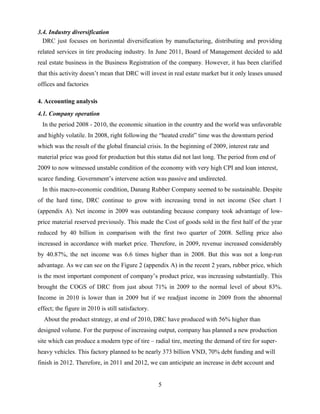
4. Accounting analysis
4.1. Company operation
In the period 2008 - 2010, the economic situation in the country and the world was unfavorable
and highly volatile. In 2008, right following the “heated credit” time was the downturn period
which was the result of the global financial crisis. In the beginning of 2009, interest rate and
material price was good for production but this status did not last long. The period from end of
2009 to now witnessed unstable condition of the economy with very high CPI and loan interest,
scarce funding. Government’s intervene action was passive and undirected.
In this macro-economic condition, Danang Rubber Company seemed to be sustainable. Despite
of the hard time, DRC continue to grow with increasing trend in net income (See chart 1
(appendix A). Net income in 2009 was outstanding because company took advantage of low-
price material reserved previously. This made the Cost of goods sold in the first half of the year
reduced by 40 billion in comparison with the first two quarter of 2008. Selling price also
increased in accordance with market price. Therefore, in 2009, revenue increased considerably
by 40.87%, the net income was 6.6 times higher than in 2008. But this was not a long-run
advantage. As we can see on the Figure 2 (appendix A) in the recent 2 years, rubber price, which
is the most important component of company’s product price, was increasing substantially. This
brought the COGS of DRC from just about 71% in 2009 to the normal level of about 83%.
Income in 2010 is lower than in 2009 but if we readjust income in 2009 from the abnormal
effect; the figure in 2010 is still satisfactory.
About the product strategy, at end of 2010, DRC have produced with 56% higher than
designed volume. For the purpose of increasing output, company has planned a new production
site which can produce a modern type of tire – radial tire, meeting the demand of tire for super-
heavy vehicles. This factory planned to be nearly 373 billion VND, 70% debt funding and will
finish in 2012. Therefore, in 2011 and 2012, we can anticipate an increase in debt account and
5
increasing in revenue will mostly rely on increasing selling price – which cannot be significant.
But we can hope in the noteworthy boost in revenue when new factory come into production
4.2. Critical accounting policies
Inventories recognition
Inventories are recorded as the lowest cost between their original costs and net realizable value.
Cost of inventories are determined in accordance with the weighted average method and
recorded in line with the perpetual method, which is persistent in every year.
Provision for devaluation of inventories is recognized when the original costs are higher than
the net realizable value.
Account receivables
Account receivable is recognized at the values on supporting documents and invoices.
Provisions for bad debts are estimated by using the aging method. The details are followed the
Circular 228/2009 TT-BTC by Ministry of Finance.
Tangible fixed asset
Tangible fixed asset is determined by their historical costs less accumulated depreciation. The
historical costs include the purchase price and any capitalized expenditure putting the assets into
operation.
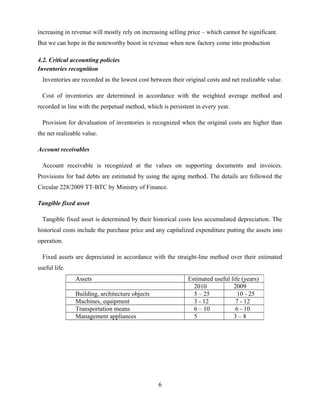
Fixed assets are depreciated in accordance with the straight-line method over their estimated
useful life.
6
Assets Estimated useful life (years)
2010 2009
Building, architecture objects 5 – 25 10 - 25
Machines, equipment 3 - 12 7 - 12
Transportation means 6 – 10 6 - 10
Management appliances 5 3 – 8
Table 1: DRC's accounting policy for estimated life of fixed assets
In 2010, company changed depreciation rate of some fixed assets to assure the rationality of
their estimated useful life.
Revenue recognition
Sales of goods are recognized when most of risks and benefits associated with the goods
ownership are transferred to customers. Sales of service are recognized when services are
performed completely. In case that the services are provided in many accounting periods, the
determination of sales in each period is done on the basis of the service completion rate at the
end date of fiscal year.
Revenue from financing activities: Interest income is recognized on the basis of current time
and interest rate; dividend income is recognized when company has the right to receive it.
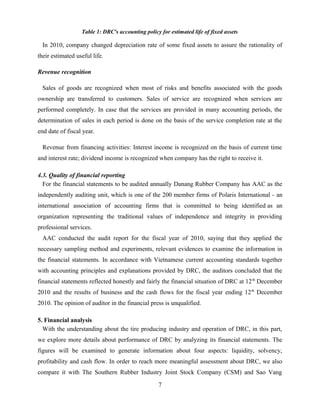
4.3. Quality of financial reporting
For the financial statements to be audited annually Danang Rubber Company has AAC as the
independently auditing unit, which is one of the 200 member firms of Polaris International - an
international association of accounting firms that is committed to being identified as an
organization representing the traditional values of independence and integrity in providing
professional services.
AAC conducted the audit report for the fiscal year of 2010, saying that they applied the
necessary sampling method and experiments, relevant evidences to examine the information in
the financial statements. In accordance with Vietnamese current accounting standards together
with accounting principles and explanations provided by DRC, the auditors concluded that the
financial statements reflected honestly and fairly the financial situation of DRC at 12th
December
2010 and the results of business and the cash flows for the fiscal year ending 12th
December
2010. The opinion of auditor in the financial press is unqualified.
5. Financial analysis
With the understanding about the tire producing industry and operation of DRC, in this part,
we explore more details about performance of DRC by analyzing its financial statements. The
figures will be examined to generate information about four aspects: liquidity, solvency,
profitability and cash flow. In order to reach more meaningful assessment about DRC, we also
compare it with The Southern Rubber Industry Joint Stock Company (CSM) and Sao Vang
7
Rubber Joint Stock Company (SRC), which together with DRC dominate tire producing
industry.
5.1. Liquidity analysis
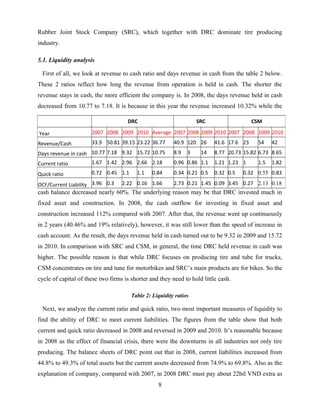
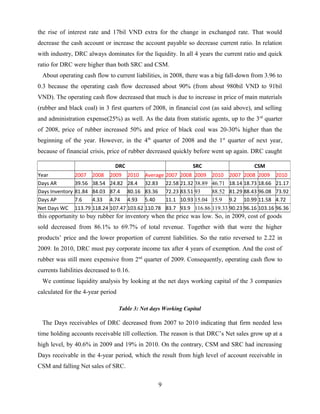
First of all, we look at revenue to cash ratio and days revenue in cash from the table 2 below.
These 2 ratios reflect how long the revenue from operation is held in cash. The shorter the
revenue stays in cash, the more efficient the company is. In 2008, the days revenue held in cash
decreased from 10.77 to 7.18. It is because in this year the revenue increased 10.32% while the
cash balance decreased nearly 60%. The underlying reason may be that DRC invested much in
fixed asset and construction. In 2008, the cash outflow for investing in fixed asset and
construction increased 112% compared with 2007. After that, the revenue went up continuously
in 2 years (40.46% and 19% relatively), however, it was still lower than the speed of increase in
cash account. As the result, the days revenue held in cash turned out to be 9.32 in 2009 and 15.72
in 2010. In comparison with SRC and CSM, in general, the time DRC held revenue in cash was
higher. The possible reason is that while DRC focuses on producing tire and tube for trucks,
CSM concentrates on tire and tune for motorbikes and SRC’s main products are for bikes. So the
cycle of capital of these two firms is shorter and they need to hold little cash.
Table 2: Liquidity ratios
Next, we analyze the current ratio and quick ratio, two most important measures of liquidity to
find the ability of DRC to meet current liabilities. The figures from the table show that both
current and quick ratio decreased in 2008 and reversed in 2009 and 2010. It’s reasonable because
in 2008 as the effect of financial crisis, there were the downturns in all industries not only tire
producing. The balance sheets of DRC point out that in 2008, current liabilities increased from
44.8% to 49.3% of total assets but the current assets decreased from 74.9% to 69.8%. Also as the
explanation of company, compared with 2007, in 2008 DRC must pay about 22bil VND extra as
8
DRC SRC CSM
Year 2007 2008 2009 2010 Average 2007 2008 2009 2010 2007 2008 2009 2010
Revenue/Cash 33.9 50.81 39.15 23.22 36.77 40.9 120 26 41.6 17.6 23 54 42
Days revenue in cash 10.77 7.18 9.32 15.72 10.75 8.9 3 14 8.77 20.73 15.82 6.73 8.65
Current ratio 1.67 1.42 2.96 2.66 2.18 0.96 0.86 1.1 1.21 1.23 1 1.5 1.82
Quick ratio 0.72 0.45 1.1 1.1 0.84 0.34 0.21 0.5 0.32 0.5 0.32 0.55 0.83
OCF/Current Liability 3.96 0.3 2.22 0.16 1.66 2.73 0.21 1.45 0.09 3.45 0.27 2.13 0.18
the rise of interest rate and 17bil VND extra for the change in exchanged rate. That would
decrease the cash account or increase the account payable so decrease current ratio. In relation
with industry, DRC always dominates for the liquidity. In all 4 years the current ratio and quick
ratio for DRC were higher than both SRC and CSM.
About operating cash flow to current liabilities, in 2008, there was a big fall-down from 3.96 to
0.3 because the operating cash flow decreased about 90% (from about 980bil VND to 91bil
VND). The operating cash flow decreased that much is due to increase in price of main materials
(rubber and black coal) in 3 first quarters of 2008, in financial cost (as said above), and selling
and administration expense(25%) as well. As the data from statistic agents, up to the 3rd
quarter
of 2008, price of rubber increased 50% and price of black coal was 20-30% higher than the
beginning of the year. However, in the 4th
quarter of 2008 and the 1st
quarter of next year,
because of financial crisis, price of rubber decreased quickly before went up again. DRC caught
this opportunity to buy rubber for inventory when the price was low. So, in 2009, cost of goods
sold decreased from 86.1% to 69.7% of total revenue. Together with that were the higher
products’ price and the lower proportion of current liabilities. So the ratio reversed to 2.22 in
2009. In 2010, DRC must pay corporate income tax after 4 years of exemption. And the cost of
rubber was still more expensive from 2nd
quarter of 2009. Consequently, operating cash flow to
currents liabilities decreased to 0.16.
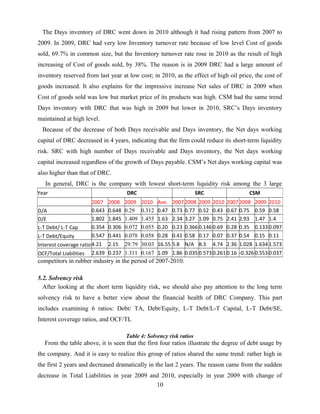
We continue liquidity analysis by looking at the net days working capital of the 3 companies
calculated for the 4-year period
Table 3: Net days Working Capital
The Days receivables of DRC decreased from 2007 to 2010 indicating that firm needed less
time holding accounts receivable till collection. The reason is that DRC’s Net sales grow up at a
high level, by 40.6% in 2009 and 19% in 2010. On the contrary, CSM and SRC had increasing
Days receivable in the 4-year period, which the result from high level of account receivable in
CSM and falling Net sales of SRC.
9
DRC SRC CSM
Year 2007 2008 2009 2010 Average 2007 2008 2009 2010 2007 2008 2009 2010
Days AR 39.56 38.54 24.82 28.4 32.83 22.58 21.32 38.89 46.71 18.14 18.73 18.66 21.17
Days Inventory 81.84 84.03 87.4 80.16 83.36 72.23 83.51 93 88.52 81.29 88.43 96.08 73.92
Days AP 7.6 4.33 4.74 4.93 5.40 11.1 10.93 15.04 15.9 9.2 10.99 11.58 4.72
Net Days WC 113.79 118.24 107.47 103.62 110.78 83.7 93.9 116.86 119.33 90.23 96.16 103.16 96.36
The Days inventory of DRC went down in 2010 although it had rising pattern from 2007 to
2009. In 2009, DRC had very low Inventory turnover rate because of low level Cost of goods
sold, 69.7% in common size, but the Inventory turnover rate rose in 2010 as the result of high
increasing of Cost of goods sold, by 38%. The reason is in 2009 DRC had a large amount of
inventory reserved from last year at low cost; in 2010, as the effect of high oil price, the cost of
goods increased. It also explains for the impressive increase Net sales of DRC in 2009 when
Cost of goods sold was low but market price of its products was high. CSM had the same trend
Days inventory with DRC that was high in 2009 but lower in 2010, SRC’s Days inventory
maintained at high level.
Because of the decrease of both Days receivable and Days inventory, the Net days working
capital of DRC decreased in 4 years, indicating that the firm could reduce its short-term liquidity
risk. SRC with high number of Days receivable and Days inventory, the Net days working
capital increased regardless of the growth of Days payable. CSM’s Net days working capital was
also higher than that of DRC.
In general, DRC is the company with lowest short-term liquidity risk among the 3 large
competitors in rubber industry in the period of 2007-2010.
5.2. Solvency risk
After looking at the short term liquidity risk, we should also pay attention to the long term
solvency risk to have a better view about the financial health of DRC Company. This part
includes examining 6 ratios: Debt/ TA, Debt/Equity, L-T Debt/L-T Capital, L-T Debt/SE,
Interest coverage ratios, and OCF/TL
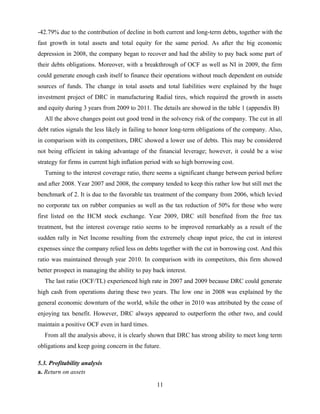
Table 4: Solvency risk ratios
From the table above, it is seen that the first four ratios illustrate the degree of debt usage by
the company. And it is easy to realize this group of ratios shared the same trend: rather high in
the first 2 years and decreased dramatically in the last 2 years. The reason came from the sudden
decrease in Total Liabilities in year 2009 and 2010, especially in year 2009 with change of
10
Year DRC SRC CSM
2007 2008 2009 2010 Ave. 2007 2008 2009 2010 2007 2008 2009 2010
D/A 0.643 0.648 0.29 0.312 0.47 0.73 0.77 0.52 0.43 0.67 0.75 0.59 0.58
D/E 1.802 1.845 1.409 1.455 1.63 2.34 3.27 1.09 0.75 2.41 2.93 1.47 1.4
L-T Debt/ L-T Cap 0.354 0.306 0.072 0.055 0.20 0.23 0.366 0.146 0.69 0.28 0.35 0.133 0.097
L-T Debt/Equity 0.547 0.441 0.078 0.058 0.28 0.41 0.58 0.17 0.07 0.37 0.54 0.15 0.11
Interest coverage ratio4.21 2.15 29.79 30.03 16.55 5.8 N/A 8.3 4.74 2.36 1.028 1.634 1.573
OCF/Total Liabilities 2.639 0.237 1.311 0.167 1.09 1.86 0.035 0.573 0.261 0.16 -0.326 0.553 0.037
-42.79% due to the contribution of decline in both current and long-term debts, together with the
fast growth in total assets and total equity for the same period. As after the big economic
depression in 2008, the company began to recover and had the ability to pay back some part of
their debts obligations. Moreover, with a breakthrough of OCF as well as NI in 2009, the firm
could generate enough cash itself to finance their operations without much dependent on outside
sources of funds. The change in total assets and total liabilities were explained by the huge
investment project of DRC in manufacturing Radial tires, which required the growth in assets
and equity during 3 years from 2009 to 2011. The details are showed in the table 1 (appendix B)
All the above changes point out good trend in the solvency risk of the company. The cut in all
debt ratios signals the less likely in failing to honor long-term obligations of the company. Also,
in comparison with its competitors, DRC showed a lower use of debts. This may be considered
not being efficient in taking advantage of the financial leverage; however, it could be a wise
strategy for firms in current high inflation period with so high borrowing cost.
Turning to the interest coverage ratio, there seems a significant change between period before
and after 2008. Year 2007 and 2008, the company tended to keep this rather low but still met the
benchmark of 2. It is due to the favorable tax treatment of the company from 2006, which levied
no corporate tax on rubber companies as well as the tax reduction of 50% for those who were
first listed on the HCM stock exchange. Year 2009, DRC still benefited from the free tax
treatment, but the interest coverage ratio seems to be improved remarkably as a result of the
sudden rally in Net Income resulting from the extremely cheap input price, the cut in interest
expenses since the company relied less on debts together with the cut in borrowing cost. And this
ratio was maintained through year 2010. In comparison with its competitors, this firm showed
better prospect in managing the ability to pay back interest.
The last ratio (OCF/TL) experienced high rate in 2007 and 2009 because DRC could generate
high cash from operations during these two years. The low one in 2008 was explained by the
general economic downturn of the world, while the other in 2010 was attributed by the cease of
enjoying tax benefit. However, DRC always appeared to outperform the other two, and could
maintain a positive OCF even in hard times.
From all the analysis above, it is clearly shown that DRC has strong ability to meet long term
obligations and keep going concern in the future.
5.3. Profitability analysis
a. Return on assets
11
The full overlook on the profitability of Danang Rubber company can be achieved by
comparing its profit figures with its main competitors, Southern Rubber company (CSM) and the
Sao Vang Rubber company (SRC).
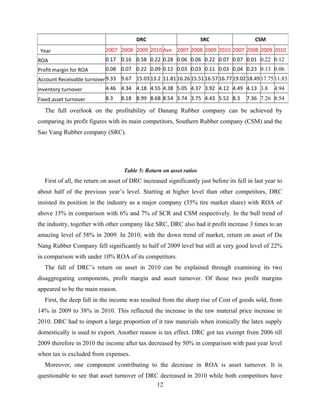
Table 5: Return on asset ratios
First of all, the return on asset of DRC increased significantly just before its fell in last year to
about half of the previous year’s level. Starting at higher level than other competitors, DRC
insisted its position in the industry as a major company (35% tire market share) with ROA of
above 15% in comparison with 6% and 7% of SCR and CSM respectively. In the bull trend of
the industry, together with other company like SRC, DRC also had it profit increase 3 times to an
amazing level of 58% in 2009. In 2010, with the down trend of market, return on asset of Da
Nang Rubber Company fell significantly to half of 2009 level but still at very good level of 22%
in comparison with under 10% ROA of its competitors.
The fall of DRC’s return on asset in 2010 can be explained through examining its two
disaggregating components, profit margin and asset turnover. Of those two profit margins
appeared to be the main reason.
First, the deep fall in the income was resulted from the sharp rise of Cost of goods sold, from
14% in 2009 to 38% in 2010. This reflected the increase in the raw material price increase in
2010. DRC had to import a large proportion of it raw materials when ironically the latex supply
domestically is used to export. Another reason is tax effect. DRC got tax exempt from 2006 till
2009 therefore in 2010 the income after tax decreased by 50% in comparison with past year level
when tax is excluded from expenses.
Moreover, one component contributing to the decrease in ROA is asset turnover. It is
questionable to see that asset turnover of DRC decreased in 2010 while both competitors have
12
DRC SRC CSM
Year 2007 2008 2009 2010 Ave 2007 2008 2009 2010 2007 2008 2009 2010
ROA 0.17 0.16 0.58 0.22 0.28 0.06 0.06 0.22 0.07 0.07 0.01 0.22 0.12
Profit margin for ROA 0.08 0.07 0.22 0.09 0.12 0.03 0.03 0.11 0.03 0.04 0.23 0.13 0.06
Account Receivable turnover9.33 9.67 15.03 13.2 11.81 16.26 15.5116.57 16.7719.02 18.4917.7511.83
Inventory turnover 4.46 4.34 4.18 4.55 4.38 5.05 4.37 3.92 4.12 4.49 4.13 3.8 4.94
Fixed asset turnover 8.3 8.18 8.99 8.68 8.54 3.74 3.75 4.43 5.52 8.3 7.36 7.26 8.54
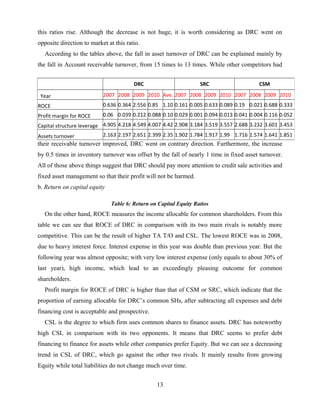
this ratios rise. Although the decrease is not huge, it is worth considering as DRC went on
opposite direction to market at this ratio.
According to the tables above, the fall in asset turnover of DRC can be explained mainly by
the fall in Account receivable turnover, from 15 times to 13 times. While other competitors had
their receivable turnover improved, DRC went on contrary direction. Furthermore, the increase
by 0.5 times in inventory turnover was offset by the fall of nearly 1 time in fixed asset turnover.
All of those above things suggest that DRC should pay more attention to credit sale activities and
fixed asset management so that their profit will not be harmed.
b. Return on capital equity
Table 6: Return on Capital Equity Ratios
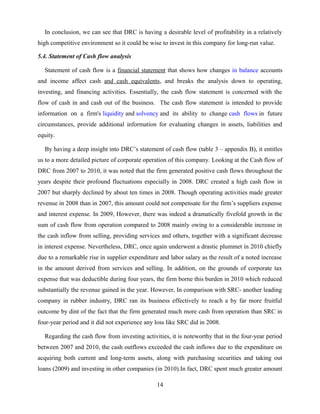
On the other hand, ROCE measures the income allocable for common shareholders. From this
table we can see that ROCE of DRC in comparison with its two main rivals is notably more
competitive. This can be the result of higher TA T/O and CSL. The lowest ROCE was in 2008,
due to heavy interest force. Interest expense in this year was double than previous year. But the
following year was almost opposite; with very low interest expense (only equals to about 30% of
last year), high income, which lead to an exceedingly pleasing outcome for common
shareholders.
Profit margin for ROCE of DRC is higher than that of CSM or SRC, which indicate that the
proportion of earning allocable for DRC’s common SHs, after subtracting all expenses and debt
financing cost is acceptable and prospective.
CSL is the degree to which firm uses common shares to finance assets. DRC has noteworthy
high CSL in comparison with its two opponents. It means that DRC seems to prefer debt
financing to finance for assets while other companies prefer Equity. But we can see a decreasing
trend in CSL of DRC, which go against the other two rivals. It mainly results from growing
Equity while total liabilities do not change much over time.
13
DRC SRC CSM
Year 2007 2008 2009 2010 Ave. 2007 2008 2009 2010 2007 2008 2009 2010
ROCE 0.636 0.364 2.556 0.85 1.10 0.161 0.005 0.633 0.089 0.19 0.021 0.688 0.333
Profit margin for ROCE 0.06 0.039 0.212 0.088 0.10 0.029 0.001 0.094 0.013 0.041 0.004 0.116 0.052
Capital structure leverage 4.905 4.218 4.549 4.007 4.42 2.908 3.184 3.519 3.557 2.688 3.232 3.601 3.453
Assets turnover 2.163 2.197 2.651 2.399 2.35 1.902 1.784 1.917 1.99 1.716 1.574 1.641 1.851
In conclusion, we can see that DRC is having a desirable level of profitability in a relatively
high competitive environment so it could be wise to invest in this company for long-run value.
5.4. Statement of Cash flow analysis
Statement of cash flow is a financial statement that shows how changes in balance accounts
and income affect cash and cash equivalents, and breaks the analysis down to operating,
investing, and financing activities. Essentially, the cash flow statement is concerned with the
flow of cash in and cash out of the business. The cash flow statement is intended to provide
information on a firm's liquidity and solvency and its ability to change cash flows in future
circumstances, provide additional information for evaluating changes in assets, liabilities and
equity.
By having a deep insight into DRC’s statement of cash flow (table 3 – appendix B), it entitles
us to a more detailed picture of corporate operation of this company. Looking at the Cash flow of
DRC from 2007 to 2010, it was noted that the firm generated positive cash flows throughout the
years despite their profound fluctuations especially in 2008. DRC created a high cash flow in
2007 but sharply declined by about ten times in 2008. Though operating activities made greater
revenue in 2008 than in 2007, this amount could not compensate for the firm’s suppliers expense
and interest expense. In 2009, However, there was indeed a dramatically fivefold growth in the
sum of cash flow from operation compared to 2008 mainly owing to a considerable increase in
the cash inflow from selling, providing services and others, together with a significant decrease
in interest expense. Nevertheless, DRC, once again underwent a drastic plummet in 2010 chiefly
due to a remarkable rise in supplier expenditure and labor salary as the result of a noted increase
in the amount derived from services and selling. In addition, on the grounds of corporate tax
expense that was deductible during four years, the firm borne this burden in 2010 which reduced
substantially the revenue gained in the year. However, In comparison with SRC- another leading
company in rubber industry, DRC ran its business effectively to reach a by far more fruitful
outcome by dint of the fact that the firm generated much more cash from operation than SRC in
four-year period and it did not experience any loss like SRC did in 2008.
Regarding the cash flow from investing activities, it is noteworthy that in the four-year period
between 2007 and 2010, the cash outflows exceeded the cash inflows due to the expenditure on
acquiring both current and long-term assets, along with purchasing securities and taking out
loans (2009) and investing in other companies (in 2010).In fact, DRC spent much greater amount
14
of cash on investing activities compared with SRC especially in 2008 when DRC poured into
investment about 100 billion VND, which was five times more than SRC spent in that year.
Nevertheless, during those years, DRC actually made some proceeds from sale of several fixed
assets, retaking the lent amount and revenue from investment that could compensate partly for
spending on fixed assets.
In terms of financial activities, cash flows generated were negative for three years apart from
2010. From 2007 to 2010, DRC paid out large amount of short-term and long-term borrowings
which imply that the firm relied much on outside financing for fixed assets purchase. Moreover,
it was accompanied by dividends paid out from 2008 to 2010 that made the amount received
back from short-term borrowers unable to compensate for. Notwithstanding, exclusively in 2010,
since the dividend amount to be paid out for shareholders was reduced notably for the purpose of
investing in some potential plans, together with a slight increase in the amount repaid by
borrowers, the total cash flow from financing activities in 2010 brought in a bright picture. To
compare with SRC, although this company ‘s losses over the years were not so huge as DRC,
even SRC’s financing activities yielded a positively large amount of cash in a year of financial
disaster ( 2008), but DRC surpassed SRC spectacularly in 2010 by roughly ten times.
After all transactions relating to operating, investing and financing, the net change in cash
flow were positive at all except for the figure in 2008 due to some certain impact from financial
calamity worldwide. This scenario was actually desired to its rival – SRC for the reason that
SRC’s net change was negative in all of four years.
6. Valuation
6.1. Forecasting Income Statements
a. Sales and COGS
According to the statistics calculated over a 4 year period, DRC’s sale growths were
approximately 26.3%(2007), 10.32%(2008), 40.64%(2009), 19.01%(2010) and about 21.46% as
the statistics calculated throughout 3 quarters of the year 2011. Based on the information from
VnEconomy, the average economic growth rate in Vietnam in 2010 was roughly 6.78%,
however it was then reduced to about 5.57% during the first six month of year 2011 (Report
122/BC-CP). In addition, from Economy and Forecast review, Vietnam’s economic growth rate
is projected to be 6.5% in 2012. Clearly, there is a positive sign in the growth rate perspective
15
which can rely on to expect for an even more profitable scenario in 2012. Moreover, in the
article wrote by Pham The An (2011), the author analyzed that the inflation rate may continue to
increase in the last period of this year but it will not rise so dramatically like the first months of
the year. Especially, DRC is intend to launch a new product that is designed and installed
professionally during the year 2011.This product is promisingly hoped to raise the firm revenue
as a result of attracting an increasing number of customers and expand its market share.
Notwithstanding, the new product also costs an amount for advertising and some other expenses.
Therefore, taking all these matters into consideration, we forecast the next year’s net sale growth
to be about 22% compared with 2011. After one year, when the new product gains its customers’
recognition and adjusts itself to the market, we expect the sale growth will go up by 2%,
reaching 24% in 2013. This trend, however, is anticipated not to continue in the period from
2014 to 2016 on the ground that the new product may lose its competitive advantage gradually as
time goes by or it cannot live up to the customers’ expectation as they hope. Furthermore, taking
unpredictable ups and downs in the economy as a whole into account, it is probable that the sale
growth of DRC Company may drop to approximately 20%. The gross sales will be derived from
the fact that net sales account for about 98% of gross sales revenue.
In forecasting operating expense, after considering historical figures from 2007 to 2009, the
average amount of Cost of goods sold was about 84.79% of the gross revenue. However, because
of the launch of the new product, the company may have to include other expenditures. Thus, it
might be possible that the operating expense is 85% of the gross profit on average.
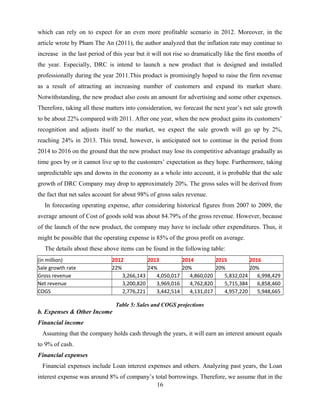
The details about these above items can be found in the following table:
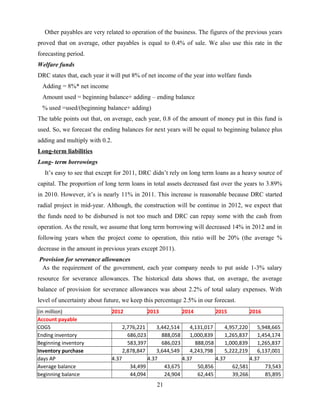
(in million) 2012 2013 2014 2015 2016
Sale growth rate 22% 24% 20% 20% 20%
Gross revenue 3,266,143 4,050,017 4,860,020 5,832,024 6,998,429
Net revenue 3,200,820 3,969,016 4,762,820 5,715,384 6,858,460
COGS 2,776,221 3,442,514 4,131,017 4,957,220 5,948,665
Table 5: Sales and COGS projections
b. Expenses & Other Income
Financial income
Assuming that the company holds cash through the years, it will earn an interest amount equals
to 9% of cash.
Financial expenses
Financial expenses include Loan interest expenses and others. Analyzing past years, the Loan
interest expense was around 8% of company’s total borrowings. Therefore, we assume that in the
16
next 5 years, it will be at same level towards total short-term and long-term borrowings
(calculated by 8% of average total borrowings on balance sheet)
Selling and administrative expenses
The selling and administrative expense are expected to experienced the same trend as sale
growth, with 2 first years high and gets to stable stage in later years. Taking into consideration of
average percentage of these two expenses to sale level, we project selling and admin costs as
follow:
- Selling expenses: 2.5% 2.0% 1.5% 1.5% 1.5%
- Administrative expenses: 1.8% 1.7% 1.4% 1.4% 1.4%
Other income
Other income is assumed to be 0.27% of net sales revenue during the next 5 years.
Other expenses
Other expenses are estimated at 0.18% of net sales revenue from 2012 to 2016.
6.2. Forecasting Balance sheet
Before coming to the valuation of RDC to decide whether this company is fairly priced or not,
we have to estimate financial statements up to a certain point in the future. We choose period
2011-2016 as our forecasting horizon. The FS of 2011 will be estimated by using extrapolation
from the data of 3rd
quarter, whereas the following years data will be projected using the
assumptions below.
a. Projecting assets
Inventories
We base on the inventory turnover ratio to forecast average inventory for each year, and then
derive the ending balance of the same year. The inventory turnover of 4.37 are kept constant and
used as the key forecasting items.
Projecting fixed assets
The fixed asset of DRC composes of three main items: tangible and intangible fixed assets, and
construction in progress. However, for the purpose of simplicity, we just make the projection for
total fixed assets without breaking down them to smaller items. We first estimate net fixed assets
as percentage of sales, deriving from the historical average fixed asset turnover of 8.5. Average
useful life of PPE is estimated by the formula below and result in 15.8 years:
17
Average useful life = PPE at cost /Depreciation of current year
From all the given data about net fixed asset, accumulated depreciation, and average useful
life, we calculate annual Depreciation by:
Annual Depreciation =
And finally the PPE at cost is estimated by summing up the net fixed asset and accumulated
depreciation for the current year as the table below has detailed
Long-term investment
Looking at the historical trend of this investment category of this company, the level of
investment seems to be kept constant for several years before taking any changes. Thus, we
assume that Long-term investment in further years should keep the balance of that in 2011.
Cash, Account Receivable, other current and fixed assets
In projecting these three items, we all base on the proportion to total assets to forecast for the
consequent years. The table below shows the detail of historical trends and the average number
of these ratios
Although it is more preferable that account receivable should increase with sale growth
through future years. However, it should be noted that the Account Receivable of 2011 is
unusual high, and we do not expect this trend to happen again. As a result, using ART will affect
a lot the consequent years’ ending balance. To put it another way, the ending AR is derived
directly from the percentage of total assets, with the decreasing trend as noted in the table.
Turing to forecasting cash, as it is preferable that the firm should keep some cash to maintain
liquidity, we project cash to increase around the average percentage of TA of 4.6%, with little
decrease to 3% in 2012 since in further years, the company does not need to hold a lot of cash
when the Radial project and the new product introduction phase are all over. The same trend is
expected to happen with other current and fixed assets with the first year’s balance is around
average number and then falls as fund is released from the necessity of making early payments
18
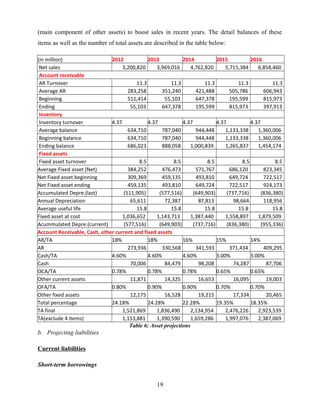
(main component of other assets) to boost sales in recent years. The detail balances of these
items as well as the number of total assets are described in the table below:
(in million) 2012 2013 2014 2015 2016
Net sales 3,200,820 3,969,016 4,762,820 5,715,384 6,858,460
Account receivable
AR Turnover 11.3 11.3 11.3 11.3 11.3
Average AR 283,258 351,240 421,488 505,786 606,943
Beginning 511,414 55,103 647,378 195,599 815,973
Ending 55,103 647,378 195,599 815,973 397,913
Inventory
Inventory turnover 4.37 4.37 4.37 4.37 4.37
Average balance 634,710 787,040 944,448 1,133,338 1,360,006
Beginning balance 634,710 787,040 944,448 1,133,338 1,360,006
Ending balance 686,023 888,058 1,000,839 1,265,837 1,454,174
Fixed assets
Fixed asset turnover 8.5 8.5 8.5 8.5 8.5
Average Fixed asset (Net) 384,252 476,473 571,767 686,120 823,345
Net Fixed asset beginning 309,369 459,135 493,810 649,724 722,517
Net Fixed asset ending 459,135 493,810 649,724 722,517 924,173
Accumulated Depre.(last) (511,905) (577,516) (649,903) (737,716) (836,380)
Annual Depreciation 65,611 72,387 87,813 98,664 118,956
Average useful life 15.8 15.8 15.8 15.8 15.8
Fixed asset at cost 1,036,652 1,143,713 1,387,440 1,558,897 1,879,509
Acummulated Depre.(current) (577,516) (649,903) (737,716) (836,380) (955,336)
Account Receivable, Cash, other current and fixed assets
AR/TA 18% 18% 16% 15% 14%
AR 273,936 330,568 341,593 371,434 409,295
Cash/TA 4.60% 4.60% 4.60% 3.00% 3.00%
Cash 70,006 84,479 98,208 74,287 87,706
OCA/TA 0.78% 0.78% 0.78% 0.65% 0.65%
Other current assets 11,871 14,325 16,653 16,095 19,003
OFA/TA 0.80% 0.90% 0.90% 0.70% 0.70%
Other fixed assets 12,175 16,528 19,215 17,334 20,465
Total percentage 24.18% 24.28% 22.28% 19.35% 18.35%
TA final 1,521,869 1,836,490 2,134,954 2,476,226 2,923,539
TA(exclude 4 items) 1,153,881 1,390,590 1,659,286 1,997,076 2,387,069
Table 6: Asset projections
b. Projecting liabilities
Current liabilities
Short-term borrowings
19
In the past DRC used to use much short-term borrowings, around 40% or more of total assets.
But 3 nearest years, this ratio decreased much to just above 10%. It may be because the volatility
of the economy and the some nuisance caused by such a big radial project. With the confidence
about the more stable macro-factors and the prospective of DRC we increase the weight of short-
term borrowings in total assets to 30% in 2012, 40% for the rest years.
Account payable (to suppliers)
The amount of account payable will be determined by the future credit purchase of company.
In the last 4 years, the days of account payable were just above 4, except 7.6 in 2007. The
average days account payable, excluding 2007, was 4.67. We assume that DRC will maintain
this figure in the future. In this case, to forecast account payable, firstly, we forecast the
inventory purchase for each year and then, use days account payable to calculate.
Advances from customers, payables to employees, short-term provision
Due to the fact that 2 first items are directly related to operation of business, we forecast them
by let them growth with sale growth rates.
About short-term provision, it only appears in 2011 with small amount. So that we charge it as
nonrecurring items
Taxes and other payables to the State Budget
This account includes tax payable (income tax, VAT) and others fees. It is varies with many
other factors (tax rate, tax settlement, tax payment,..). From the data of recent year, this item is
not significant, only about 0 – 1.86% of total assets. So, in the following year, we will estimate it
as 1% of total assets
Accrued expenses
After 3 years disappearing, this item recurring in 2011 with very higher amount (0.8% of
sale). We believe that the reason is that the radial project has taken too much capital of DRC.
And, in the future, when the project comes to finish and operate, this item will decrease.
Consequently, we forecast it as descend percentages of sale, 0.2% in 2012, 0.1% in 2013, 0.05%
in 2014 & 2015, and 0% in 2016.
Other payables
20
Other payables are very related to operation of the business. The figures of the previous years
proved that on average, other payables is equal to 0.4% of sale. We also use this rate in the
forecasting period.
Welfare funds
DRC states that, each year it will put 8% of net income of the year into welfare funds
Adding = 8%* net income
Amount used = beginning balance+ adding – ending balance
% used =used/(beginning balance+ adding)
The table points out that, on average, each year, 0.8 of the amount of money put in this fund is
used. So, we forecast the ending balances for next years will be equal to beginning balance plus
adding and multiply with 0.2.
Long-term liabilities
Long- term borrowings
It’s easy to see that except for 2011, DRC didn’t rely on long term loans as a heavy source of
capital. The proportion of long term loans in total assets decreased fast over the years to 3.89%
in 2010. However, it’s is nearly 11% in 2011. This increase is reasonable because DRC started
radial project in mid-year. Although, the construction will be continue in 2012, we expect that
the funds need to be disbursed is not too much and DRC can repay some with the cash from
operation. As the result, we assume that long term borrowing will decreased 14% in 2012 and in
following years when the project come to operation, this ratio will be 20% (the average %
decrease in the amount in previous years except 2011).
Provision for severance allowances
As the requirement of the government, each year company needs to put aside 1-3% salary
resource for severance allowances. The historical data shows that, on average, the average
balance of provision for severance allowances was about 2.2% of total salary expenses. With
level of uncertainty about future, we keep this percentage 2.5% in our forecast.
(in million) 2012 2013 2014 2015 2016
Account payable
COGS 2,776,221 3,442,514 4,131,017 4,957,220 5,948,665
Ending inventory 686,023 888,058 1,000,839 1,265,837 1,454,174
Beginning inventory 583,397 686,023 888,058 1,000,839 1,265,837
Inventory purchase 2,878,847 3,644,549 4,243,798 5,222,219 6,137,001
days AP 4.37 4.37 4.37 4.37 4.37
Average balance 34,499 43,675 50,856 62,581 73,543
beginning balance 44,094 24,904 62,445 39,266 85,895
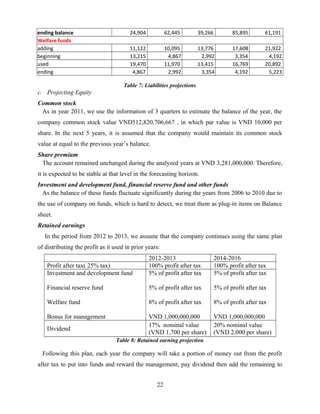
21
ending balance 24,904 62,445 39,266 85,895 61,191
Welfare funds
adding 11,122 10,095 13,776 17,608 21,922
beginning 13,215 4,867 2,992 3,354 4,192
used 19,470 11,970 13,415 16,769 20,892
ending 4,867 2,992 3,354 4,192 5,223
Table 7: Liabilities projections
c. Projecting Equity
Common stock
As in year 2011, we use the information of 3 quarters to estimate the balance of the year, the
company common stock value VND512,820,706,667 , in which par value is VND 10,000 per
share. In the next 5 years, it is assumed that the company would maintain its common stock
value at equal to the previous year’s balance.
Share premium
The account remained unchanged during the analyzed years at VND 3,281,000,000. Therefore,
it is expected to be stable at that level in the forecasting horizon.
Investment and development fund, financial reserve fund and other funds
As the balance of these funds fluctuate significantly during the years from 2006 to 2010 due to
the use of company on funds, which is hard to detect, we treat them as plug-in items on Balance
sheet.
Retained earnings
In the period from 2012 to 2013, we assume that the company continues using the same plan
of distributing the profit as it used in prior years:
2012-2013 2014-2016
Profit after tax( 25% tax) 100% profit after tax 100% profit after tax
Investment and development fund
Financial reserve fund
Welfare fund
Bonus for management
5% of profit after tax
8% of profit after tax
VND 1,000,000,000
5% of profit after tax
8% of profit after tax
VND 1,000,000,000
Dividend
17% nominal value
(VND 1,700 per share)
20% nominal value
(VND 2,000 per share)
Table 8: Retained earning projection
Following this plan, each year the company will take a portion of money out from the profit
after tax to put into funds and reward the management, pay dividend then add the remaining to
22
the retained earnings balance of the very previous year (see table 2 & 3, appendix A). Therefore
net income in statement of cashflows will be lower than profit after tax.
Given all the balance sheet and the income statement estimated above, the cash flows
statements are derived for the year from 2011-2016, and then they will be used as inputs for
valuation of the company.
6.3. Free cash flow valuation
a. Calculation of Free Cash Flow to common equity holders
The details about FCF calculation are provided in Appendix D
b. Valuation
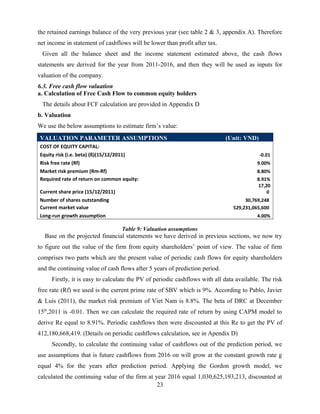
We use the below assumptions to estimate firm’s value:
VALUATION PARAMETER ASSUMPTIONS (Unit: VND)
COST OF EQUITY CAPITAL:
Equity risk (i.e. beta) (ß)(15/12/2011) -0.01
Risk free rate (Rf) 9.00%
Market risk premium (Rm-Rf) 8.80%
Required rate of return on common equity: 8.91%
Current share price (15/12/2011)
17,20
0
Number of shares outstanding 30,769,248
Current market value 529,231,065,600
Long-run growth assumption 4.00%
Table 9: Valuation assumptions
Base on the projected financial statements we have derived in previous sections, we now try
to figure out the value of the firm from equity shareholders’ point of view. The value of firm
comprises two parts which are the present value of periodic cash flows for equity shareholders
and the continuing value of cash flows after 5 years of prediction period.
Firstly, it is easy to calculate the PV of periodic cashflows with all data available. The risk
free rate (Rf) we used is the current prime rate of SBV which is 9%. According to Pablo, Javier
& Luis (2011), the market risk premium of Viet Nam is 8.8%. The beta of DRC at December
15th
,2011 is -0.01. Then we can calculate the required rate of return by using CAPM model to
derive Re equal to 8.91%. Periodic cashflows then were discounted at this Re to get the PV of
412,180,668,419. (Details on periodic cashflows calculation, see in Apendix D)
Secondly, to calculate the continuing value of cashflows out of the prediction period, we
use assumptions that is future cashflows from 2016 on will grow at the constant growth rate g
equal 4% for the years after prediction period. Applying the Gordon growth model, we
calculated the continuing value of the firm at year 2016 equal 1,030,625,193,213, discounted at
23
Re to get the present value of 672,762,317,010. Here, taking into account midyear accounting
effect, we can derive to the total PV of all cashflows or the value of firm at present equal
1,133,250,071,855.
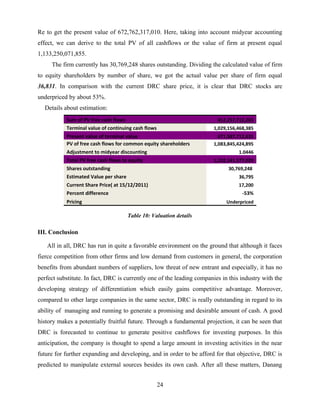
The firm currently has 30,769,248 shares outstanding. Dividing the calculated value of firm
to equity shareholders by number of share, we got the actual value per share of firm equal
36,831. In comparison with the current DRC share price, it is clear that DRC stocks are
underpriced by about 53%.
Details about estimation:
Sum of PV free cash flows 412,257,712,265
Terminal value of continuing cash flows 1,029,156,468,385
Present value of terminal value 671,587,712,631
PV of free cash flows for common equity shareholders 1,083,845,424,895
Adjustment to midyear discounting 1.0446
Total PV free cash flows to equity 1,132,141,577,029
Shares outstanding 30,769,248
Estimated Value per share 36,795
Current Share Price( at 15/12/2011) 17,200
Percent difference -53%
Pricing Underpriced
Table 10: Valuation details
III. Conclusion
All in all, DRC has run in quite a favorable environment on the ground that although it faces
fierce competition from other firms and low demand from customers in general, the corporation
benefits from abundant numbers of suppliers, low threat of new entrant and especially, it has no
perfect substitute. In fact, DRC is currently one of the leading companies in this industry with the
developing strategy of differentiation which easily gains competitive advantage. Moreover,
compared to other large companies in the same sector, DRC is really outstanding in regard to its
ability of managing and running to generate a promising and desirable amount of cash. A good
history makes a potentially fruitful future. Through a fundamental projection, it can be seen that
DRC is forecasted to continue to generate positive cashflows for investing purposes. In this
anticipation, the company is thought to spend a large amount in investing activities in the near
future for further expanding and developing, and in order to be afford for that objective, DRC is
predicted to manipulate external sources besides its own cash. After all these matters, Danang
24
Rubber joint stock company deserves attention and investment from both domestic and
international investors.

REFERENCE
Anh Quan, 2011, Tăng trưởng GDP năm 2010 đạt 6,78%, [online] Available at URL:
http://vneconomy.vn/2010122901294195p0c9920/tang-truong-gdp-nam-2010-
dat-678.htm
Aswash, D.2011, ‘Equity risk premium (ERP): Determinants, estimations and implications’,
Stern school of Business.
DTVK, 2011, DRC không triển khai các dự án bất động sản, [online] Available at URL:
http://www.vinacorp.vn/news/drc-khong-trien-khai-cac-du-an-bat-dong-san/ct-480564
25
Nguyen Ngoc Tuan, 2011, ‘Công ty Cổ phần Cao su Đà Nẵng (HOSE:DRC)’
Pablo Fernandez, Javier Aguirreamalloa, Luis Corres, 2011, ‘Market risk premium used in 56
countries in 2011: a survey with 6,014 answers’
Pham The An, 2011, Kinh tế Việt Nam còn diễn biến khó lường, [online] Available at URL:
http://vef.vn/2011-08-22-kich-ban-nao-cho-kinh-te-vn-cuoi-2011-va-nam-2012-
Thanh Nu, 2011, DRC đặt kế hoạch lãi ròng 33.75 tỷ đồng trong quý 3, [online] Available at
URL:http://bantinchungkhoan.net/tin-chung-khoan-trong-nuoc/3992-drc-t-k-hoch-lai-
rong-3375-t-ng-trong-quy-3.html
2011, Phấn đấu tốc độ tăng trưởng kinh tế khoảng 6,5% trong năm 2012, [online]
Available at URL: http://kinhtevadubao.vn/p0c281n9932/phan-dau-toc-do-tang-
truong-kinh-te-khoang-65-trong-nam-2012.htm
2011, Dễ sập bẫy với lợi nhuận đột biến, [online] Available at URL: http://www.phanmem-
ketoan.com/2011/08/de-sap-bay-voi-loi-nhuan-ot-bien.html
2011, HOSE:DRC - Công ty Cổ phần Cao su Đà Nẵng, [online] Available at URL:
http://www.vinacorp.vn/stock/hose-drc/cao-su-da-nang/gioi-thieu
www.drc.com.vn
http://www.stockbiz.vn/
http://stox.vn/stox/
26

More Related Content

What's hot

Competitive analysis Apollo tyres
Competitive analysis Apollo tyresCompetitive analysis Apollo tyres
Competitive analysis Apollo tyres
PratapZachariah
 
Project report on apollo tyres ltd
Project report on apollo tyres ltdProject report on apollo tyres ltd
Project report on apollo tyres ltd
chauhansunny
 
Presentation business michelin
Presentation business michelinPresentation business michelin
Presentation business michelinAnge Baks
 
Saral Gyan Hidden Gem - Aug 2016
Saral Gyan Hidden Gem - Aug 2016Saral Gyan Hidden Gem - Aug 2016
Saral Gyan Hidden Gem - Aug 2016
SaralGyanTeam
 
Saral Gyan Hidden Gem - Feb 2016
Saral Gyan Hidden Gem - Feb 2016Saral Gyan Hidden Gem - Feb 2016
Saral Gyan Hidden Gem - Feb 2016
SaralGyanTeam
 
MRF ,Kottayam
MRF ,KottayamMRF ,Kottayam
MRF ,Kottayam
jincy joy
 
Mrf presentation
Mrf presentation Mrf presentation
Mrf presentation
Venkatesh Dixit
 
Final tyre
Final tyreFinal tyre
Final tyre
Gagan Pareek, PMP
 
A REPORT ON ORGANIZATION STUDY AT MRF. LTD, KOTTAYAM by Subin surendran organ...
A REPORT ON ORGANIZATION STUDY AT MRF. LTD, KOTTAYAM by Subin surendran organ...A REPORT ON ORGANIZATION STUDY AT MRF. LTD, KOTTAYAM by Subin surendran organ...
A REPORT ON ORGANIZATION STUDY AT MRF. LTD, KOTTAYAM by Subin surendran organ...
subinsurendran7
 
Jk tyre and industry ltd Final Report
 Jk tyre and industry ltd Final Report Jk tyre and industry ltd Final Report
Jk tyre and industry ltd Final Report
Bhavyaruna Chittajallu
 
Projest report apollo tyres
Projest report apollo tyresProjest report apollo tyres
Projest report apollo tyres
VasuSaxena5
 
Shilpa organiations study at mrf tyres
Shilpa organiations study at mrf tyresShilpa organiations study at mrf tyres
Shilpa organiations study at mrf tyresLibu Thomas
 
J.k.tyre ppt
J.k.tyre pptJ.k.tyre ppt
J.k.tyre ppt
Abhishek Maity
 
CEAT
CEATCEAT
Apollo tyres
Apollo tyresApollo tyres
Apollo tyres
Akhil Arora
 
Market Research Report : Tire industry in india 2014 - Sample
Market Research Report : Tire industry in india 2014 - SampleMarket Research Report : Tire industry in india 2014 - Sample
Market Research Report : Tire industry in india 2014 - Sample
Netscribes, Inc.
 
Indian Tyre Industry
Indian Tyre IndustryIndian Tyre Industry
Indian Tyre Industry
Abhishek Kulshrestha
 
Sharaf organiations study at appolo tyres
Sharaf organiations study at appolo tyresSharaf organiations study at appolo tyres
Sharaf organiations study at appolo tyresLibu Thomas
 
GT Radial Marketing Plan - Expansion into the EUROPEAN Market
GT Radial Marketing Plan - Expansion into the EUROPEAN MarketGT Radial Marketing Plan - Expansion into the EUROPEAN Market
GT Radial Marketing Plan - Expansion into the EUROPEAN MarketJoseph Enrico
 

What's hot (20)

Competitive analysis Apollo tyres
Competitive analysis Apollo tyresCompetitive analysis Apollo tyres
Competitive analysis Apollo tyres
 
Project report on apollo tyres ltd
Project report on apollo tyres ltdProject report on apollo tyres ltd
Project report on apollo tyres ltd
 
Presentation business michelin
Presentation business michelinPresentation business michelin
Presentation business michelin
 
Saral Gyan Hidden Gem - Aug 2016
Saral Gyan Hidden Gem - Aug 2016Saral Gyan Hidden Gem - Aug 2016
Saral Gyan Hidden Gem - Aug 2016
 
Saral Gyan Hidden Gem - Feb 2016
Saral Gyan Hidden Gem - Feb 2016Saral Gyan Hidden Gem - Feb 2016
Saral Gyan Hidden Gem - Feb 2016
 
MRF ,Kottayam
MRF ,KottayamMRF ,Kottayam
MRF ,Kottayam
 
Mrf presentation
Mrf presentation Mrf presentation
Mrf presentation
 
Final tyre
Final tyreFinal tyre
Final tyre
 
A REPORT ON ORGANIZATION STUDY AT MRF. LTD, KOTTAYAM by Subin surendran organ...
A REPORT ON ORGANIZATION STUDY AT MRF. LTD, KOTTAYAM by Subin surendran organ...A REPORT ON ORGANIZATION STUDY AT MRF. LTD, KOTTAYAM by Subin surendran organ...
A REPORT ON ORGANIZATION STUDY AT MRF. LTD, KOTTAYAM by Subin surendran organ...
 
Jk tyre and industry ltd Final Report
 Jk tyre and industry ltd Final Report Jk tyre and industry ltd Final Report
Jk tyre and industry ltd Final Report
 
Projest report apollo tyres
Projest report apollo tyresProjest report apollo tyres
Projest report apollo tyres
 
Shilpa organiations study at mrf tyres
Shilpa organiations study at mrf tyresShilpa organiations study at mrf tyres
Shilpa organiations study at mrf tyres
 
J.k.tyre ppt
J.k.tyre pptJ.k.tyre ppt
J.k.tyre ppt
 
CEAT
CEATCEAT
CEAT
 
Apollo tyres
Apollo tyresApollo tyres
Apollo tyres
 
Market Research Report : Tire industry in india 2014 - Sample
Market Research Report : Tire industry in india 2014 - SampleMarket Research Report : Tire industry in india 2014 - Sample
Market Research Report : Tire industry in india 2014 - Sample
 
Indian Tyre Industry
Indian Tyre IndustryIndian Tyre Industry
Indian Tyre Industry
 
Sharaf organiations study at appolo tyres
Sharaf organiations study at appolo tyresSharaf organiations study at appolo tyres
Sharaf organiations study at appolo tyres
 
13823112 jk-project
13823112 jk-project13823112 jk-project
13823112 jk-project
 
GT Radial Marketing Plan - Expansion into the EUROPEAN Market
GT Radial Marketing Plan - Expansion into the EUROPEAN MarketGT Radial Marketing Plan - Expansion into the EUROPEAN Market
GT Radial Marketing Plan - Expansion into the EUROPEAN Market
 

Similar to DRC Financial Statement Analysis report

Manufacturing of truck mud flaps
Manufacturing of truck mud flapsManufacturing of truck mud flaps
Manufacturing of truck mud flaps
Ajjay Kumar Gupta
 
comprehensive report
comprehensive report comprehensive report
comprehensive report
Selvin Doshi
 
IMC Strategy Of Premier Cement
IMC Strategy Of Premier CementIMC Strategy Of Premier Cement
IMC Strategy Of Premier Cement
Sadman Prodhan
 
New IMC Strategy Of Premier Cement
New IMC Strategy Of Premier CementNew IMC Strategy Of Premier Cement
New IMC Strategy Of Premier Cement
Sadman Prodhan
 
Cement 120322054853-phpapp02
Cement 120322054853-phpapp02Cement 120322054853-phpapp02
Cement 120322054853-phpapp02
Chirag Kalal
 
Tyre industry in india competition or collusion
Tyre industry in india competition or collusionTyre industry in india competition or collusion
Tyre industry in india competition or collusion
Pallav Prasad
 
Brazil Tire Market 2016 2026
Brazil Tire Market 2016 2026 Brazil Tire Market 2016 2026
Brazil Tire Market 2016 2026
TechSci Research
 
Indian cement industry
Indian cement industryIndian cement industry
Indian cement industry
Hitesh Munjal
 
Heidelberg cement
Heidelberg cementHeidelberg cement
Heidelberg cement
Partha Pratim Dey
 
Zuari report
Zuari reportZuari report
Zuari report
guru sai teja
 
Indian cement industry
Indian cement industryIndian cement industry
Indian cement industry
Kartik Verma
 
Himani shukla sip
Himani shukla sipHimani shukla sip
Himani shukla sip
Himani Shukla
 
ceramic industry morbi presentation by Bhavikkhakhkhar
ceramic industry morbi presentation by Bhavikkhakhkharceramic industry morbi presentation by Bhavikkhakhkhar
ceramic industry morbi presentation by Bhavikkhakhkhar
Bhavik khakhkhar
 
Sip presentation (Market Analytics of Bridges tone Tyres in Jaipur)
Sip presentation (Market Analytics of Bridges tone Tyres in Jaipur)Sip presentation (Market Analytics of Bridges tone Tyres in Jaipur)
Sip presentation (Market Analytics of Bridges tone Tyres in Jaipur)
Siddharth Bothra
 
Pidilite Industries | Company Analysis
Pidilite Industries | Company AnalysisPidilite Industries | Company Analysis
Pidilite Industries | Company Analysis
Rohan Bharaj
 
IDENTIFYING OPPORTUNITIES AND UNDERSTANDING ISSUES RELATED TO MANUFACTURING O...
IDENTIFYING OPPORTUNITIES AND UNDERSTANDING ISSUES RELATED TO MANUFACTURING O...IDENTIFYING OPPORTUNITIES AND UNDERSTANDING ISSUES RELATED TO MANUFACTURING O...
IDENTIFYING OPPORTUNITIES AND UNDERSTANDING ISSUES RELATED TO MANUFACTURING O...
Arun Keshav
 
Industry Visit Reports of RDC Concrete.pdf
Industry Visit Reports of RDC Concrete.pdfIndustry Visit Reports of RDC Concrete.pdf
Industry Visit Reports of RDC Concrete.pdf
ashrafrazamgr
 

Similar to DRC Financial Statement Analysis report (20)

Manufacturing of truck mud flaps
Manufacturing of truck mud flapsManufacturing of truck mud flaps
Manufacturing of truck mud flaps
 
comprehensive report
comprehensive report comprehensive report
comprehensive report
 
project slide show
project slide showproject slide show
project slide show
 
IMC Strategy Of Premier Cement
IMC Strategy Of Premier CementIMC Strategy Of Premier Cement
IMC Strategy Of Premier Cement
 
Birla cement!
Birla cement!Birla cement!
Birla cement!
 
New IMC Strategy Of Premier Cement
New IMC Strategy Of Premier CementNew IMC Strategy Of Premier Cement
New IMC Strategy Of Premier Cement
 
Cement 120322054853-phpapp02
Cement 120322054853-phpapp02Cement 120322054853-phpapp02
Cement 120322054853-phpapp02
 
Tyre industry in india competition or collusion
Tyre industry in india competition or collusionTyre industry in india competition or collusion
Tyre industry in india competition or collusion
 
Brazil Tire Market 2016 2026
Brazil Tire Market 2016 2026 Brazil Tire Market 2016 2026
Brazil Tire Market 2016 2026
 
Indian cement industry
Indian cement industryIndian cement industry
Indian cement industry
 
Heidelberg cement
Heidelberg cementHeidelberg cement
Heidelberg cement
 
Zuari report
Zuari reportZuari report
Zuari report
 
Indian cement industry
Indian cement industryIndian cement industry
Indian cement industry
 
Himani shukla sip
Himani shukla sipHimani shukla sip
Himani shukla sip
 
ceramic industry morbi presentation by Bhavikkhakhkhar
ceramic industry morbi presentation by Bhavikkhakhkharceramic industry morbi presentation by Bhavikkhakhkhar
ceramic industry morbi presentation by Bhavikkhakhkhar
 
Rubber
RubberRubber
Rubber
 
Sip presentation (Market Analytics of Bridges tone Tyres in Jaipur)
Sip presentation (Market Analytics of Bridges tone Tyres in Jaipur)Sip presentation (Market Analytics of Bridges tone Tyres in Jaipur)
Sip presentation (Market Analytics of Bridges tone Tyres in Jaipur)
 
Pidilite Industries | Company Analysis
Pidilite Industries | Company AnalysisPidilite Industries | Company Analysis
Pidilite Industries | Company Analysis
 
IDENTIFYING OPPORTUNITIES AND UNDERSTANDING ISSUES RELATED TO MANUFACTURING O...
IDENTIFYING OPPORTUNITIES AND UNDERSTANDING ISSUES RELATED TO MANUFACTURING O...IDENTIFYING OPPORTUNITIES AND UNDERSTANDING ISSUES RELATED TO MANUFACTURING O...
IDENTIFYING OPPORTUNITIES AND UNDERSTANDING ISSUES RELATED TO MANUFACTURING O...
 
Industry Visit Reports of RDC Concrete.pdf
Industry Visit Reports of RDC Concrete.pdfIndustry Visit Reports of RDC Concrete.pdf
Industry Visit Reports of RDC Concrete.pdf
 

More from Nguyen Thi Trang Nhung

Bài học phòng cháy chữa cháy - PCCC tại tòa nhà
Bài học phòng cháy chữa cháy - PCCC tại tòa nhàBài học phòng cháy chữa cháy - PCCC tại tòa nhà
Bài học phòng cháy chữa cháy - PCCC tại tòa nhà
Nguyen Thi Trang Nhung
 
HAILO - In the flow of Digital revolution
HAILO - In the flow of Digital revolutionHAILO - In the flow of Digital revolution
HAILO - In the flow of Digital revolution
Nguyen Thi Trang Nhung
 
Z tree experiment - The influence of the Leniency Policy in Cartel formation
Z tree experiment - The influence of the Leniency Policy  in Cartel formationZ tree experiment - The influence of the Leniency Policy  in Cartel formation
Z tree experiment - The influence of the Leniency Policy in Cartel formation
Nguyen Thi Trang Nhung
 
corporate finance - Valuation of M&A - AOL-Time Warner
corporate finance - Valuation of M&A -  AOL-Time Warner corporate finance - Valuation of M&A -  AOL-Time Warner
corporate finance - Valuation of M&A - AOL-Time Warner
Nguyen Thi Trang Nhung
 
Advanced public finance - electricity in vietnam
Advanced public finance - electricity in vietnamAdvanced public finance - electricity in vietnam
Advanced public finance - electricity in vietnam
Nguyen Thi Trang Nhung
 
GSk financial statement analysis
GSk financial statement analysisGSk financial statement analysis
GSk financial statement analysis
Nguyen Thi Trang Nhung
 
[Fsa] GSK fianacial statement analysis
[Fsa] GSK fianacial statement analysis[Fsa] GSK fianacial statement analysis
[Fsa] GSK fianacial statement analysis
Nguyen Thi Trang Nhung
 

More from Nguyen Thi Trang Nhung (7)

Bài học phòng cháy chữa cháy - PCCC tại tòa nhà
Bài học phòng cháy chữa cháy - PCCC tại tòa nhàBài học phòng cháy chữa cháy - PCCC tại tòa nhà
Bài học phòng cháy chữa cháy - PCCC tại tòa nhà
 
HAILO - In the flow of Digital revolution
HAILO - In the flow of Digital revolutionHAILO - In the flow of Digital revolution
HAILO - In the flow of Digital revolution
 
Z tree experiment - The influence of the Leniency Policy in Cartel formation
Z tree experiment - The influence of the Leniency Policy  in Cartel formationZ tree experiment - The influence of the Leniency Policy  in Cartel formation
Z tree experiment - The influence of the Leniency Policy in Cartel formation
 
corporate finance - Valuation of M&A - AOL-Time Warner
corporate finance - Valuation of M&A -  AOL-Time Warner corporate finance - Valuation of M&A -  AOL-Time Warner
corporate finance - Valuation of M&A - AOL-Time Warner
 
Advanced public finance - electricity in vietnam
Advanced public finance - electricity in vietnamAdvanced public finance - electricity in vietnam
Advanced public finance - electricity in vietnam
 
GSk financial statement analysis
GSk financial statement analysisGSk financial statement analysis
GSk financial statement analysis
 
[Fsa] GSK fianacial statement analysis
[Fsa] GSK fianacial statement analysis[Fsa] GSK fianacial statement analysis
[Fsa] GSK fianacial statement analysis
 

Recently uploaded

3.0 Project 2_ Developing My Brand Identity Kit.pptx
3.0 Project 2_ Developing My Brand Identity Kit.pptx3.0 Project 2_ Developing My Brand Identity Kit.pptx
3.0 Project 2_ Developing My Brand Identity Kit.pptx
tanyjahb
 
Improving profitability for small business
Improving profitability for small businessImproving profitability for small business
Improving profitability for small business
Ben Wann
 
falcon-invoice-discounting-a-premier-platform-for-investors-in-india
falcon-invoice-discounting-a-premier-platform-for-investors-in-indiafalcon-invoice-discounting-a-premier-platform-for-investors-in-india
falcon-invoice-discounting-a-premier-platform-for-investors-in-india
Falcon Invoice Discounting
 
Tata Group Dials Taiwan for Its Chipmaking Ambition in Gujarat’s Dholera
Tata Group Dials Taiwan for Its Chipmaking Ambition in Gujarat’s DholeraTata Group Dials Taiwan for Its Chipmaking Ambition in Gujarat’s Dholera
Tata Group Dials Taiwan for Its Chipmaking Ambition in Gujarat’s Dholera
Avirahi City Dholera
 
Discover the innovative and creative projects that highlight my journey throu...
Discover the innovative and creative projects that highlight my journey throu...Discover the innovative and creative projects that highlight my journey throu...
Discover the innovative and creative projects that highlight my journey throu...
dylandmeas
 
What are the main advantages of using HR recruiter services.pdf
What are the main advantages of using HR recruiter services.pdfWhat are the main advantages of using HR recruiter services.pdf
What are the main advantages of using HR recruiter services.pdf
HumanResourceDimensi1
 
VAT Registration Outlined In UAE: Benefits and Requirements
VAT Registration Outlined In UAE: Benefits and RequirementsVAT Registration Outlined In UAE: Benefits and Requirements
VAT Registration Outlined In UAE: Benefits and Requirements
uae taxgpt
 
FINAL PRESENTATION.pptx12143241324134134
FINAL PRESENTATION.pptx12143241324134134FINAL PRESENTATION.pptx12143241324134134
FINAL PRESENTATION.pptx12143241324134134
LR1709MUSIC
 
amptalk_RecruitingDeck_english_2024.06.05
amptalk_RecruitingDeck_english_2024.06.05amptalk_RecruitingDeck_english_2024.06.05
amptalk_RecruitingDeck_english_2024.06.05
marketing317746
 
Cree_Rey_BrandIdentityKit.PDF_PersonalBd
Cree_Rey_BrandIdentityKit.PDF_PersonalBdCree_Rey_BrandIdentityKit.PDF_PersonalBd
Cree_Rey_BrandIdentityKit.PDF_PersonalBd
creerey
 
What is the TDS Return Filing Due Date for FY 2024-25.pdf
What is the TDS Return Filing Due Date for FY 2024-25.pdfWhat is the TDS Return Filing Due Date for FY 2024-25.pdf
What is the TDS Return Filing Due Date for FY 2024-25.pdf
seoforlegalpillers
 
LA HUG - Video Testimonials with Chynna Morgan - June 2024
LA HUG - Video Testimonials with Chynna Morgan - June 2024LA HUG - Video Testimonials with Chynna Morgan - June 2024
LA HUG - Video Testimonials with Chynna Morgan - June 2024
Lital Barkan
 
ENTREPRENEURSHIP TRAINING.ppt for graduating class (1).ppt
ENTREPRENEURSHIP TRAINING.ppt for graduating class (1).pptENTREPRENEURSHIP TRAINING.ppt for graduating class (1).ppt
ENTREPRENEURSHIP TRAINING.ppt for graduating class (1).ppt
zechu97
 
Introduction to Amazon company 111111111111
Introduction to Amazon company 111111111111Introduction to Amazon company 111111111111
Introduction to Amazon company 111111111111
zoyaansari11365
 
20240425_ TJ Communications Credentials_compressed.pdf
20240425_ TJ Communications Credentials_compressed.pdf20240425_ TJ Communications Credentials_compressed.pdf
20240425_ TJ Communications Credentials_compressed.pdf
tjcomstrang
 
5 Things You Need To Know Before Hiring a Videographer
5 Things You Need To Know Before Hiring a Videographer5 Things You Need To Know Before Hiring a Videographer
5 Things You Need To Know Before Hiring a Videographer
ofm712785
 
Enterprise Excellence is Inclusive Excellence.pdf
Enterprise Excellence is Inclusive Excellence.pdfEnterprise Excellence is Inclusive Excellence.pdf
Enterprise Excellence is Inclusive Excellence.pdf
KaiNexus
 
Kseniya Leshchenko: Shared development support service model as the way to ma...
Kseniya Leshchenko: Shared development support service model as the way to ma...Kseniya Leshchenko: Shared development support service model as the way to ma...
Kseniya Leshchenko: Shared development support service model as the way to ma...
Lviv Startup Club
 
Maksym Vyshnivetskyi: PMO Quality Management (UA)
Maksym Vyshnivetskyi: PMO Quality Management (UA)Maksym Vyshnivetskyi: PMO Quality Management (UA)
Maksym Vyshnivetskyi: PMO Quality Management (UA)
Lviv Startup Club
 
The effects of customers service quality and online reviews on customer loyal...
The effects of customers service quality and online reviews on customer loyal...The effects of customers service quality and online reviews on customer loyal...
The effects of customers service quality and online reviews on customer loyal...
balatucanapplelovely
 

Recently uploaded (20)

3.0 Project 2_ Developing My Brand Identity Kit.pptx
3.0 Project 2_ Developing My Brand Identity Kit.pptx3.0 Project 2_ Developing My Brand Identity Kit.pptx
3.0 Project 2_ Developing My Brand Identity Kit.pptx
 
Improving profitability for small business
Improving profitability for small businessImproving profitability for small business
Improving profitability for small business
 
falcon-invoice-discounting-a-premier-platform-for-investors-in-india
falcon-invoice-discounting-a-premier-platform-for-investors-in-indiafalcon-invoice-discounting-a-premier-platform-for-investors-in-india
falcon-invoice-discounting-a-premier-platform-for-investors-in-india
 
Tata Group Dials Taiwan for Its Chipmaking Ambition in Gujarat’s Dholera
Tata Group Dials Taiwan for Its Chipmaking Ambition in Gujarat’s DholeraTata Group Dials Taiwan for Its Chipmaking Ambition in Gujarat’s Dholera
Tata Group Dials Taiwan for Its Chipmaking Ambition in Gujarat’s Dholera
 
Discover the innovative and creative projects that highlight my journey throu...
Discover the innovative and creative projects that highlight my journey throu...Discover the innovative and creative projects that highlight my journey throu...
Discover the innovative and creative projects that highlight my journey throu...
 
What are the main advantages of using HR recruiter services.pdf
What are the main advantages of using HR recruiter services.pdfWhat are the main advantages of using HR recruiter services.pdf
What are the main advantages of using HR recruiter services.pdf
 
VAT Registration Outlined In UAE: Benefits and Requirements
VAT Registration Outlined In UAE: Benefits and RequirementsVAT Registration Outlined In UAE: Benefits and Requirements
VAT Registration Outlined In UAE: Benefits and Requirements
 
FINAL PRESENTATION.pptx12143241324134134
FINAL PRESENTATION.pptx12143241324134134FINAL PRESENTATION.pptx12143241324134134
FINAL PRESENTATION.pptx12143241324134134
 
amptalk_RecruitingDeck_english_2024.06.05
amptalk_RecruitingDeck_english_2024.06.05amptalk_RecruitingDeck_english_2024.06.05
amptalk_RecruitingDeck_english_2024.06.05
 
Cree_Rey_BrandIdentityKit.PDF_PersonalBd
Cree_Rey_BrandIdentityKit.PDF_PersonalBdCree_Rey_BrandIdentityKit.PDF_PersonalBd
Cree_Rey_BrandIdentityKit.PDF_PersonalBd
 
What is the TDS Return Filing Due Date for FY 2024-25.pdf
What is the TDS Return Filing Due Date for FY 2024-25.pdfWhat is the TDS Return Filing Due Date for FY 2024-25.pdf
What is the TDS Return Filing Due Date for FY 2024-25.pdf
 
LA HUG - Video Testimonials with Chynna Morgan - June 2024
LA HUG - Video Testimonials with Chynna Morgan - June 2024LA HUG - Video Testimonials with Chynna Morgan - June 2024
LA HUG - Video Testimonials with Chynna Morgan - June 2024
 
ENTREPRENEURSHIP TRAINING.ppt for graduating class (1).ppt
ENTREPRENEURSHIP TRAINING.ppt for graduating class (1).pptENTREPRENEURSHIP TRAINING.ppt for graduating class (1).ppt
ENTREPRENEURSHIP TRAINING.ppt for graduating class (1).ppt
 
Introduction to Amazon company 111111111111
Introduction to Amazon company 111111111111Introduction to Amazon company 111111111111
Introduction to Amazon company 111111111111
 
20240425_ TJ Communications Credentials_compressed.pdf
20240425_ TJ Communications Credentials_compressed.pdf20240425_ TJ Communications Credentials_compressed.pdf
20240425_ TJ Communications Credentials_compressed.pdf
 
5 Things You Need To Know Before Hiring a Videographer
5 Things You Need To Know Before Hiring a Videographer5 Things You Need To Know Before Hiring a Videographer
5 Things You Need To Know Before Hiring a Videographer
 
Enterprise Excellence is Inclusive Excellence.pdf
Enterprise Excellence is Inclusive Excellence.pdfEnterprise Excellence is Inclusive Excellence.pdf
Enterprise Excellence is Inclusive Excellence.pdf
 
Kseniya Leshchenko: Shared development support service model as the way to ma...
Kseniya Leshchenko: Shared development support service model as the way to ma...Kseniya Leshchenko: Shared development support service model as the way to ma...
Kseniya Leshchenko: Shared development support service model as the way to ma...
 
Maksym Vyshnivetskyi: PMO Quality Management (UA)
Maksym Vyshnivetskyi: PMO Quality Management (UA)Maksym Vyshnivetskyi: PMO Quality Management (UA)
Maksym Vyshnivetskyi: PMO Quality Management (UA)
 
The effects of customers service quality and online reviews on customer loyal...
The effects of customers service quality and online reviews on customer loyal...The effects of customers service quality and online reviews on customer loyal...
The effects of customers service quality and online reviews on customer loyal...
 

DRC Financial Statement Analysis report

  • 1. I. Introduction It is probable that whenever thinking of core industries playing a critical role in maintaining a sustainable development or boosting the economy, seldom does the idea of rubber industry spring on our mind because of the fact that not every country is endowed with fertile soil for planting, and then favorable weather for some specific kinds of trees to flourish. Vietnam is a tropical country which is quite an ideal place for rubber to thrive, and actually, our nation has benefited from this type of tree to develop quite a new field- rubber industry. Basically, rubber- related companies manufacture their products from rubber to serve both domestic and global demands. In this industry, DRC – Danang rubber joint stock company is a well-known corporation that has gained a lot of remarkable achievements contributing to our country’s long- term economic development. In order for a deep insight into the company’s “health” , it is crucial to probe into its performance via analyzing both quantitative and qualitative information which is a proper base for an investment decision making to reach in terms of potential investors. This report is divided into three main parts. In the first place, the paper starts with a panorama of rubber industry from which an analysis about company strategy, operations and assessment of the quality of financial reporting are made. After that qualitative appraisal, the report continues to dig more deeply into the quantitative aspect through financial analysis. Finally, from the historical figures, the paper intents to make a forecast about the future development direction which is a reliable foundation for investors to draw the investment decision. Hopefully, this material will be a valuable reference for further research. II. Main contents 1. Company overview Danang Rubber Joint Stock Company (DRC) is located at Ngu Hanh Son district, in Da Nang city. Established in 1975, the firm has been developing for more than 35 years and has so far accomplished remarkable achievements in rubber industry in particular and in dynamic Vietnamese market in general. DRC has largely put its emphasis on producing, importing and exporting rubber materials and products as well as manufacturing and installing machinery and equipment serving for rubber production. Besides, the firm also expands its business to participate in commercial activities. DRC was officially listed on HCM Stock Exchange in December-2006. Cooperating with European experts and applying the most modern technology to production line, DRC has installed an advanced manufacturing system encompassing significantly high- 1
  • 2. quality and widely diversified types of products: Light truck tires, heavy truck tires, super heavy duty tires for agriculture tractors, retreaded tires, bicycle and motorcycle tires, as well as rubber products meeting various needs in traffic construction work, ports and automobile rubber parts. To obtain a fruitful outcome and firm prestige, DRC has indeed has formed and maintained an appropriate corporate strategy via its slogan: Safe and reliable on all terrain, highly performable on heavy load, endurable over the time – DRC conquers all the roads. In the first place, DRC has so far aimed at upgrading and improving the quality of products for the sake of its loyal customers and for the long-lasting prosperity and development of the firm. More noticeably, its pursuit to superior products is always accompanied by the utmost concern for ecological maintenance. What is more, DRC has been actually marked a deep stamp in the mind of the customers by its considerate serving. In effect, these developing plans have indeed created the unique competitive advantage for DRC. DRC has been proud to receive a variety of governmental awards for its fruitful operation and brilliant performance in many years such as: The Vietnam Golden Star Prize 2010, The Prestigious Stock Brand 2009, Top 50 Leading Listed companies on Vietnamese stock market 2009… Currently, DRC has occupied about 35% of the market share, ranking the second in producing motorbike, bicycle tires. Its products are consumed nationwide and exported to nearly 30 countries throughout the world like: India, Hongkong, Singapore, Brazil… 2. Industry analysis Porter 5-forces method has helped us examining the development of an industry under the constraints of 5 different factors: Buyer power, Supplier power, Rivalry among firms, treat of new entrants, Threat of substitutes. First of all, the power of buyer in the tire and tube industry is low, because the product is one kind of necessity. Besides, due to the requirement of traffic safety, buyers become the price taker in order to ensure about the product quality. The demand is nearly inelastic to price change and the steady demand automatically pulls products through distribution channels. Although the tire and tube sector accounts for 75% to 85% rubber product market share, the seller can easily raise the price when needed. However, the power of domestic supplier is high. Because of the shortage in natural resource, the bargaining position of the natural rubber seller has powerful bargaining power to tire and rube companies. The power of foreign supplier is medium due to high price which results from high import taxation. 2
  • 3. Industry competition is quite high. The 3 main competitors are Da Nang rubber company, Casumina Company and Gold star rubber company. Despite the harsh competition, there is still cooperation among those companies. Furthermore, each company has its own advantages and market. The main rival for Viet Nam rubber companies comes from abroad. The foreign companies have their competitive edge in the quality. Moreover, they can produce some products that Viet Nam companies cannot such as Radial tube. Even DRC began to produce Radial tube in 2011, for temporary it is hard to compete with the quality of foreign radial tires Threat of new entrant is low in this industry because of capital intensive requirement. Furthermore it is hard for new company to compete with the brand of big existing companies. The invasion of foreign companies is low due to the import barriers and the low attractive Vietnam small market size for rubber product. Threat of substitute is zero as there is still no other product that can replace tire and tube. 3. Company strategy analysis 3.1. Nature of the product DRC is now offering a wide range of different product lines to meet the demand of the market. The main products of the company can be divided into three main categories: - Tires for motorbikes, bicycles, and technical rubber: which is the traditional product of DRC - Special truck tires: which DRC has the absolute advantage in Vietnamese market, with lower price but higher quality - Bias technology tires: to meet the demand of the big trucks It is the fact that DRC is applying the differentiation strategy, which is illustrated by the great effort to catch up with the demand of the consumers, and reduce the competition and market share of the foreign producers in Vietnam. Comparing with its two close competitors, Caosumina which majoring in producing motorbikes and light truck tires, and SRC which majoring in producing bicycle tires, DRC seems always to be the first comer to come up with new product ideas. Like being stated above, with more than 3,000 billion invested in the Radial project, and the expected production capacity of more than 600,000 tires /year, DRC is becoming the first business to produce successfully the special tires for super trucks used in special purposes. Moreover, in the year 2010, DRC was honored to receive the golden cup for the “most effective 3
  • 4. business in applying technology”. This is once again emphasizes the leading and creative role of DRC in manufacturing and developing their products. 3.2. Degree of integration within value chain Concerning the distribution channels, DRC is experiencing great integration with its distributors. This company is building up its own distribution network all over the country with more than 150 point of sales. The revenue also comes mainly from this channel with more than 75%. DRC is also the main supplier of tires for such big auto-producers in Vietnam as Truong Hai auto, TMT, HuynDai… With the stable growth of the domestic truck manufacturing industry, this cooperation between DRC and those companies is expected to benefit the company in the long term. Moreover, DRC is exploiting new opportunities in foreign market such as Malaysia, Laos, Singapore … Especially with the products of tires for super trucks, used in coal and mineral industry, DRC has its strategic consumer Vinacomin, and the other part will be exported to India and SinDRC. Concerning the integration with the supplier within its value chain, this company has great support from the parent company VinaChem. With the contract of mutual support between Vinachem and VinaGroup (VRG), the alliance of extracting latex companies, members in the VRG will supply raw latex for members of the VinaChem. Specifically, DRC will receive the supply from Chư Sê, Chư Prông, Quang Tri entities. And in exchange, those companies will consume the tires product of DRC. 3.3. Geographical diversification About manufacturing, all the production activities of DRC are located in Da Nang. And by this time, company is step-by-step moving its factories to the outskirt of Da Nang. As the schedule, in the 4th quarter of this year, it will finish the displacement of factories producing tires for bike and motorbike from inner Da Nang to Lien Chieu industrial zone. After that, the movement of other factories which produce tires for trucks and tractors will be continuously moved during the time of 2012 – 2013. However, in contrast to that, the distribution network of DRC is widespread. As we said above, DRC has about 150 points of sale in all 64 provinces which helps to bring products to last customer. Besides that, DRC also speeds up exporting activities. Up to now, it has the customer- base in 27 countries in Asia, Europe and America. Especially, it has established direct sale agents in Laos, Cambodia, and Singapore. An optimistic result is that about 25% revenue of DRC comes from exporting. 4
  • 5. 3.4. Industry diversification DRC just focuses on horizontal diversification by manufacturing, distributing and providing related services in tire producing industry. In June 2011, Board of Management decided to add real estate business in the Business Registration of the company. However, it has been clarified that this activity doesn’t mean that DRC will invest in real estate market but it only leases unused offices and factories 4. Accounting analysis 4.1. Company operation In the period 2008 - 2010, the economic situation in the country and the world was unfavorable and highly volatile. In 2008, right following the “heated credit” time was the downturn period which was the result of the global financial crisis. In the beginning of 2009, interest rate and material price was good for production but this status did not last long. The period from end of 2009 to now witnessed unstable condition of the economy with very high CPI and loan interest, scarce funding. Government’s intervene action was passive and undirected. In this macro-economic condition, Danang Rubber Company seemed to be sustainable. Despite of the hard time, DRC continue to grow with increasing trend in net income (See chart 1 (appendix A). Net income in 2009 was outstanding because company took advantage of low- price material reserved previously. This made the Cost of goods sold in the first half of the year reduced by 40 billion in comparison with the first two quarter of 2008. Selling price also increased in accordance with market price. Therefore, in 2009, revenue increased considerably by 40.87%, the net income was 6.6 times higher than in 2008. But this was not a long-run advantage. As we can see on the Figure 2 (appendix A) in the recent 2 years, rubber price, which is the most important component of company’s product price, was increasing substantially. This brought the COGS of DRC from just about 71% in 2009 to the normal level of about 83%. Income in 2010 is lower than in 2009 but if we readjust income in 2009 from the abnormal effect; the figure in 2010 is still satisfactory. About the product strategy, at end of 2010, DRC have produced with 56% higher than designed volume. For the purpose of increasing output, company has planned a new production site which can produce a modern type of tire – radial tire, meeting the demand of tire for super- heavy vehicles. This factory planned to be nearly 373 billion VND, 70% debt funding and will finish in 2012. Therefore, in 2011 and 2012, we can anticipate an increase in debt account and 5
  • 6. increasing in revenue will mostly rely on increasing selling price – which cannot be significant. But we can hope in the noteworthy boost in revenue when new factory come into production 4.2. Critical accounting policies Inventories recognition Inventories are recorded as the lowest cost between their original costs and net realizable value. Cost of inventories are determined in accordance with the weighted average method and recorded in line with the perpetual method, which is persistent in every year. Provision for devaluation of inventories is recognized when the original costs are higher than the net realizable value. Account receivables Account receivable is recognized at the values on supporting documents and invoices. Provisions for bad debts are estimated by using the aging method. The details are followed the Circular 228/2009 TT-BTC by Ministry of Finance. Tangible fixed asset Tangible fixed asset is determined by their historical costs less accumulated depreciation. The historical costs include the purchase price and any capitalized expenditure putting the assets into operation. Fixed assets are depreciated in accordance with the straight-line method over their estimated useful life. 6 Assets Estimated useful life (years) 2010 2009 Building, architecture objects 5 – 25 10 - 25 Machines, equipment 3 - 12 7 - 12 Transportation means 6 – 10 6 - 10 Management appliances 5 3 – 8
  • 7. Table 1: DRC's accounting policy for estimated life of fixed assets In 2010, company changed depreciation rate of some fixed assets to assure the rationality of their estimated useful life. Revenue recognition Sales of goods are recognized when most of risks and benefits associated with the goods ownership are transferred to customers. Sales of service are recognized when services are performed completely. In case that the services are provided in many accounting periods, the determination of sales in each period is done on the basis of the service completion rate at the end date of fiscal year. Revenue from financing activities: Interest income is recognized on the basis of current time and interest rate; dividend income is recognized when company has the right to receive it. 4.3. Quality of financial reporting For the financial statements to be audited annually Danang Rubber Company has AAC as the independently auditing unit, which is one of the 200 member firms of Polaris International - an international association of accounting firms that is committed to being identified as an organization representing the traditional values of independence and integrity in providing professional services. AAC conducted the audit report for the fiscal year of 2010, saying that they applied the necessary sampling method and experiments, relevant evidences to examine the information in the financial statements. In accordance with Vietnamese current accounting standards together with accounting principles and explanations provided by DRC, the auditors concluded that the financial statements reflected honestly and fairly the financial situation of DRC at 12th December 2010 and the results of business and the cash flows for the fiscal year ending 12th December 2010. The opinion of auditor in the financial press is unqualified. 5. Financial analysis With the understanding about the tire producing industry and operation of DRC, in this part, we explore more details about performance of DRC by analyzing its financial statements. The figures will be examined to generate information about four aspects: liquidity, solvency, profitability and cash flow. In order to reach more meaningful assessment about DRC, we also compare it with The Southern Rubber Industry Joint Stock Company (CSM) and Sao Vang 7
  • 8. Rubber Joint Stock Company (SRC), which together with DRC dominate tire producing industry. 5.1. Liquidity analysis First of all, we look at revenue to cash ratio and days revenue in cash from the table 2 below. These 2 ratios reflect how long the revenue from operation is held in cash. The shorter the revenue stays in cash, the more efficient the company is. In 2008, the days revenue held in cash decreased from 10.77 to 7.18. It is because in this year the revenue increased 10.32% while the cash balance decreased nearly 60%. The underlying reason may be that DRC invested much in fixed asset and construction. In 2008, the cash outflow for investing in fixed asset and construction increased 112% compared with 2007. After that, the revenue went up continuously in 2 years (40.46% and 19% relatively), however, it was still lower than the speed of increase in cash account. As the result, the days revenue held in cash turned out to be 9.32 in 2009 and 15.72 in 2010. In comparison with SRC and CSM, in general, the time DRC held revenue in cash was higher. The possible reason is that while DRC focuses on producing tire and tube for trucks, CSM concentrates on tire and tune for motorbikes and SRC’s main products are for bikes. So the cycle of capital of these two firms is shorter and they need to hold little cash. Table 2: Liquidity ratios Next, we analyze the current ratio and quick ratio, two most important measures of liquidity to find the ability of DRC to meet current liabilities. The figures from the table show that both current and quick ratio decreased in 2008 and reversed in 2009 and 2010. It’s reasonable because in 2008 as the effect of financial crisis, there were the downturns in all industries not only tire producing. The balance sheets of DRC point out that in 2008, current liabilities increased from 44.8% to 49.3% of total assets but the current assets decreased from 74.9% to 69.8%. Also as the explanation of company, compared with 2007, in 2008 DRC must pay about 22bil VND extra as 8 DRC SRC CSM Year 2007 2008 2009 2010 Average 2007 2008 2009 2010 2007 2008 2009 2010 Revenue/Cash 33.9 50.81 39.15 23.22 36.77 40.9 120 26 41.6 17.6 23 54 42 Days revenue in cash 10.77 7.18 9.32 15.72 10.75 8.9 3 14 8.77 20.73 15.82 6.73 8.65 Current ratio 1.67 1.42 2.96 2.66 2.18 0.96 0.86 1.1 1.21 1.23 1 1.5 1.82 Quick ratio 0.72 0.45 1.1 1.1 0.84 0.34 0.21 0.5 0.32 0.5 0.32 0.55 0.83 OCF/Current Liability 3.96 0.3 2.22 0.16 1.66 2.73 0.21 1.45 0.09 3.45 0.27 2.13 0.18
  • 9. the rise of interest rate and 17bil VND extra for the change in exchanged rate. That would decrease the cash account or increase the account payable so decrease current ratio. In relation with industry, DRC always dominates for the liquidity. In all 4 years the current ratio and quick ratio for DRC were higher than both SRC and CSM. About operating cash flow to current liabilities, in 2008, there was a big fall-down from 3.96 to 0.3 because the operating cash flow decreased about 90% (from about 980bil VND to 91bil VND). The operating cash flow decreased that much is due to increase in price of main materials (rubber and black coal) in 3 first quarters of 2008, in financial cost (as said above), and selling and administration expense(25%) as well. As the data from statistic agents, up to the 3rd quarter of 2008, price of rubber increased 50% and price of black coal was 20-30% higher than the beginning of the year. However, in the 4th quarter of 2008 and the 1st quarter of next year, because of financial crisis, price of rubber decreased quickly before went up again. DRC caught this opportunity to buy rubber for inventory when the price was low. So, in 2009, cost of goods sold decreased from 86.1% to 69.7% of total revenue. Together with that were the higher products’ price and the lower proportion of current liabilities. So the ratio reversed to 2.22 in 2009. In 2010, DRC must pay corporate income tax after 4 years of exemption. And the cost of rubber was still more expensive from 2nd quarter of 2009. Consequently, operating cash flow to currents liabilities decreased to 0.16. We continue liquidity analysis by looking at the net days working capital of the 3 companies calculated for the 4-year period Table 3: Net days Working Capital The Days receivables of DRC decreased from 2007 to 2010 indicating that firm needed less time holding accounts receivable till collection. The reason is that DRC’s Net sales grow up at a high level, by 40.6% in 2009 and 19% in 2010. On the contrary, CSM and SRC had increasing Days receivable in the 4-year period, which the result from high level of account receivable in CSM and falling Net sales of SRC. 9 DRC SRC CSM Year 2007 2008 2009 2010 Average 2007 2008 2009 2010 2007 2008 2009 2010 Days AR 39.56 38.54 24.82 28.4 32.83 22.58 21.32 38.89 46.71 18.14 18.73 18.66 21.17 Days Inventory 81.84 84.03 87.4 80.16 83.36 72.23 83.51 93 88.52 81.29 88.43 96.08 73.92 Days AP 7.6 4.33 4.74 4.93 5.40 11.1 10.93 15.04 15.9 9.2 10.99 11.58 4.72 Net Days WC 113.79 118.24 107.47 103.62 110.78 83.7 93.9 116.86 119.33 90.23 96.16 103.16 96.36
  • 10. The Days inventory of DRC went down in 2010 although it had rising pattern from 2007 to 2009. In 2009, DRC had very low Inventory turnover rate because of low level Cost of goods sold, 69.7% in common size, but the Inventory turnover rate rose in 2010 as the result of high increasing of Cost of goods sold, by 38%. The reason is in 2009 DRC had a large amount of inventory reserved from last year at low cost; in 2010, as the effect of high oil price, the cost of goods increased. It also explains for the impressive increase Net sales of DRC in 2009 when Cost of goods sold was low but market price of its products was high. CSM had the same trend Days inventory with DRC that was high in 2009 but lower in 2010, SRC’s Days inventory maintained at high level. Because of the decrease of both Days receivable and Days inventory, the Net days working capital of DRC decreased in 4 years, indicating that the firm could reduce its short-term liquidity risk. SRC with high number of Days receivable and Days inventory, the Net days working capital increased regardless of the growth of Days payable. CSM’s Net days working capital was also higher than that of DRC. In general, DRC is the company with lowest short-term liquidity risk among the 3 large competitors in rubber industry in the period of 2007-2010. 5.2. Solvency risk After looking at the short term liquidity risk, we should also pay attention to the long term solvency risk to have a better view about the financial health of DRC Company. This part includes examining 6 ratios: Debt/ TA, Debt/Equity, L-T Debt/L-T Capital, L-T Debt/SE, Interest coverage ratios, and OCF/TL Table 4: Solvency risk ratios From the table above, it is seen that the first four ratios illustrate the degree of debt usage by the company. And it is easy to realize this group of ratios shared the same trend: rather high in the first 2 years and decreased dramatically in the last 2 years. The reason came from the sudden decrease in Total Liabilities in year 2009 and 2010, especially in year 2009 with change of 10 Year DRC SRC CSM 2007 2008 2009 2010 Ave. 2007 2008 2009 2010 2007 2008 2009 2010 D/A 0.643 0.648 0.29 0.312 0.47 0.73 0.77 0.52 0.43 0.67 0.75 0.59 0.58 D/E 1.802 1.845 1.409 1.455 1.63 2.34 3.27 1.09 0.75 2.41 2.93 1.47 1.4 L-T Debt/ L-T Cap 0.354 0.306 0.072 0.055 0.20 0.23 0.366 0.146 0.69 0.28 0.35 0.133 0.097 L-T Debt/Equity 0.547 0.441 0.078 0.058 0.28 0.41 0.58 0.17 0.07 0.37 0.54 0.15 0.11 Interest coverage ratio4.21 2.15 29.79 30.03 16.55 5.8 N/A 8.3 4.74 2.36 1.028 1.634 1.573 OCF/Total Liabilities 2.639 0.237 1.311 0.167 1.09 1.86 0.035 0.573 0.261 0.16 -0.326 0.553 0.037
  • 11. -42.79% due to the contribution of decline in both current and long-term debts, together with the fast growth in total assets and total equity for the same period. As after the big economic depression in 2008, the company began to recover and had the ability to pay back some part of their debts obligations. Moreover, with a breakthrough of OCF as well as NI in 2009, the firm could generate enough cash itself to finance their operations without much dependent on outside sources of funds. The change in total assets and total liabilities were explained by the huge investment project of DRC in manufacturing Radial tires, which required the growth in assets and equity during 3 years from 2009 to 2011. The details are showed in the table 1 (appendix B) All the above changes point out good trend in the solvency risk of the company. The cut in all debt ratios signals the less likely in failing to honor long-term obligations of the company. Also, in comparison with its competitors, DRC showed a lower use of debts. This may be considered not being efficient in taking advantage of the financial leverage; however, it could be a wise strategy for firms in current high inflation period with so high borrowing cost. Turning to the interest coverage ratio, there seems a significant change between period before and after 2008. Year 2007 and 2008, the company tended to keep this rather low but still met the benchmark of 2. It is due to the favorable tax treatment of the company from 2006, which levied no corporate tax on rubber companies as well as the tax reduction of 50% for those who were first listed on the HCM stock exchange. Year 2009, DRC still benefited from the free tax treatment, but the interest coverage ratio seems to be improved remarkably as a result of the sudden rally in Net Income resulting from the extremely cheap input price, the cut in interest expenses since the company relied less on debts together with the cut in borrowing cost. And this ratio was maintained through year 2010. In comparison with its competitors, this firm showed better prospect in managing the ability to pay back interest. The last ratio (OCF/TL) experienced high rate in 2007 and 2009 because DRC could generate high cash from operations during these two years. The low one in 2008 was explained by the general economic downturn of the world, while the other in 2010 was attributed by the cease of enjoying tax benefit. However, DRC always appeared to outperform the other two, and could maintain a positive OCF even in hard times. From all the analysis above, it is clearly shown that DRC has strong ability to meet long term obligations and keep going concern in the future. 5.3. Profitability analysis a. Return on assets 11
  • 12. The full overlook on the profitability of Danang Rubber company can be achieved by comparing its profit figures with its main competitors, Southern Rubber company (CSM) and the Sao Vang Rubber company (SRC). Table 5: Return on asset ratios First of all, the return on asset of DRC increased significantly just before its fell in last year to about half of the previous year’s level. Starting at higher level than other competitors, DRC insisted its position in the industry as a major company (35% tire market share) with ROA of above 15% in comparison with 6% and 7% of SCR and CSM respectively. In the bull trend of the industry, together with other company like SRC, DRC also had it profit increase 3 times to an amazing level of 58% in 2009. In 2010, with the down trend of market, return on asset of Da Nang Rubber Company fell significantly to half of 2009 level but still at very good level of 22% in comparison with under 10% ROA of its competitors. The fall of DRC’s return on asset in 2010 can be explained through examining its two disaggregating components, profit margin and asset turnover. Of those two profit margins appeared to be the main reason. First, the deep fall in the income was resulted from the sharp rise of Cost of goods sold, from 14% in 2009 to 38% in 2010. This reflected the increase in the raw material price increase in 2010. DRC had to import a large proportion of it raw materials when ironically the latex supply domestically is used to export. Another reason is tax effect. DRC got tax exempt from 2006 till 2009 therefore in 2010 the income after tax decreased by 50% in comparison with past year level when tax is excluded from expenses. Moreover, one component contributing to the decrease in ROA is asset turnover. It is questionable to see that asset turnover of DRC decreased in 2010 while both competitors have 12 DRC SRC CSM Year 2007 2008 2009 2010 Ave 2007 2008 2009 2010 2007 2008 2009 2010 ROA 0.17 0.16 0.58 0.22 0.28 0.06 0.06 0.22 0.07 0.07 0.01 0.22 0.12 Profit margin for ROA 0.08 0.07 0.22 0.09 0.12 0.03 0.03 0.11 0.03 0.04 0.23 0.13 0.06 Account Receivable turnover9.33 9.67 15.03 13.2 11.81 16.26 15.5116.57 16.7719.02 18.4917.7511.83 Inventory turnover 4.46 4.34 4.18 4.55 4.38 5.05 4.37 3.92 4.12 4.49 4.13 3.8 4.94 Fixed asset turnover 8.3 8.18 8.99 8.68 8.54 3.74 3.75 4.43 5.52 8.3 7.36 7.26 8.54
  • 13. this ratios rise. Although the decrease is not huge, it is worth considering as DRC went on opposite direction to market at this ratio. According to the tables above, the fall in asset turnover of DRC can be explained mainly by the fall in Account receivable turnover, from 15 times to 13 times. While other competitors had their receivable turnover improved, DRC went on contrary direction. Furthermore, the increase by 0.5 times in inventory turnover was offset by the fall of nearly 1 time in fixed asset turnover. All of those above things suggest that DRC should pay more attention to credit sale activities and fixed asset management so that their profit will not be harmed. b. Return on capital equity Table 6: Return on Capital Equity Ratios On the other hand, ROCE measures the income allocable for common shareholders. From this table we can see that ROCE of DRC in comparison with its two main rivals is notably more competitive. This can be the result of higher TA T/O and CSL. The lowest ROCE was in 2008, due to heavy interest force. Interest expense in this year was double than previous year. But the following year was almost opposite; with very low interest expense (only equals to about 30% of last year), high income, which lead to an exceedingly pleasing outcome for common shareholders. Profit margin for ROCE of DRC is higher than that of CSM or SRC, which indicate that the proportion of earning allocable for DRC’s common SHs, after subtracting all expenses and debt financing cost is acceptable and prospective. CSL is the degree to which firm uses common shares to finance assets. DRC has noteworthy high CSL in comparison with its two opponents. It means that DRC seems to prefer debt financing to finance for assets while other companies prefer Equity. But we can see a decreasing trend in CSL of DRC, which go against the other two rivals. It mainly results from growing Equity while total liabilities do not change much over time. 13 DRC SRC CSM Year 2007 2008 2009 2010 Ave. 2007 2008 2009 2010 2007 2008 2009 2010 ROCE 0.636 0.364 2.556 0.85 1.10 0.161 0.005 0.633 0.089 0.19 0.021 0.688 0.333 Profit margin for ROCE 0.06 0.039 0.212 0.088 0.10 0.029 0.001 0.094 0.013 0.041 0.004 0.116 0.052 Capital structure leverage 4.905 4.218 4.549 4.007 4.42 2.908 3.184 3.519 3.557 2.688 3.232 3.601 3.453 Assets turnover 2.163 2.197 2.651 2.399 2.35 1.902 1.784 1.917 1.99 1.716 1.574 1.641 1.851
  • 14. In conclusion, we can see that DRC is having a desirable level of profitability in a relatively high competitive environment so it could be wise to invest in this company for long-run value. 5.4. Statement of Cash flow analysis Statement of cash flow is a financial statement that shows how changes in balance accounts and income affect cash and cash equivalents, and breaks the analysis down to operating, investing, and financing activities. Essentially, the cash flow statement is concerned with the flow of cash in and cash out of the business. The cash flow statement is intended to provide information on a firm's liquidity and solvency and its ability to change cash flows in future circumstances, provide additional information for evaluating changes in assets, liabilities and equity. By having a deep insight into DRC’s statement of cash flow (table 3 – appendix B), it entitles us to a more detailed picture of corporate operation of this company. Looking at the Cash flow of DRC from 2007 to 2010, it was noted that the firm generated positive cash flows throughout the years despite their profound fluctuations especially in 2008. DRC created a high cash flow in 2007 but sharply declined by about ten times in 2008. Though operating activities made greater revenue in 2008 than in 2007, this amount could not compensate for the firm’s suppliers expense and interest expense. In 2009, However, there was indeed a dramatically fivefold growth in the sum of cash flow from operation compared to 2008 mainly owing to a considerable increase in the cash inflow from selling, providing services and others, together with a significant decrease in interest expense. Nevertheless, DRC, once again underwent a drastic plummet in 2010 chiefly due to a remarkable rise in supplier expenditure and labor salary as the result of a noted increase in the amount derived from services and selling. In addition, on the grounds of corporate tax expense that was deductible during four years, the firm borne this burden in 2010 which reduced substantially the revenue gained in the year. However, In comparison with SRC- another leading company in rubber industry, DRC ran its business effectively to reach a by far more fruitful outcome by dint of the fact that the firm generated much more cash from operation than SRC in four-year period and it did not experience any loss like SRC did in 2008. Regarding the cash flow from investing activities, it is noteworthy that in the four-year period between 2007 and 2010, the cash outflows exceeded the cash inflows due to the expenditure on acquiring both current and long-term assets, along with purchasing securities and taking out loans (2009) and investing in other companies (in 2010).In fact, DRC spent much greater amount 14
  • 15. of cash on investing activities compared with SRC especially in 2008 when DRC poured into investment about 100 billion VND, which was five times more than SRC spent in that year. Nevertheless, during those years, DRC actually made some proceeds from sale of several fixed assets, retaking the lent amount and revenue from investment that could compensate partly for spending on fixed assets. In terms of financial activities, cash flows generated were negative for three years apart from 2010. From 2007 to 2010, DRC paid out large amount of short-term and long-term borrowings which imply that the firm relied much on outside financing for fixed assets purchase. Moreover, it was accompanied by dividends paid out from 2008 to 2010 that made the amount received back from short-term borrowers unable to compensate for. Notwithstanding, exclusively in 2010, since the dividend amount to be paid out for shareholders was reduced notably for the purpose of investing in some potential plans, together with a slight increase in the amount repaid by borrowers, the total cash flow from financing activities in 2010 brought in a bright picture. To compare with SRC, although this company ‘s losses over the years were not so huge as DRC, even SRC’s financing activities yielded a positively large amount of cash in a year of financial disaster ( 2008), but DRC surpassed SRC spectacularly in 2010 by roughly ten times. After all transactions relating to operating, investing and financing, the net change in cash flow were positive at all except for the figure in 2008 due to some certain impact from financial calamity worldwide. This scenario was actually desired to its rival – SRC for the reason that SRC’s net change was negative in all of four years. 6. Valuation 6.1. Forecasting Income Statements a. Sales and COGS According to the statistics calculated over a 4 year period, DRC’s sale growths were approximately 26.3%(2007), 10.32%(2008), 40.64%(2009), 19.01%(2010) and about 21.46% as the statistics calculated throughout 3 quarters of the year 2011. Based on the information from VnEconomy, the average economic growth rate in Vietnam in 2010 was roughly 6.78%, however it was then reduced to about 5.57% during the first six month of year 2011 (Report 122/BC-CP). In addition, from Economy and Forecast review, Vietnam’s economic growth rate is projected to be 6.5% in 2012. Clearly, there is a positive sign in the growth rate perspective 15
  • 16. which can rely on to expect for an even more profitable scenario in 2012. Moreover, in the article wrote by Pham The An (2011), the author analyzed that the inflation rate may continue to increase in the last period of this year but it will not rise so dramatically like the first months of the year. Especially, DRC is intend to launch a new product that is designed and installed professionally during the year 2011.This product is promisingly hoped to raise the firm revenue as a result of attracting an increasing number of customers and expand its market share. Notwithstanding, the new product also costs an amount for advertising and some other expenses. Therefore, taking all these matters into consideration, we forecast the next year’s net sale growth to be about 22% compared with 2011. After one year, when the new product gains its customers’ recognition and adjusts itself to the market, we expect the sale growth will go up by 2%, reaching 24% in 2013. This trend, however, is anticipated not to continue in the period from 2014 to 2016 on the ground that the new product may lose its competitive advantage gradually as time goes by or it cannot live up to the customers’ expectation as they hope. Furthermore, taking unpredictable ups and downs in the economy as a whole into account, it is probable that the sale growth of DRC Company may drop to approximately 20%. The gross sales will be derived from the fact that net sales account for about 98% of gross sales revenue. In forecasting operating expense, after considering historical figures from 2007 to 2009, the average amount of Cost of goods sold was about 84.79% of the gross revenue. However, because of the launch of the new product, the company may have to include other expenditures. Thus, it might be possible that the operating expense is 85% of the gross profit on average. The details about these above items can be found in the following table: (in million) 2012 2013 2014 2015 2016 Sale growth rate 22% 24% 20% 20% 20% Gross revenue 3,266,143 4,050,017 4,860,020 5,832,024 6,998,429 Net revenue 3,200,820 3,969,016 4,762,820 5,715,384 6,858,460 COGS 2,776,221 3,442,514 4,131,017 4,957,220 5,948,665 Table 5: Sales and COGS projections b. Expenses & Other Income Financial income Assuming that the company holds cash through the years, it will earn an interest amount equals to 9% of cash. Financial expenses Financial expenses include Loan interest expenses and others. Analyzing past years, the Loan interest expense was around 8% of company’s total borrowings. Therefore, we assume that in the 16
  • 17. next 5 years, it will be at same level towards total short-term and long-term borrowings (calculated by 8% of average total borrowings on balance sheet) Selling and administrative expenses The selling and administrative expense are expected to experienced the same trend as sale growth, with 2 first years high and gets to stable stage in later years. Taking into consideration of average percentage of these two expenses to sale level, we project selling and admin costs as follow: - Selling expenses: 2.5% 2.0% 1.5% 1.5% 1.5% - Administrative expenses: 1.8% 1.7% 1.4% 1.4% 1.4% Other income Other income is assumed to be 0.27% of net sales revenue during the next 5 years. Other expenses Other expenses are estimated at 0.18% of net sales revenue from 2012 to 2016. 6.2. Forecasting Balance sheet Before coming to the valuation of RDC to decide whether this company is fairly priced or not, we have to estimate financial statements up to a certain point in the future. We choose period 2011-2016 as our forecasting horizon. The FS of 2011 will be estimated by using extrapolation from the data of 3rd quarter, whereas the following years data will be projected using the assumptions below. a. Projecting assets Inventories We base on the inventory turnover ratio to forecast average inventory for each year, and then derive the ending balance of the same year. The inventory turnover of 4.37 are kept constant and used as the key forecasting items. Projecting fixed assets The fixed asset of DRC composes of three main items: tangible and intangible fixed assets, and construction in progress. However, for the purpose of simplicity, we just make the projection for total fixed assets without breaking down them to smaller items. We first estimate net fixed assets as percentage of sales, deriving from the historical average fixed asset turnover of 8.5. Average useful life of PPE is estimated by the formula below and result in 15.8 years: 17
  • 18. Average useful life = PPE at cost /Depreciation of current year From all the given data about net fixed asset, accumulated depreciation, and average useful life, we calculate annual Depreciation by: Annual Depreciation = And finally the PPE at cost is estimated by summing up the net fixed asset and accumulated depreciation for the current year as the table below has detailed Long-term investment Looking at the historical trend of this investment category of this company, the level of investment seems to be kept constant for several years before taking any changes. Thus, we assume that Long-term investment in further years should keep the balance of that in 2011. Cash, Account Receivable, other current and fixed assets In projecting these three items, we all base on the proportion to total assets to forecast for the consequent years. The table below shows the detail of historical trends and the average number of these ratios Although it is more preferable that account receivable should increase with sale growth through future years. However, it should be noted that the Account Receivable of 2011 is unusual high, and we do not expect this trend to happen again. As a result, using ART will affect a lot the consequent years’ ending balance. To put it another way, the ending AR is derived directly from the percentage of total assets, with the decreasing trend as noted in the table. Turing to forecasting cash, as it is preferable that the firm should keep some cash to maintain liquidity, we project cash to increase around the average percentage of TA of 4.6%, with little decrease to 3% in 2012 since in further years, the company does not need to hold a lot of cash when the Radial project and the new product introduction phase are all over. The same trend is expected to happen with other current and fixed assets with the first year’s balance is around average number and then falls as fund is released from the necessity of making early payments 18
  • 19. (main component of other assets) to boost sales in recent years. The detail balances of these items as well as the number of total assets are described in the table below: (in million) 2012 2013 2014 2015 2016 Net sales 3,200,820 3,969,016 4,762,820 5,715,384 6,858,460 Account receivable AR Turnover 11.3 11.3 11.3 11.3 11.3 Average AR 283,258 351,240 421,488 505,786 606,943 Beginning 511,414 55,103 647,378 195,599 815,973 Ending 55,103 647,378 195,599 815,973 397,913 Inventory Inventory turnover 4.37 4.37 4.37 4.37 4.37 Average balance 634,710 787,040 944,448 1,133,338 1,360,006 Beginning balance 634,710 787,040 944,448 1,133,338 1,360,006 Ending balance 686,023 888,058 1,000,839 1,265,837 1,454,174 Fixed assets Fixed asset turnover 8.5 8.5 8.5 8.5 8.5 Average Fixed asset (Net) 384,252 476,473 571,767 686,120 823,345 Net Fixed asset beginning 309,369 459,135 493,810 649,724 722,517 Net Fixed asset ending 459,135 493,810 649,724 722,517 924,173 Accumulated Depre.(last) (511,905) (577,516) (649,903) (737,716) (836,380) Annual Depreciation 65,611 72,387 87,813 98,664 118,956 Average useful life 15.8 15.8 15.8 15.8 15.8 Fixed asset at cost 1,036,652 1,143,713 1,387,440 1,558,897 1,879,509 Acummulated Depre.(current) (577,516) (649,903) (737,716) (836,380) (955,336) Account Receivable, Cash, other current and fixed assets AR/TA 18% 18% 16% 15% 14% AR 273,936 330,568 341,593 371,434 409,295 Cash/TA 4.60% 4.60% 4.60% 3.00% 3.00% Cash 70,006 84,479 98,208 74,287 87,706 OCA/TA 0.78% 0.78% 0.78% 0.65% 0.65% Other current assets 11,871 14,325 16,653 16,095 19,003 OFA/TA 0.80% 0.90% 0.90% 0.70% 0.70% Other fixed assets 12,175 16,528 19,215 17,334 20,465 Total percentage 24.18% 24.28% 22.28% 19.35% 18.35% TA final 1,521,869 1,836,490 2,134,954 2,476,226 2,923,539 TA(exclude 4 items) 1,153,881 1,390,590 1,659,286 1,997,076 2,387,069 Table 6: Asset projections b. Projecting liabilities Current liabilities Short-term borrowings 19
  • 20. In the past DRC used to use much short-term borrowings, around 40% or more of total assets. But 3 nearest years, this ratio decreased much to just above 10%. It may be because the volatility of the economy and the some nuisance caused by such a big radial project. With the confidence about the more stable macro-factors and the prospective of DRC we increase the weight of short- term borrowings in total assets to 30% in 2012, 40% for the rest years. Account payable (to suppliers) The amount of account payable will be determined by the future credit purchase of company. In the last 4 years, the days of account payable were just above 4, except 7.6 in 2007. The average days account payable, excluding 2007, was 4.67. We assume that DRC will maintain this figure in the future. In this case, to forecast account payable, firstly, we forecast the inventory purchase for each year and then, use days account payable to calculate. Advances from customers, payables to employees, short-term provision Due to the fact that 2 first items are directly related to operation of business, we forecast them by let them growth with sale growth rates. About short-term provision, it only appears in 2011 with small amount. So that we charge it as nonrecurring items Taxes and other payables to the State Budget This account includes tax payable (income tax, VAT) and others fees. It is varies with many other factors (tax rate, tax settlement, tax payment,..). From the data of recent year, this item is not significant, only about 0 – 1.86% of total assets. So, in the following year, we will estimate it as 1% of total assets Accrued expenses After 3 years disappearing, this item recurring in 2011 with very higher amount (0.8% of sale). We believe that the reason is that the radial project has taken too much capital of DRC. And, in the future, when the project comes to finish and operate, this item will decrease. Consequently, we forecast it as descend percentages of sale, 0.2% in 2012, 0.1% in 2013, 0.05% in 2014 & 2015, and 0% in 2016. Other payables 20
  • 21. Other payables are very related to operation of the business. The figures of the previous years proved that on average, other payables is equal to 0.4% of sale. We also use this rate in the forecasting period. Welfare funds DRC states that, each year it will put 8% of net income of the year into welfare funds Adding = 8%* net income Amount used = beginning balance+ adding – ending balance % used =used/(beginning balance+ adding) The table points out that, on average, each year, 0.8 of the amount of money put in this fund is used. So, we forecast the ending balances for next years will be equal to beginning balance plus adding and multiply with 0.2. Long-term liabilities Long- term borrowings It’s easy to see that except for 2011, DRC didn’t rely on long term loans as a heavy source of capital. The proportion of long term loans in total assets decreased fast over the years to 3.89% in 2010. However, it’s is nearly 11% in 2011. This increase is reasonable because DRC started radial project in mid-year. Although, the construction will be continue in 2012, we expect that the funds need to be disbursed is not too much and DRC can repay some with the cash from operation. As the result, we assume that long term borrowing will decreased 14% in 2012 and in following years when the project come to operation, this ratio will be 20% (the average % decrease in the amount in previous years except 2011). Provision for severance allowances As the requirement of the government, each year company needs to put aside 1-3% salary resource for severance allowances. The historical data shows that, on average, the average balance of provision for severance allowances was about 2.2% of total salary expenses. With level of uncertainty about future, we keep this percentage 2.5% in our forecast. (in million) 2012 2013 2014 2015 2016 Account payable COGS 2,776,221 3,442,514 4,131,017 4,957,220 5,948,665 Ending inventory 686,023 888,058 1,000,839 1,265,837 1,454,174 Beginning inventory 583,397 686,023 888,058 1,000,839 1,265,837 Inventory purchase 2,878,847 3,644,549 4,243,798 5,222,219 6,137,001 days AP 4.37 4.37 4.37 4.37 4.37 Average balance 34,499 43,675 50,856 62,581 73,543 beginning balance 44,094 24,904 62,445 39,266 85,895 21
  • 22. ending balance 24,904 62,445 39,266 85,895 61,191 Welfare funds adding 11,122 10,095 13,776 17,608 21,922 beginning 13,215 4,867 2,992 3,354 4,192 used 19,470 11,970 13,415 16,769 20,892 ending 4,867 2,992 3,354 4,192 5,223 Table 7: Liabilities projections c. Projecting Equity Common stock As in year 2011, we use the information of 3 quarters to estimate the balance of the year, the company common stock value VND512,820,706,667 , in which par value is VND 10,000 per share. In the next 5 years, it is assumed that the company would maintain its common stock value at equal to the previous year’s balance. Share premium The account remained unchanged during the analyzed years at VND 3,281,000,000. Therefore, it is expected to be stable at that level in the forecasting horizon. Investment and development fund, financial reserve fund and other funds As the balance of these funds fluctuate significantly during the years from 2006 to 2010 due to the use of company on funds, which is hard to detect, we treat them as plug-in items on Balance sheet. Retained earnings In the period from 2012 to 2013, we assume that the company continues using the same plan of distributing the profit as it used in prior years: 2012-2013 2014-2016 Profit after tax( 25% tax) 100% profit after tax 100% profit after tax Investment and development fund Financial reserve fund Welfare fund Bonus for management 5% of profit after tax 5% of profit after tax 8% of profit after tax VND 1,000,000,000 5% of profit after tax 5% of profit after tax 8% of profit after tax VND 1,000,000,000 Dividend 17% nominal value (VND 1,700 per share) 20% nominal value (VND 2,000 per share) Table 8: Retained earning projection Following this plan, each year the company will take a portion of money out from the profit after tax to put into funds and reward the management, pay dividend then add the remaining to 22
  • 23. the retained earnings balance of the very previous year (see table 2 & 3, appendix A). Therefore net income in statement of cashflows will be lower than profit after tax. Given all the balance sheet and the income statement estimated above, the cash flows statements are derived for the year from 2011-2016, and then they will be used as inputs for valuation of the company. 6.3. Free cash flow valuation a. Calculation of Free Cash Flow to common equity holders The details about FCF calculation are provided in Appendix D b. Valuation We use the below assumptions to estimate firm’s value: VALUATION PARAMETER ASSUMPTIONS (Unit: VND) COST OF EQUITY CAPITAL: Equity risk (i.e. beta) (ß)(15/12/2011) -0.01 Risk free rate (Rf) 9.00% Market risk premium (Rm-Rf) 8.80% Required rate of return on common equity: 8.91% Current share price (15/12/2011) 17,20 0 Number of shares outstanding 30,769,248 Current market value 529,231,065,600 Long-run growth assumption 4.00% Table 9: Valuation assumptions Base on the projected financial statements we have derived in previous sections, we now try to figure out the value of the firm from equity shareholders’ point of view. The value of firm comprises two parts which are the present value of periodic cash flows for equity shareholders and the continuing value of cash flows after 5 years of prediction period. Firstly, it is easy to calculate the PV of periodic cashflows with all data available. The risk free rate (Rf) we used is the current prime rate of SBV which is 9%. According to Pablo, Javier & Luis (2011), the market risk premium of Viet Nam is 8.8%. The beta of DRC at December 15th ,2011 is -0.01. Then we can calculate the required rate of return by using CAPM model to derive Re equal to 8.91%. Periodic cashflows then were discounted at this Re to get the PV of 412,180,668,419. (Details on periodic cashflows calculation, see in Apendix D) Secondly, to calculate the continuing value of cashflows out of the prediction period, we use assumptions that is future cashflows from 2016 on will grow at the constant growth rate g equal 4% for the years after prediction period. Applying the Gordon growth model, we calculated the continuing value of the firm at year 2016 equal 1,030,625,193,213, discounted at 23
  • 24. Re to get the present value of 672,762,317,010. Here, taking into account midyear accounting effect, we can derive to the total PV of all cashflows or the value of firm at present equal 1,133,250,071,855. The firm currently has 30,769,248 shares outstanding. Dividing the calculated value of firm to equity shareholders by number of share, we got the actual value per share of firm equal 36,831. In comparison with the current DRC share price, it is clear that DRC stocks are underpriced by about 53%. Details about estimation: Sum of PV free cash flows 412,257,712,265 Terminal value of continuing cash flows 1,029,156,468,385 Present value of terminal value 671,587,712,631 PV of free cash flows for common equity shareholders 1,083,845,424,895 Adjustment to midyear discounting 1.0446 Total PV free cash flows to equity 1,132,141,577,029 Shares outstanding 30,769,248 Estimated Value per share 36,795 Current Share Price( at 15/12/2011) 17,200 Percent difference -53% Pricing Underpriced Table 10: Valuation details III. Conclusion All in all, DRC has run in quite a favorable environment on the ground that although it faces fierce competition from other firms and low demand from customers in general, the corporation benefits from abundant numbers of suppliers, low threat of new entrant and especially, it has no perfect substitute. In fact, DRC is currently one of the leading companies in this industry with the developing strategy of differentiation which easily gains competitive advantage. Moreover, compared to other large companies in the same sector, DRC is really outstanding in regard to its ability of managing and running to generate a promising and desirable amount of cash. A good history makes a potentially fruitful future. Through a fundamental projection, it can be seen that DRC is forecasted to continue to generate positive cashflows for investing purposes. In this anticipation, the company is thought to spend a large amount in investing activities in the near future for further expanding and developing, and in order to be afford for that objective, DRC is predicted to manipulate external sources besides its own cash. After all these matters, Danang 24
  • 25. Rubber joint stock company deserves attention and investment from both domestic and international investors. REFERENCE Anh Quan, 2011, Tăng trưởng GDP năm 2010 đạt 6,78%, [online] Available at URL: http://vneconomy.vn/2010122901294195p0c9920/tang-truong-gdp-nam-2010- dat-678.htm Aswash, D.2011, ‘Equity risk premium (ERP): Determinants, estimations and implications’, Stern school of Business. DTVK, 2011, DRC không triển khai các dự án bất động sản, [online] Available at URL: http://www.vinacorp.vn/news/drc-khong-trien-khai-cac-du-an-bat-dong-san/ct-480564 25
  • 26. Nguyen Ngoc Tuan, 2011, ‘Công ty Cổ phần Cao su Đà Nẵng (HOSE:DRC)’ Pablo Fernandez, Javier Aguirreamalloa, Luis Corres, 2011, ‘Market risk premium used in 56 countries in 2011: a survey with 6,014 answers’ Pham The An, 2011, Kinh tế Việt Nam còn diễn biến khó lường, [online] Available at URL: http://vef.vn/2011-08-22-kich-ban-nao-cho-kinh-te-vn-cuoi-2011-va-nam-2012- Thanh Nu, 2011, DRC đặt kế hoạch lãi ròng 33.75 tỷ đồng trong quý 3, [online] Available at URL:http://bantinchungkhoan.net/tin-chung-khoan-trong-nuoc/3992-drc-t-k-hoch-lai- rong-3375-t-ng-trong-quy-3.html 2011, Phấn đấu tốc độ tăng trưởng kinh tế khoảng 6,5% trong năm 2012, [online] Available at URL: http://kinhtevadubao.vn/p0c281n9932/phan-dau-toc-do-tang- truong-kinh-te-khoang-65-trong-nam-2012.htm 2011, Dễ sập bẫy với lợi nhuận đột biến, [online] Available at URL: http://www.phanmem- ketoan.com/2011/08/de-sap-bay-voi-loi-nhuan-ot-bien.html 2011, HOSE:DRC - Công ty Cổ phần Cao su Đà Nẵng, [online] Available at URL: http://www.vinacorp.vn/stock/hose-drc/cao-su-da-nang/gioi-thieu www.drc.com.vn http://www.stockbiz.vn/ http://stox.vn/stox/ 26