Downloaded 819 times
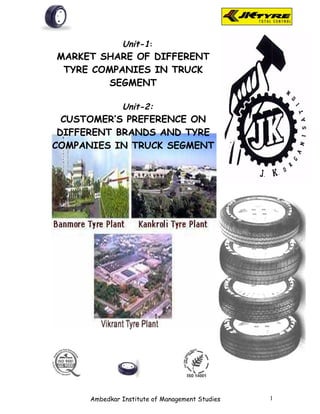
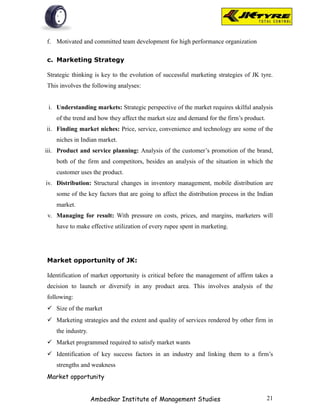
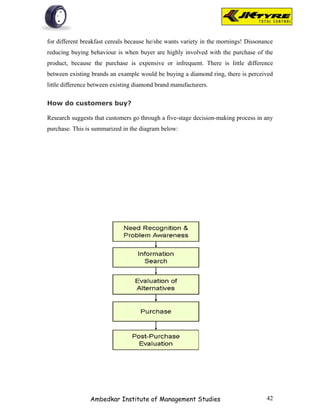
![Entry Barriers: High
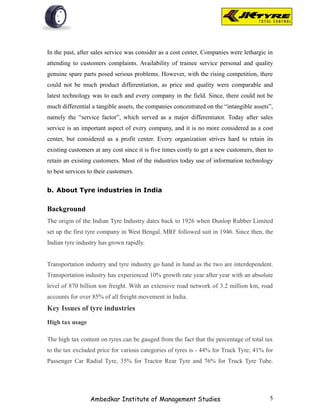
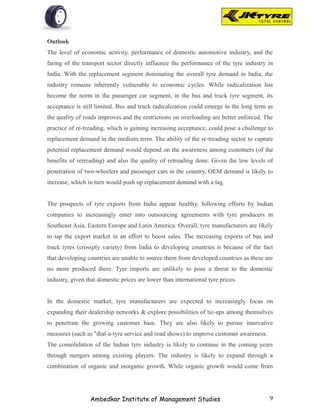
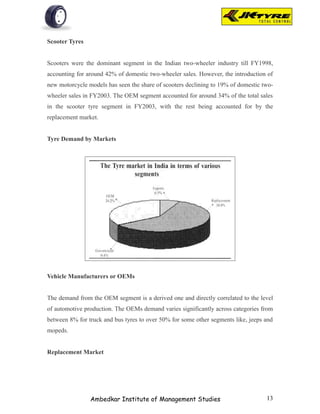
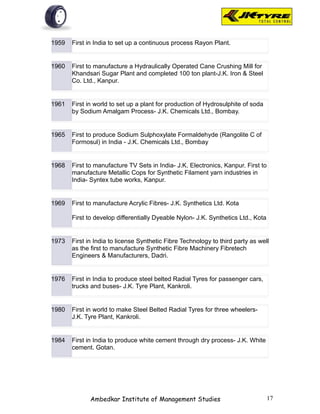
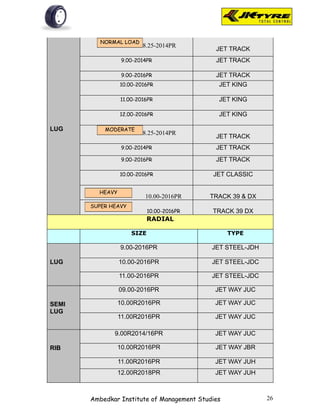
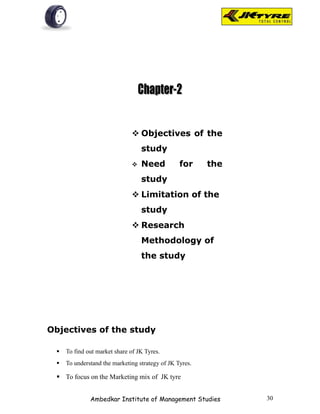
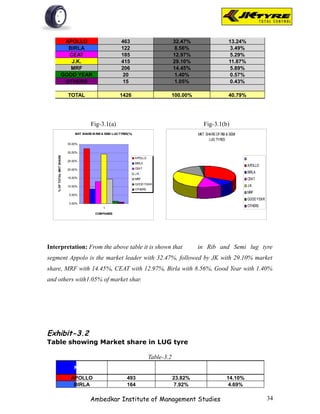
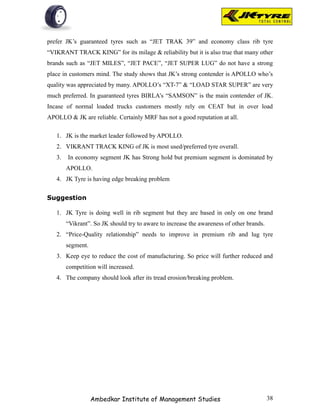
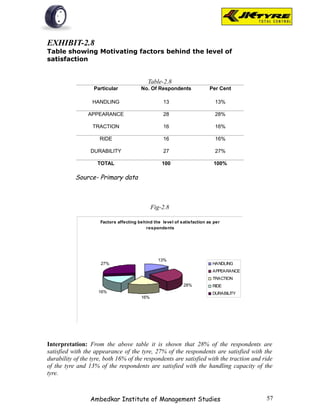
The entry barriers are high for the tyre
industry. It is a highly capital intensive
industry. A plant with an annual capacity of
1.5 million cross-ply tyres costs between Rs.
4,000 and Rs. 5,000 million. A similiar plant
producing radial tyres costs Rs. 8,000
million.
Bargaining Power of the
Bargaining Power of the Suppliers: High
Buyers: High
The OEMs have total control Inter Firm Rivalry: Low The tyre The tyre industry consumes
over prices. In fact, the industry in India is fairly concentrated, nearly 50% of the natural
OEMs faced with declining with the top eight companies accounting rubber produced in the
profitability have also for more than 80% of the total country. The price of natural
reduced the number of production of tyres rubber is controlled by Rubber
component suppliers to make Control Board and the
the supply chain more domestic prices of natural
efficient. rubber have registered a
significant increase in recent
times.
Threat of Substitutes: Low but Increasing
During the FY2002, over 1,10,000 passenger
car tyres were imported. This constitutes over
2% of total radial passenger car tyre
production in the country. However, with the
reduction of peak custom duty, the import of
tyres is likely to increase.
Industry Analysis - Porter's Model
iv. Competitor analysis: analysis of competition how well the market is served.
Marketing mix:
A Marketing mix is the division of groups to make a particular product, by pricing, product,
branding, place, and quality. Although some marketers[who?] have added other P's, such as
personnel and packaging, the fundamentals of marketing typically identifies the four P's of
the marketing mix as referring to:
Ambedkar Institute of Management Studies 23](https://image.slidesharecdn.com/13823112-jk-project-110204044415-phpapp02/85/13823112-jk-project-23-320.jpg)
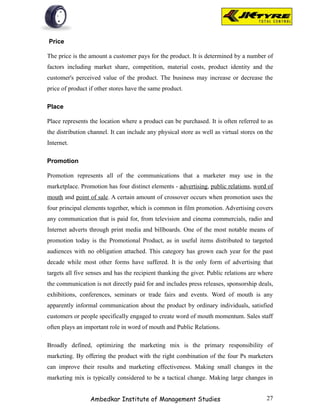
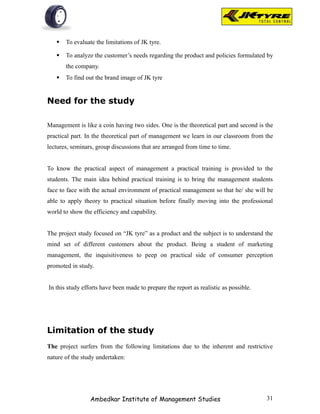
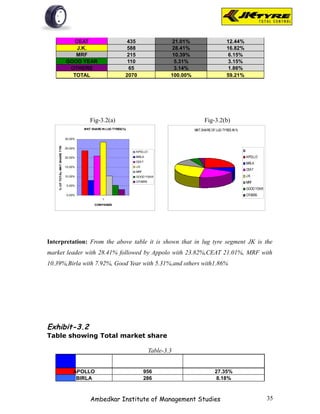
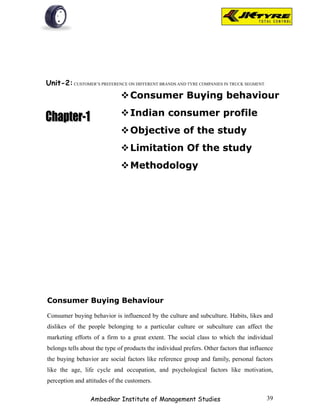
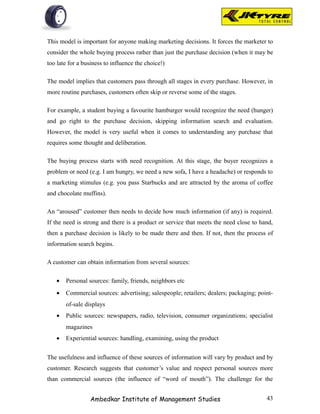
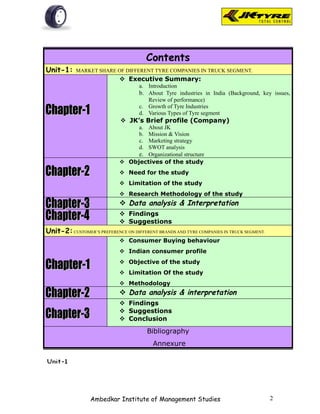
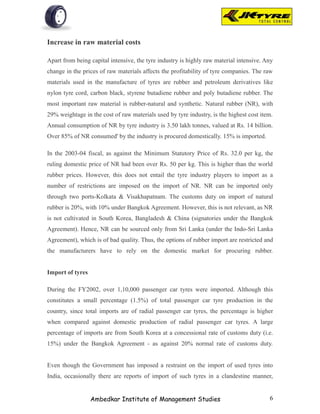
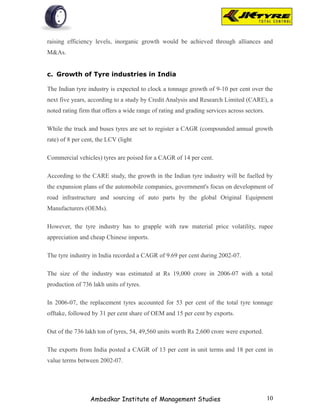
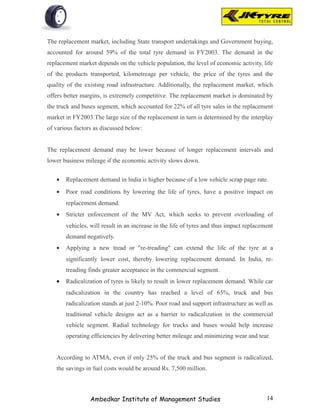
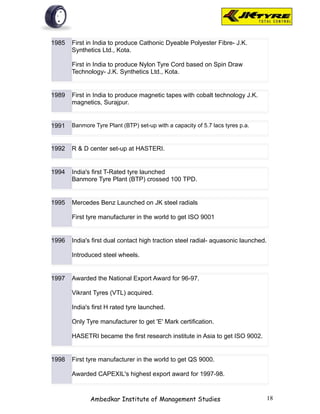
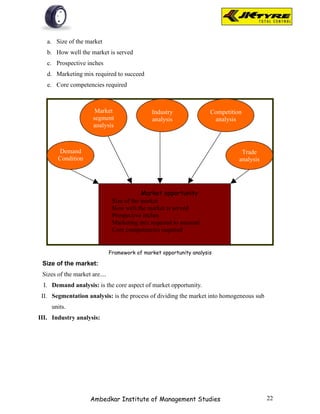
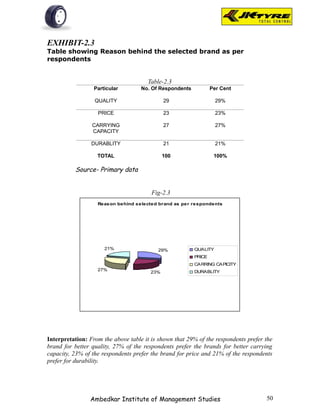
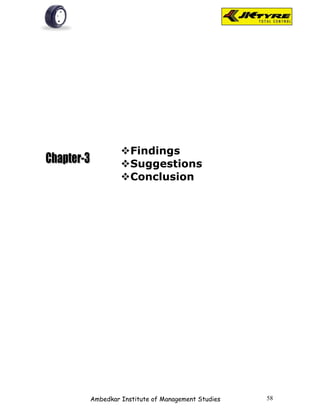
![EXHIBIT-2.1(a)
Table showing Brand preference for front wheel as per
respondents
Table-2.1(a)
Brand No. Of Respondents Per Cent
JK 31 31%
APPOLO 28 28%
MRF 8 8%
BIRLA 23 23%
OTHERS 10 10%
TOTAL 100 100%
Source- Primary data
Fig-2.1(a)
Brand preference for front w heel
10%
31%
JK
23% APPOLO
MRF
BIRLA
OTHERS
8%
28%
Interpretation: From the above table it is shown that majority of the respondents [31]
prefer JK tyer for front wheel because of smooth driving. 28% of respondents prefer
Appolo tyre for better mileage. 8% of respondents prefer MRF tyre for quick service.
23% of the respondents prefer Birla tyre for better claim policy. 10% of the respondents
prefer other brands.
Ambedkar Institute of Management Studies 47](https://image.slidesharecdn.com/13823112-jk-project-110204044415-phpapp02/85/13823112-jk-project-47-320.jpg)
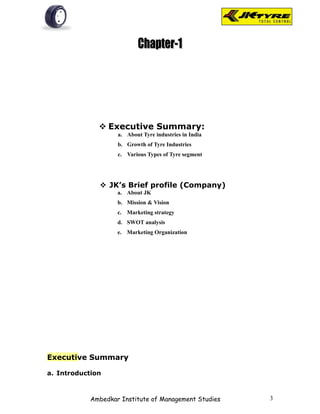
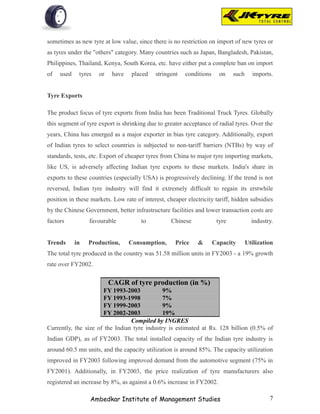
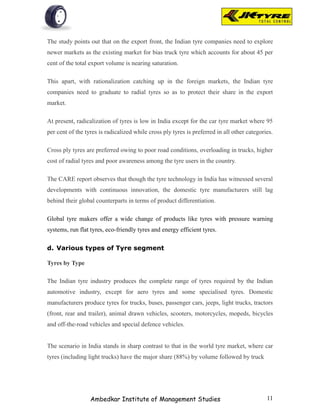
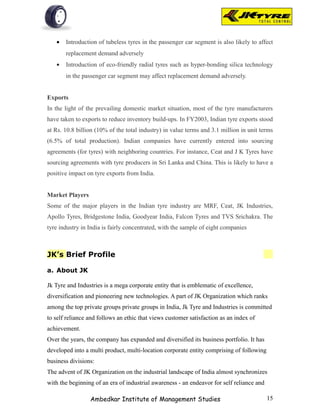
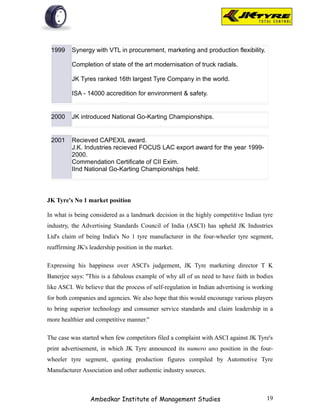
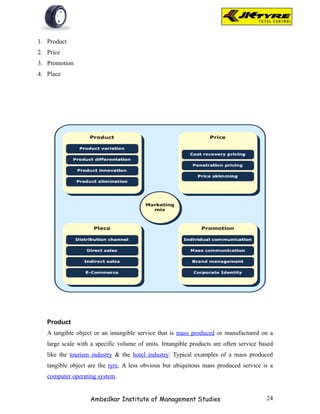
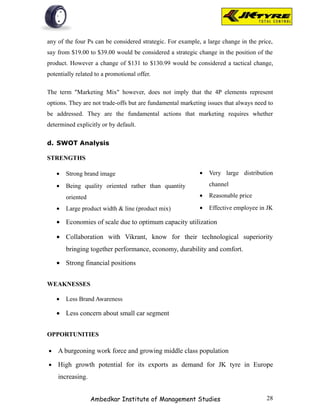
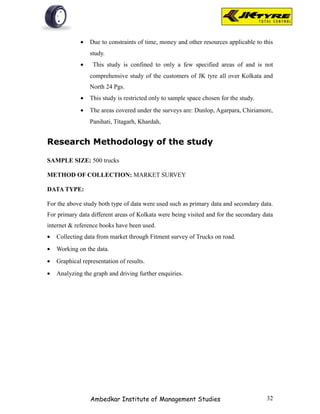
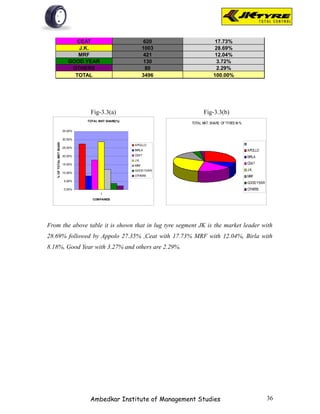
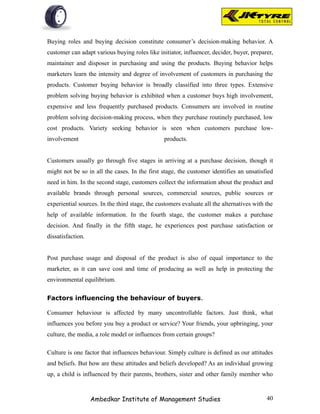
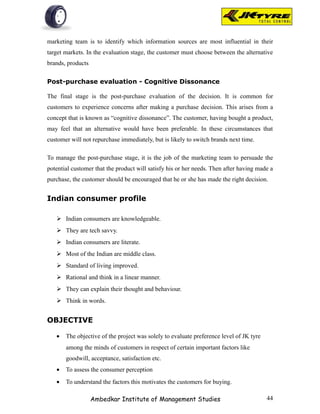
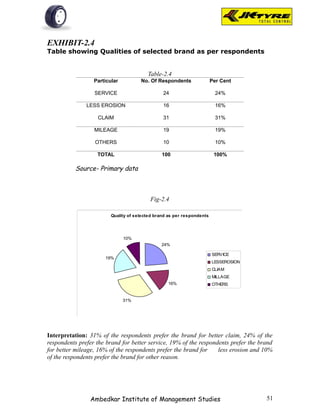
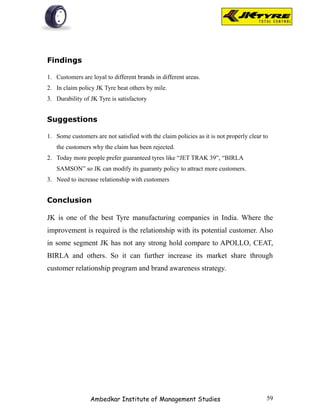
![EXHIBIT-2.1(b)
Table showing Brand preference for rear wheel as per
respondents
Table-2.1(b)
Brand No. Of Respondents Per Cent
JK 28 28%
APPOLO 18 18%
MRF 10 10%
BIRLA 27 27%
OTHERS 17 17%
TOTAL 100 100%
Source- Primary data
Fig-2.1(b)
Brand preference for rear w heel
17%
28% JK
APPOLO
MRF
BIRLA
27%
18% OTHERS
10%
Interpretation: From the above table it is shown that majority of the respondents [28%]
prefer JK tyer for rear wheel because of smooth driving. 18% of respondents prefer
Appolo tyre for better mileage.10% of respondents prefer MRF tyre for quick service.
27% of the respondents prefer Birla tyre for better claim policy. 17% of the respondents
prefer other brands.
Ambedkar Institute of Management Studies 48](https://image.slidesharecdn.com/13823112-jk-project-110204044415-phpapp02/85/13823112-jk-project-48-320.jpg)
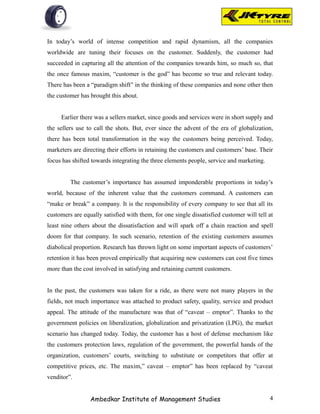
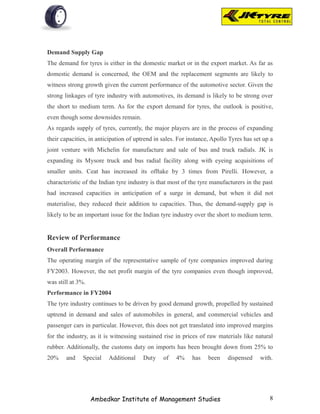
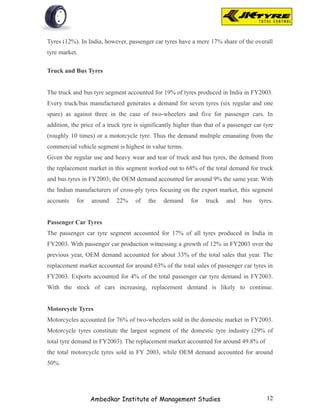
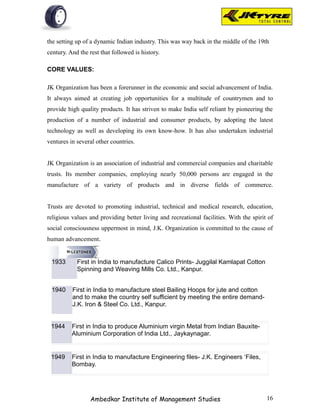
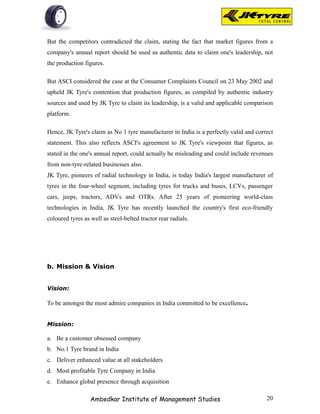
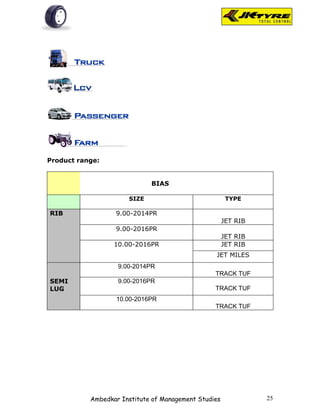
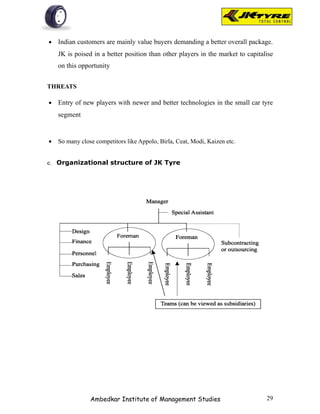
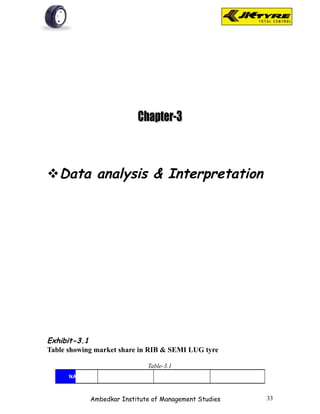
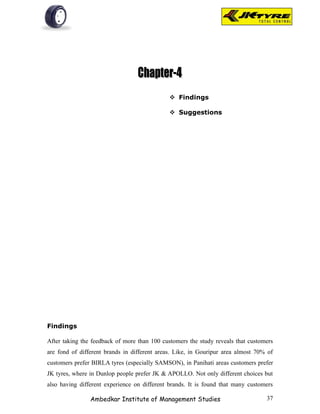
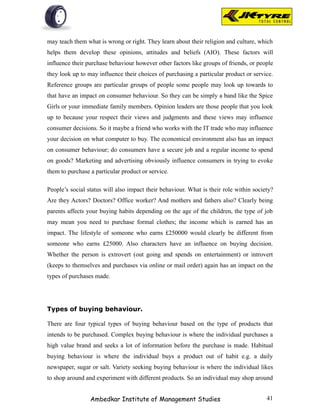
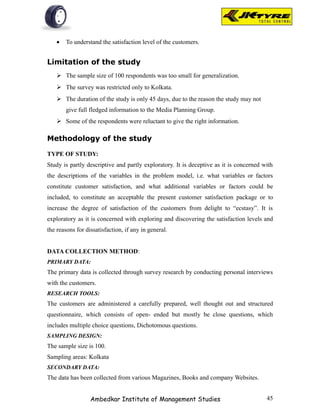
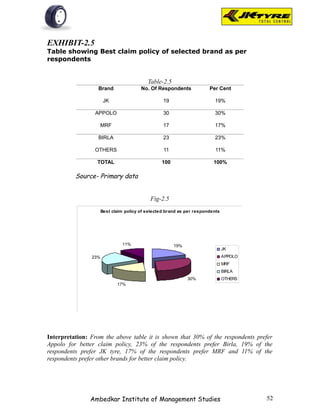
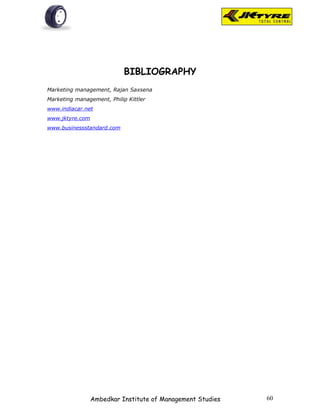
![EXHIBIT-2.2
Table showing Best brand as per respondents
Table-2.2
Brand No. Of Respondents Per Cent
JK 29 29%
APPOLO 27 27%
MRF 5 5%
BIRLA 27 27%
OTHERS 12 12%
TOTAL 100 100%
Source- Primary data
Fig-2.2
Best brand as per respondents
12%
29%
JK
APPOLO
M RF
27% BIRLA
OTHERS
5% 27%
Interpretation: From the above table it is shown that majority of the respondents [29%]
prefer JK tyer because of smooth driving, better quality and reasonable price, etc. 27%
of respondents prefer Appolo tyre for better mileage, good appearance.5% of
respondents prefer MRF tyre for quick service, flexibility. 27% of the respondents prefer
Birla tyre for better claim policy, load capacity. 12% of the respondents prefer other
brands.
Ambedkar Institute of Management Studies 49](https://image.slidesharecdn.com/13823112-jk-project-110204044415-phpapp02/85/13823112-jk-project-49-320.jpg)

The document discusses two units: Unit 1 analyzes the market share of different tyre companies in the truck segment in India. It provides background on the tyre industry in India and discusses key issues like taxes, raw material costs, and imports/exports. It also examines trends in production, consumption, pricing, and capacity utilization. Unit 2 will examine customers' preferences for different tyre brands and companies in the truck segment. It will discuss consumer buying behavior, objectives of the study, and methodology.


