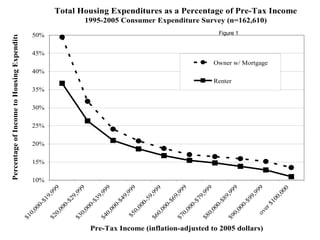
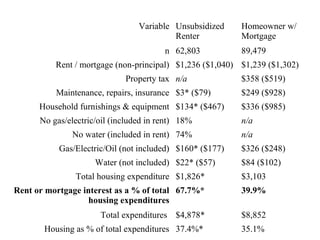
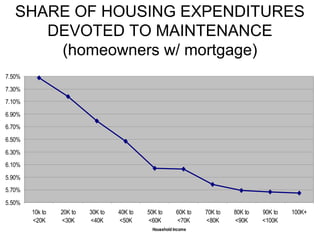
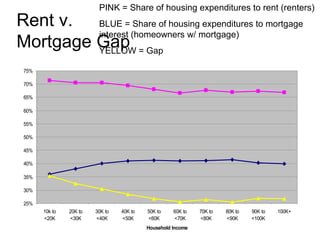
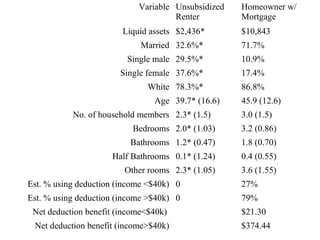
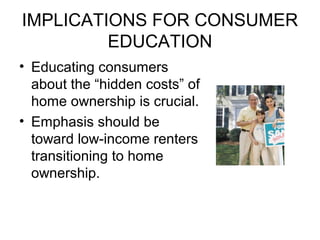
TENANT AND HOMEOWNER
EXPENDITURES: UNCOVERING THE
TRUE COSTS OF HOMEOWNERSHIP
Russell N. James
Andy Carswell
Cliff A. Robb
$$$$
The standard economic model of
consumer behavior and some problems
with it
THE PROBLEM
• Housing = largest budget category in household.
+ Other Expenses:
home maintenance
repair costs
water & trash
property taxes
insurance expenses
Can = Big Money / Miscalculations
OBJECTIVES OF THE STUDY
• Comparison of Housing Related Expenditures:
Renting vs. Owning
• Percentage of Housing Costs:
Renting vs. Owning
RESEARCH QUESTIONS
ADDRESSED
• In what areas do tenants’
housing-related expenditures
differ from housing-related
expenditures of homeowners
with a mortgage?
• How do total housing costs
differ (absolutely and as a %
of income) for similar tenants
and homeowners with a
mortgage?
• Misjudging homeownership
costs can lead to increased
foreclosure risk.
SOME OF THE OBVIOUS EXTRA
COSTS OF HOMEOWNERSHIP
• Mortgage interest
• Property taxes
• Property insurance
SOME OF THE NOT-SO-OBVIOUS
EXTRA COSTS OF HOMEOWNERSHIP
• Home maintenance
• Utility costs
• Excess energy
costs
• Furniture and
appliances
RESEARCH PROCEDURES
• Consumer Expenditure Survey (CE)
• 1995-2005 Data
DATA AND METHODOLOGY
• Consumer
Expenditure Survey
• N = 162,610
• Direct comparison of
renters and
homeowners with a
mortgage
• Analysis of rent vs.
non-principal
mortgage payments
• Additional expenses
related to housing
also analyzed
Figure 1
Total Housing Expenditures as a Percentage of Pre-Tax Income
1995-2005 Consumer Expenditure Survey (n=162,610)
10%
15%
20%
25%
30%
35%
40%
45%
50%
$10,000-$19,999
$20,000-$29,999
$30,000-$39,999
$40,000-$49,999$50,000-59,999
$60,000-$69,999
$70,000-$79,999
$80,000-$89,999
$90,000-$99,999over$100,000
Pre-Tax Income (inflation-adjusted to 2005 dollars)
PercentageofIncometoHousingExpenditures
Owner w/ Mortgage
Renter
Variable Unsubsidized
Renter
Homeowner w/
Mortgage
n 62,803 89,479
Rent / mortgage (non-principal) $1,236 ($1,040) $1,239 ($1,302)
Property tax n/a $358 ($519)
Maintenance, repairs, insurance $3* ($79) $249 ($928)
Household furnishings & equipment $134* ($467) $336 ($985)
No gas/electric/oil (included in rent) 18% n/a
No water (included in rent) 74% n/a
Gas/Electric/Oil (not included) $160* ($177) $326 ($248)
Water (not included) $22* ($57) $84 ($102)
Total housing expenditure $1,826* $3,103
Rent or mortgage interest as a % of total
housing expenditures
67.7%* 39.9%
Total expenditures $4,878* $8,852
Housing as % of total expenditures 37.4%* 35.1%
SHARE OF HOUSING EXPENDITURES
DEVOTED TO MAINTENANCE
(homeowners w/ mortgage)
5.50%
5.70%
5.90%
6.10%
6.30%
6.50%
6.70%
6.90%
7.10%
7.30%
7.50%
10k to
<20K
20K to
<30K
30K to
<40K
40K to
<50K
50K to
<60K
60K to
<70K
70K to
<80K
80K to
<90K
90K to
<100K
100K+
Household Income
Rent v.
Mortgage Gap
PINK = Share of housing expenditures to rent (renters)
BLUE = Share of housing expenditures to mortgage
interest (homeowners w/ mortgage)
YELLOW = Gap
25%
30%
35%
40%
45%
50%
55%
60%
65%
70%
75%
10k to
<20K
20K to
<30K
30K to
<40K
40K to
<50K
50K to
<60K
60K to
<70K
70K to
<80K
80K to
<90K
90K to
<100K
100K+
Household Income
Variable Unsubsidized
Renter
Homeowner w/
Mortgage
Liquid assets $2,436* $10,843
Married 32.6%* 71.7%
Single male 29.5%* 10.9%
Single female 37.6%* 17.4%
White 78.3%* 86.8%
Age 39.7* (16.6) 45.9 (12.6)
No. of household members 2.3* (1.5) 3.0 (1.5)
Bedrooms 2.0* (1.03) 3.2 (0.86)
Bathrooms 1.2* (0.47) 1.8 (0.70)
Half Bathrooms 0.1* (1.24) 0.4 (0.55)
Other rooms 2.3* (1.05) 3.6 (1.55)
Est. % using deduction (income <$40k) 0 27%
Est. % using deduction (income >$40k) 0 79%
Net deduction benefit (income<$40k) $21.30
Net deduction benefit (income>$40k) $374.44
IMPLICATIONS FOR CONSUMER
EDUCATION
• Educating consumers
about the “hidden costs” of
home ownership is crucial.
• Emphasis should be
toward low-income renters
transitioning to home
ownership.
DISCUSSION POINTS
• Do first time
homebuyers accurately
project costs?
• Does the increase in
foreclosures add even
more to HO costs?
• Do homeownership
counselors accurately
incorporate such costs
into their sessions?

Rent vs. Own Slide Show

  • 1.
    TENANT AND HOMEOWNER EXPENDITURES:UNCOVERING THE TRUE COSTS OF HOMEOWNERSHIP Russell N. James Andy Carswell Cliff A. Robb $$$$
  • 3.
    The standard economicmodel of consumer behavior and some problems with it
  • 4.
    THE PROBLEM • Housing= largest budget category in household. + Other Expenses: home maintenance repair costs water & trash property taxes insurance expenses Can = Big Money / Miscalculations
  • 5.
    OBJECTIVES OF THESTUDY • Comparison of Housing Related Expenditures: Renting vs. Owning • Percentage of Housing Costs: Renting vs. Owning
  • 6.
    RESEARCH QUESTIONS ADDRESSED • Inwhat areas do tenants’ housing-related expenditures differ from housing-related expenditures of homeowners with a mortgage? • How do total housing costs differ (absolutely and as a % of income) for similar tenants and homeowners with a mortgage? • Misjudging homeownership costs can lead to increased foreclosure risk.
  • 7.
    SOME OF THEOBVIOUS EXTRA COSTS OF HOMEOWNERSHIP • Mortgage interest • Property taxes • Property insurance
  • 8.
    SOME OF THENOT-SO-OBVIOUS EXTRA COSTS OF HOMEOWNERSHIP • Home maintenance • Utility costs • Excess energy costs • Furniture and appliances
  • 9.
    RESEARCH PROCEDURES • ConsumerExpenditure Survey (CE) • 1995-2005 Data
  • 10.
    DATA AND METHODOLOGY •Consumer Expenditure Survey • N = 162,610 • Direct comparison of renters and homeowners with a mortgage • Analysis of rent vs. non-principal mortgage payments • Additional expenses related to housing also analyzed
  • 11.
    Figure 1 Total HousingExpenditures as a Percentage of Pre-Tax Income 1995-2005 Consumer Expenditure Survey (n=162,610) 10% 15% 20% 25% 30% 35% 40% 45% 50% $10,000-$19,999 $20,000-$29,999 $30,000-$39,999 $40,000-$49,999$50,000-59,999 $60,000-$69,999 $70,000-$79,999 $80,000-$89,999 $90,000-$99,999over$100,000 Pre-Tax Income (inflation-adjusted to 2005 dollars) PercentageofIncometoHousingExpenditures Owner w/ Mortgage Renter
  • 12.
    Variable Unsubsidized Renter Homeowner w/ Mortgage n62,803 89,479 Rent / mortgage (non-principal) $1,236 ($1,040) $1,239 ($1,302) Property tax n/a $358 ($519) Maintenance, repairs, insurance $3* ($79) $249 ($928) Household furnishings & equipment $134* ($467) $336 ($985) No gas/electric/oil (included in rent) 18% n/a No water (included in rent) 74% n/a Gas/Electric/Oil (not included) $160* ($177) $326 ($248) Water (not included) $22* ($57) $84 ($102) Total housing expenditure $1,826* $3,103 Rent or mortgage interest as a % of total housing expenditures 67.7%* 39.9% Total expenditures $4,878* $8,852 Housing as % of total expenditures 37.4%* 35.1%
  • 13.
    SHARE OF HOUSINGEXPENDITURES DEVOTED TO MAINTENANCE (homeowners w/ mortgage) 5.50% 5.70% 5.90% 6.10% 6.30% 6.50% 6.70% 6.90% 7.10% 7.30% 7.50% 10k to <20K 20K to <30K 30K to <40K 40K to <50K 50K to <60K 60K to <70K 70K to <80K 80K to <90K 90K to <100K 100K+ Household Income
  • 14.
    Rent v. Mortgage Gap PINK= Share of housing expenditures to rent (renters) BLUE = Share of housing expenditures to mortgage interest (homeowners w/ mortgage) YELLOW = Gap 25% 30% 35% 40% 45% 50% 55% 60% 65% 70% 75% 10k to <20K 20K to <30K 30K to <40K 40K to <50K 50K to <60K 60K to <70K 70K to <80K 80K to <90K 90K to <100K 100K+ Household Income
  • 15.
    Variable Unsubsidized Renter Homeowner w/ Mortgage Liquidassets $2,436* $10,843 Married 32.6%* 71.7% Single male 29.5%* 10.9% Single female 37.6%* 17.4% White 78.3%* 86.8% Age 39.7* (16.6) 45.9 (12.6) No. of household members 2.3* (1.5) 3.0 (1.5) Bedrooms 2.0* (1.03) 3.2 (0.86) Bathrooms 1.2* (0.47) 1.8 (0.70) Half Bathrooms 0.1* (1.24) 0.4 (0.55) Other rooms 2.3* (1.05) 3.6 (1.55) Est. % using deduction (income <$40k) 0 27% Est. % using deduction (income >$40k) 0 79% Net deduction benefit (income<$40k) $21.30 Net deduction benefit (income>$40k) $374.44
  • 16.
    IMPLICATIONS FOR CONSUMER EDUCATION •Educating consumers about the “hidden costs” of home ownership is crucial. • Emphasis should be toward low-income renters transitioning to home ownership.
  • 17.
    DISCUSSION POINTS • Dofirst time homebuyers accurately project costs? • Does the increase in foreclosures add even more to HO costs? • Do homeownership counselors accurately incorporate such costs into their sessions?