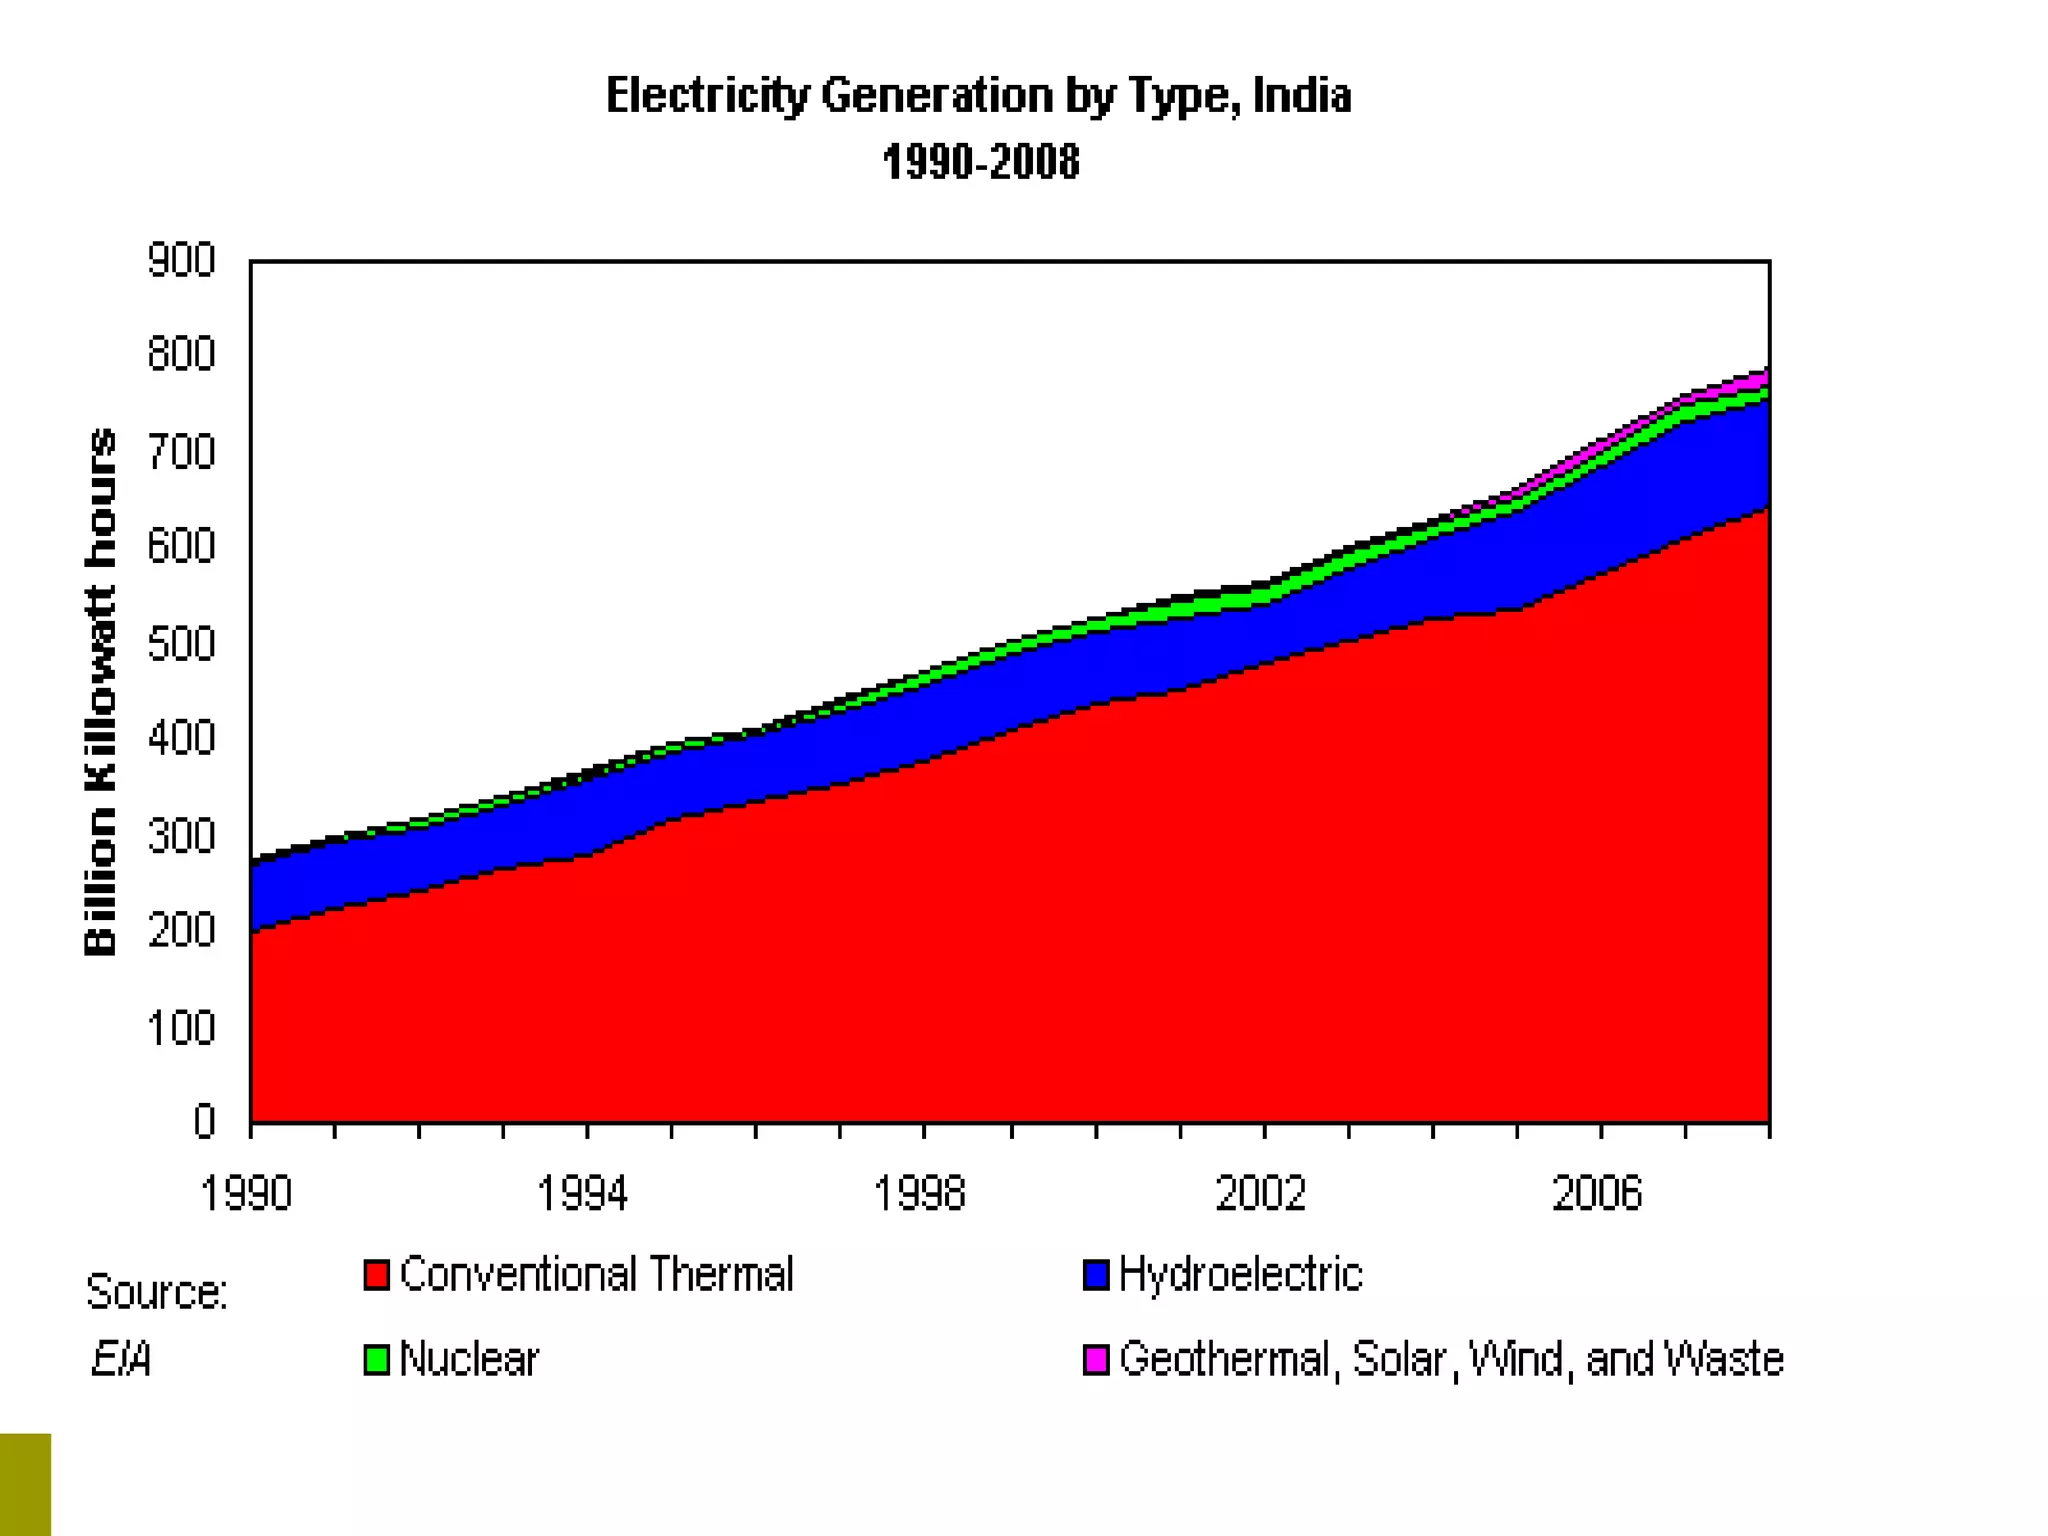
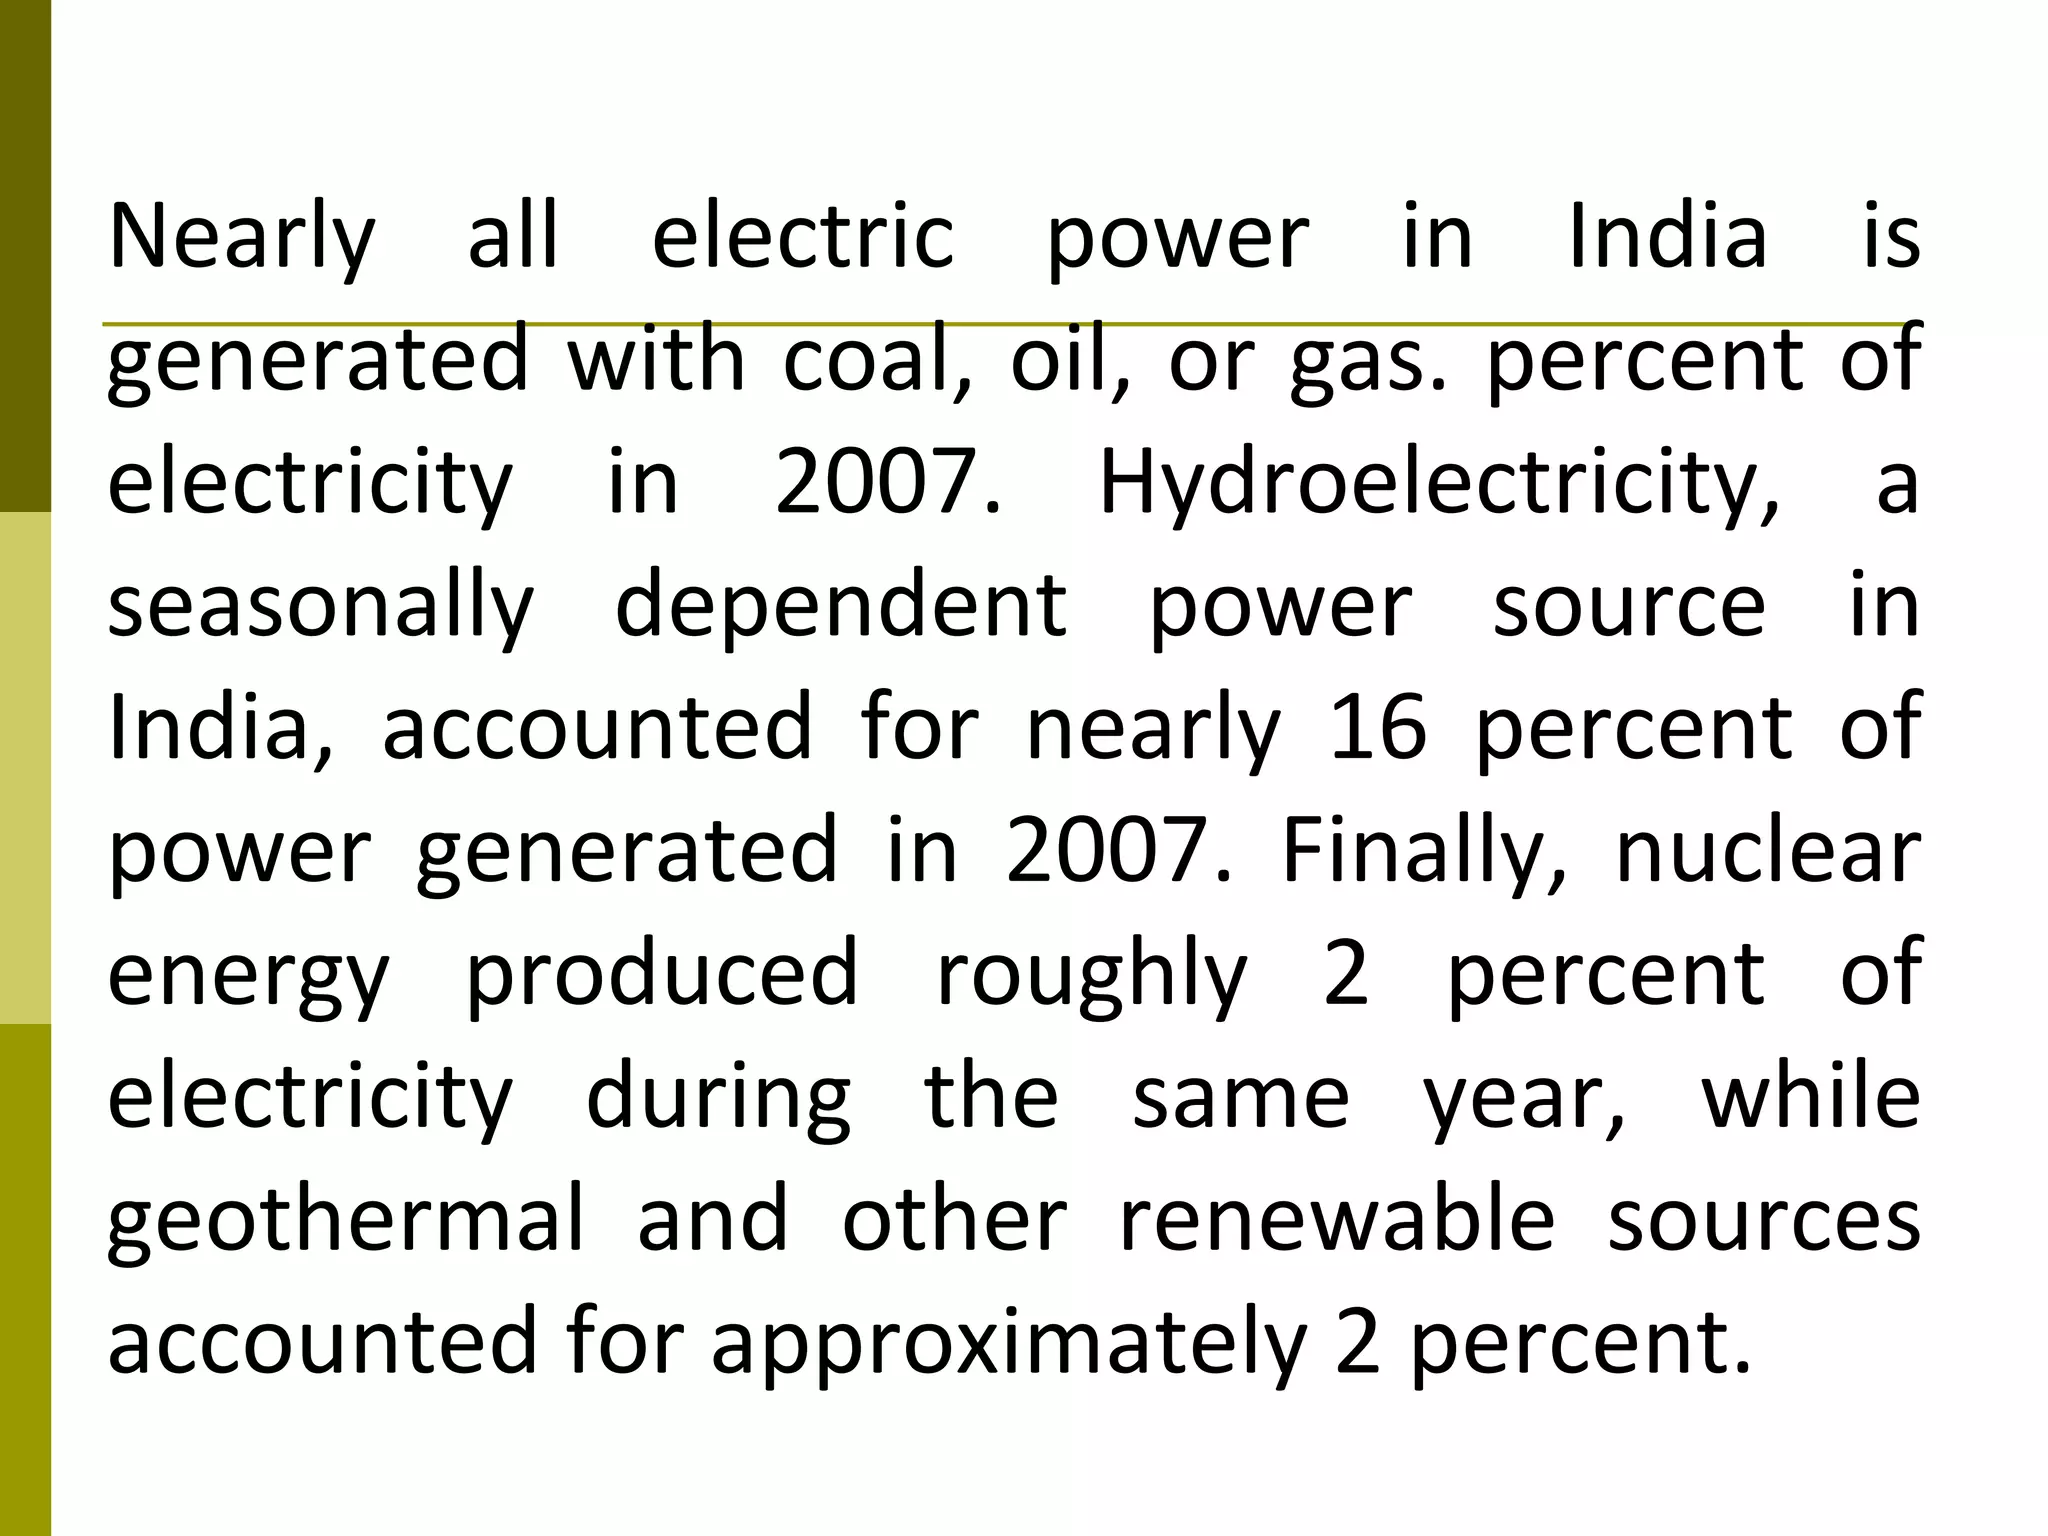
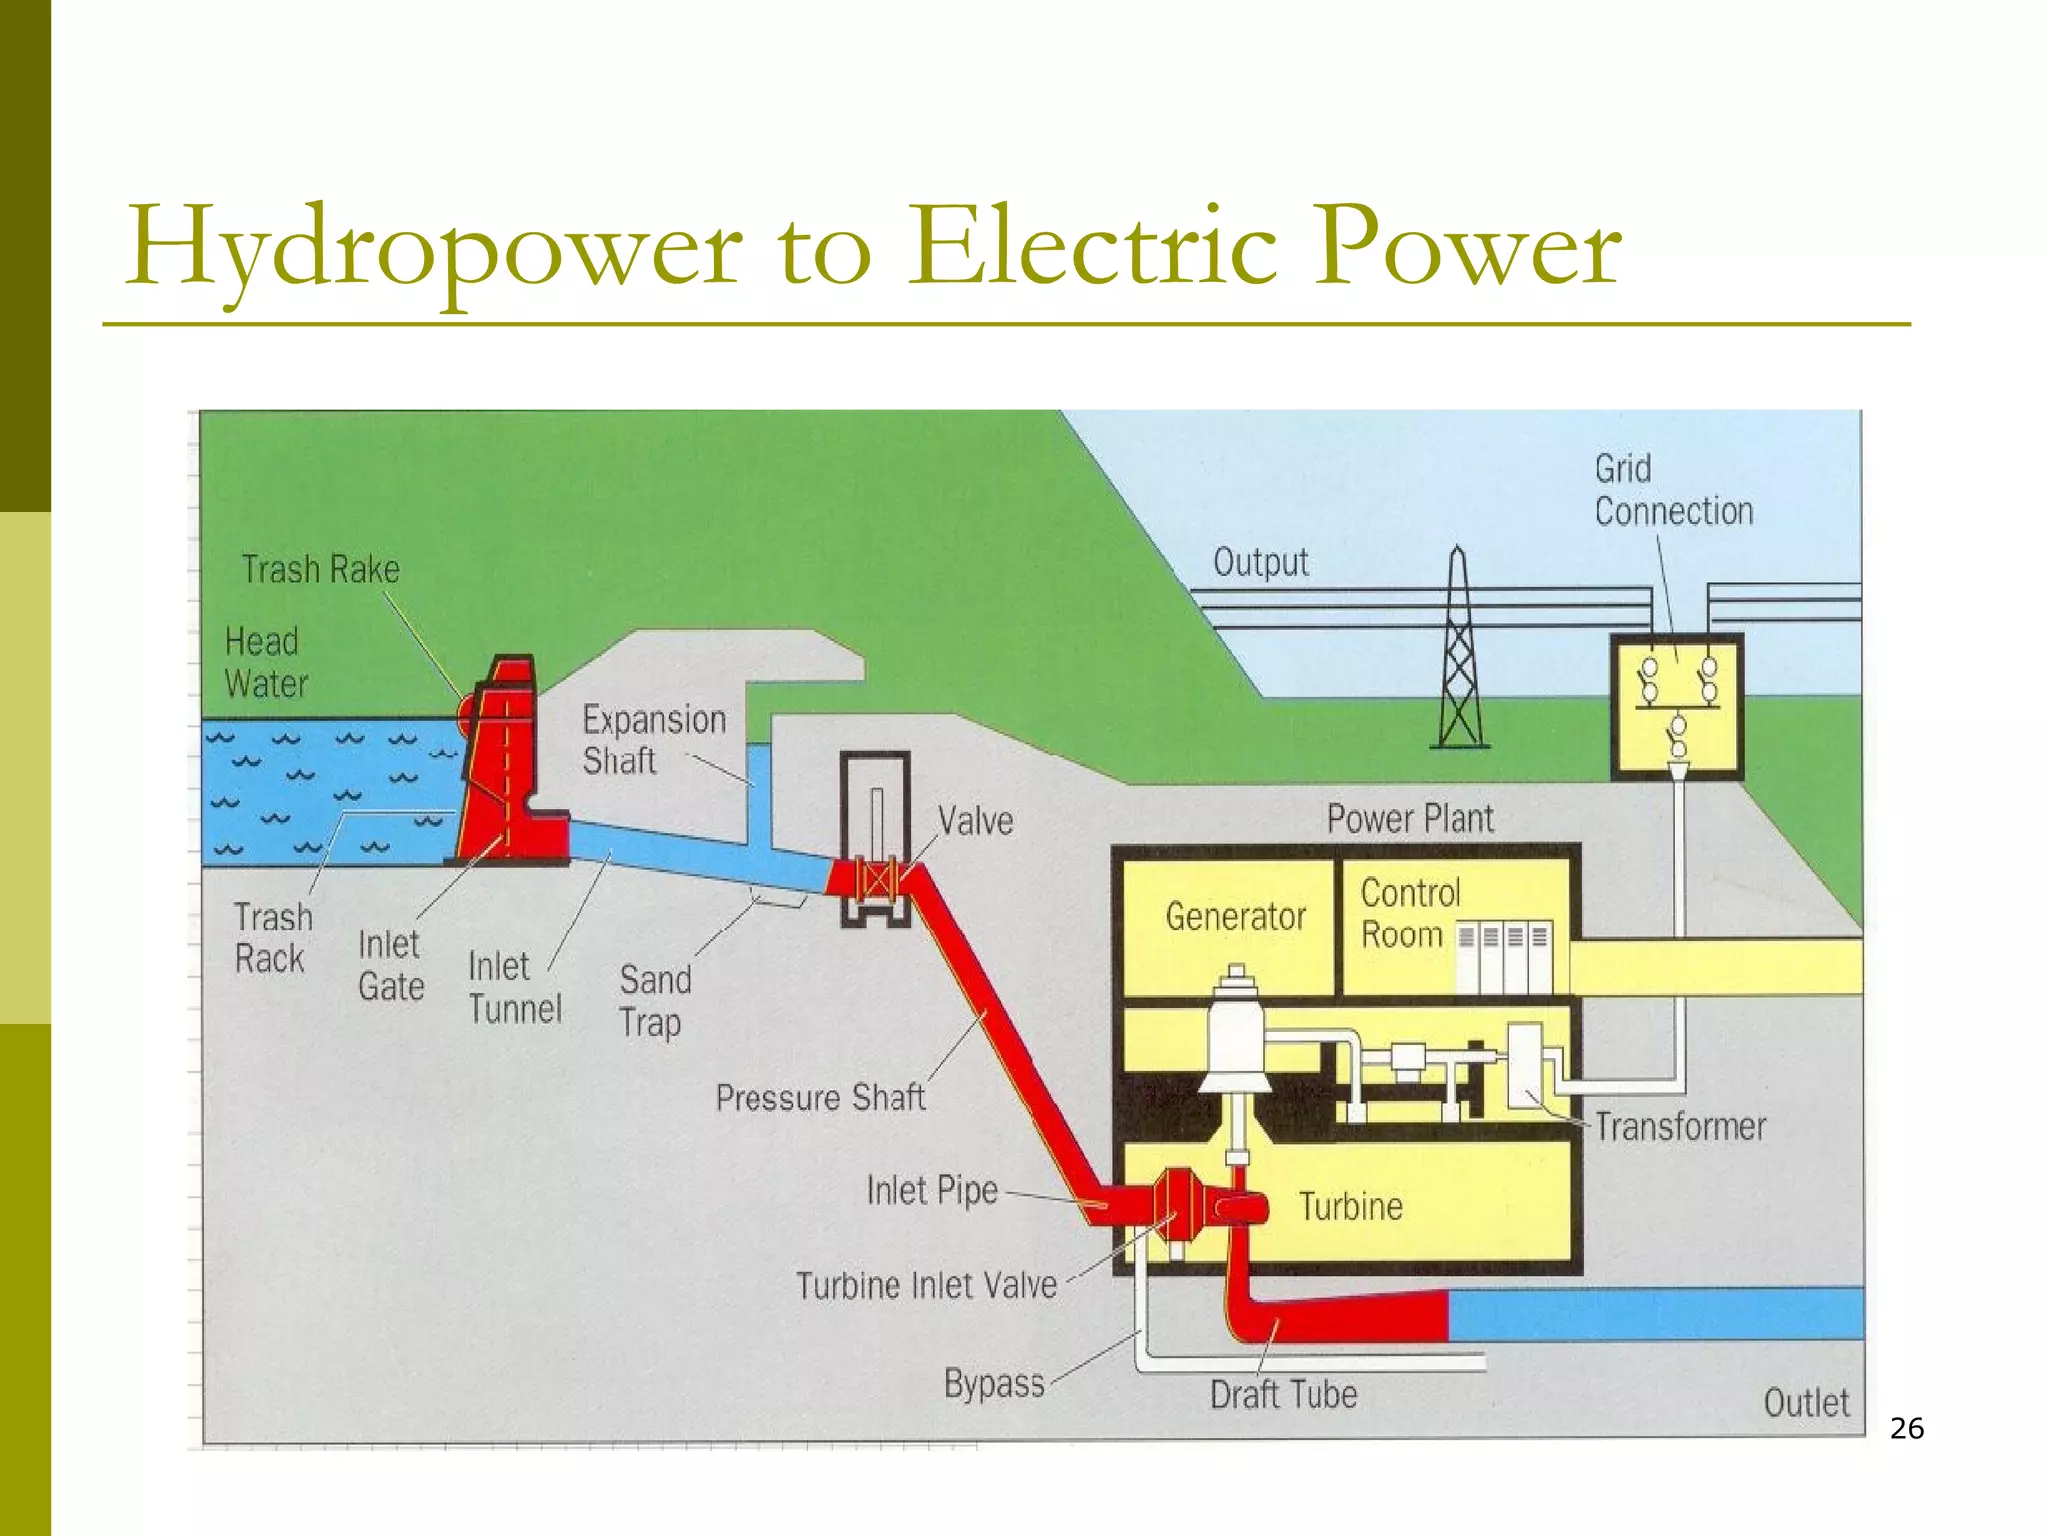
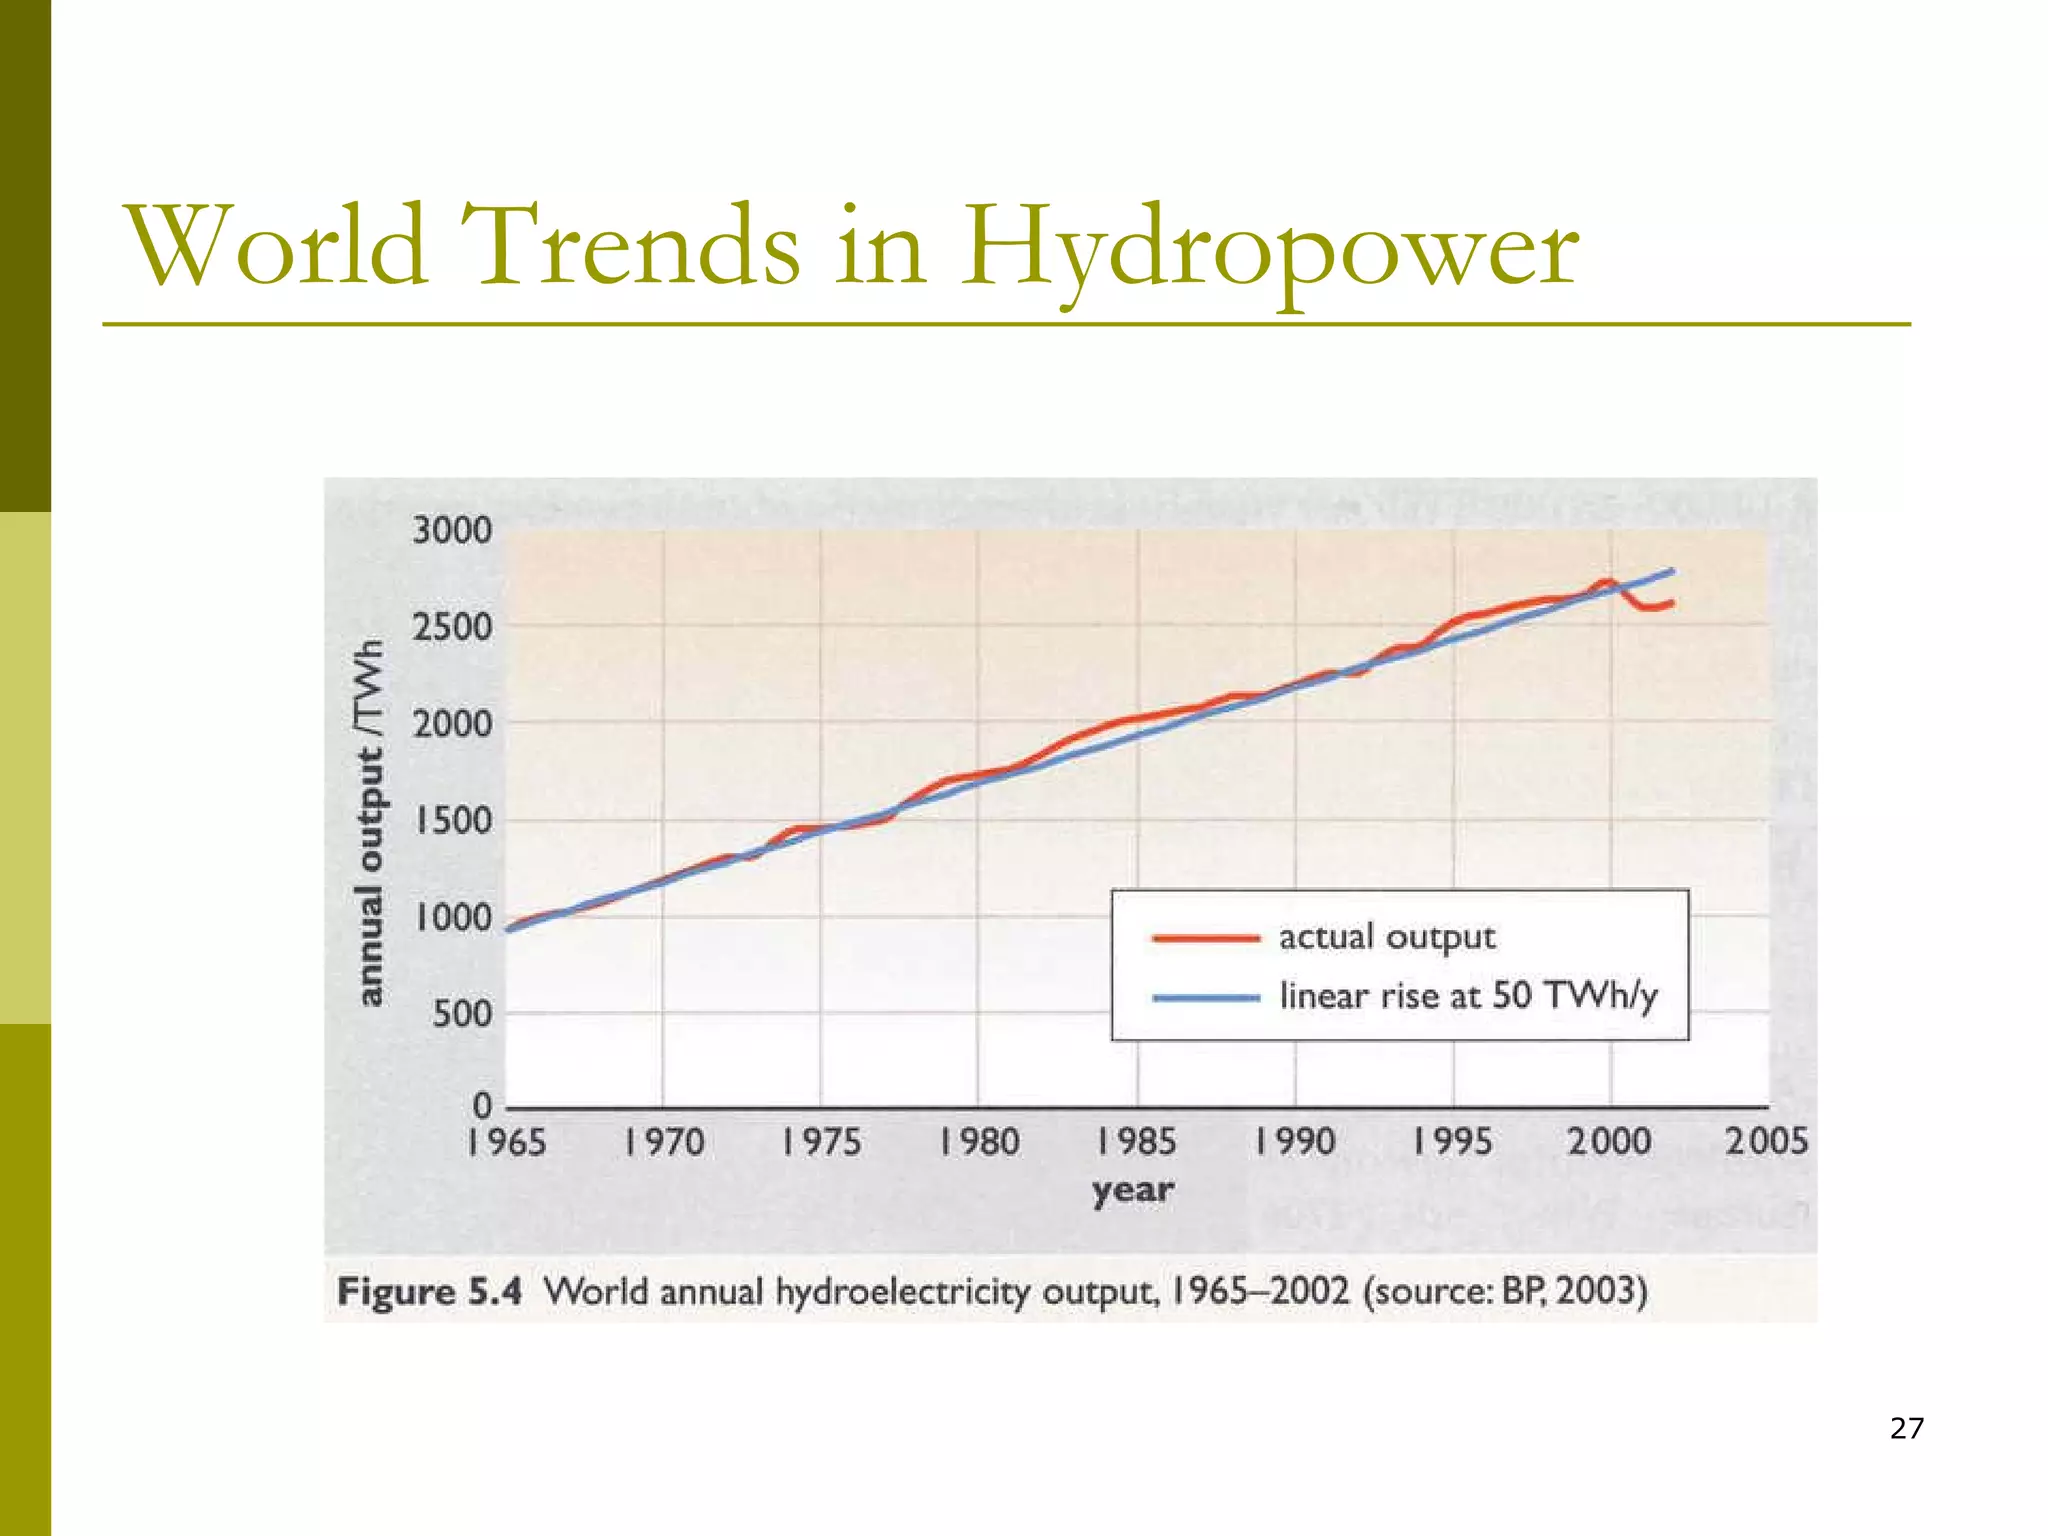
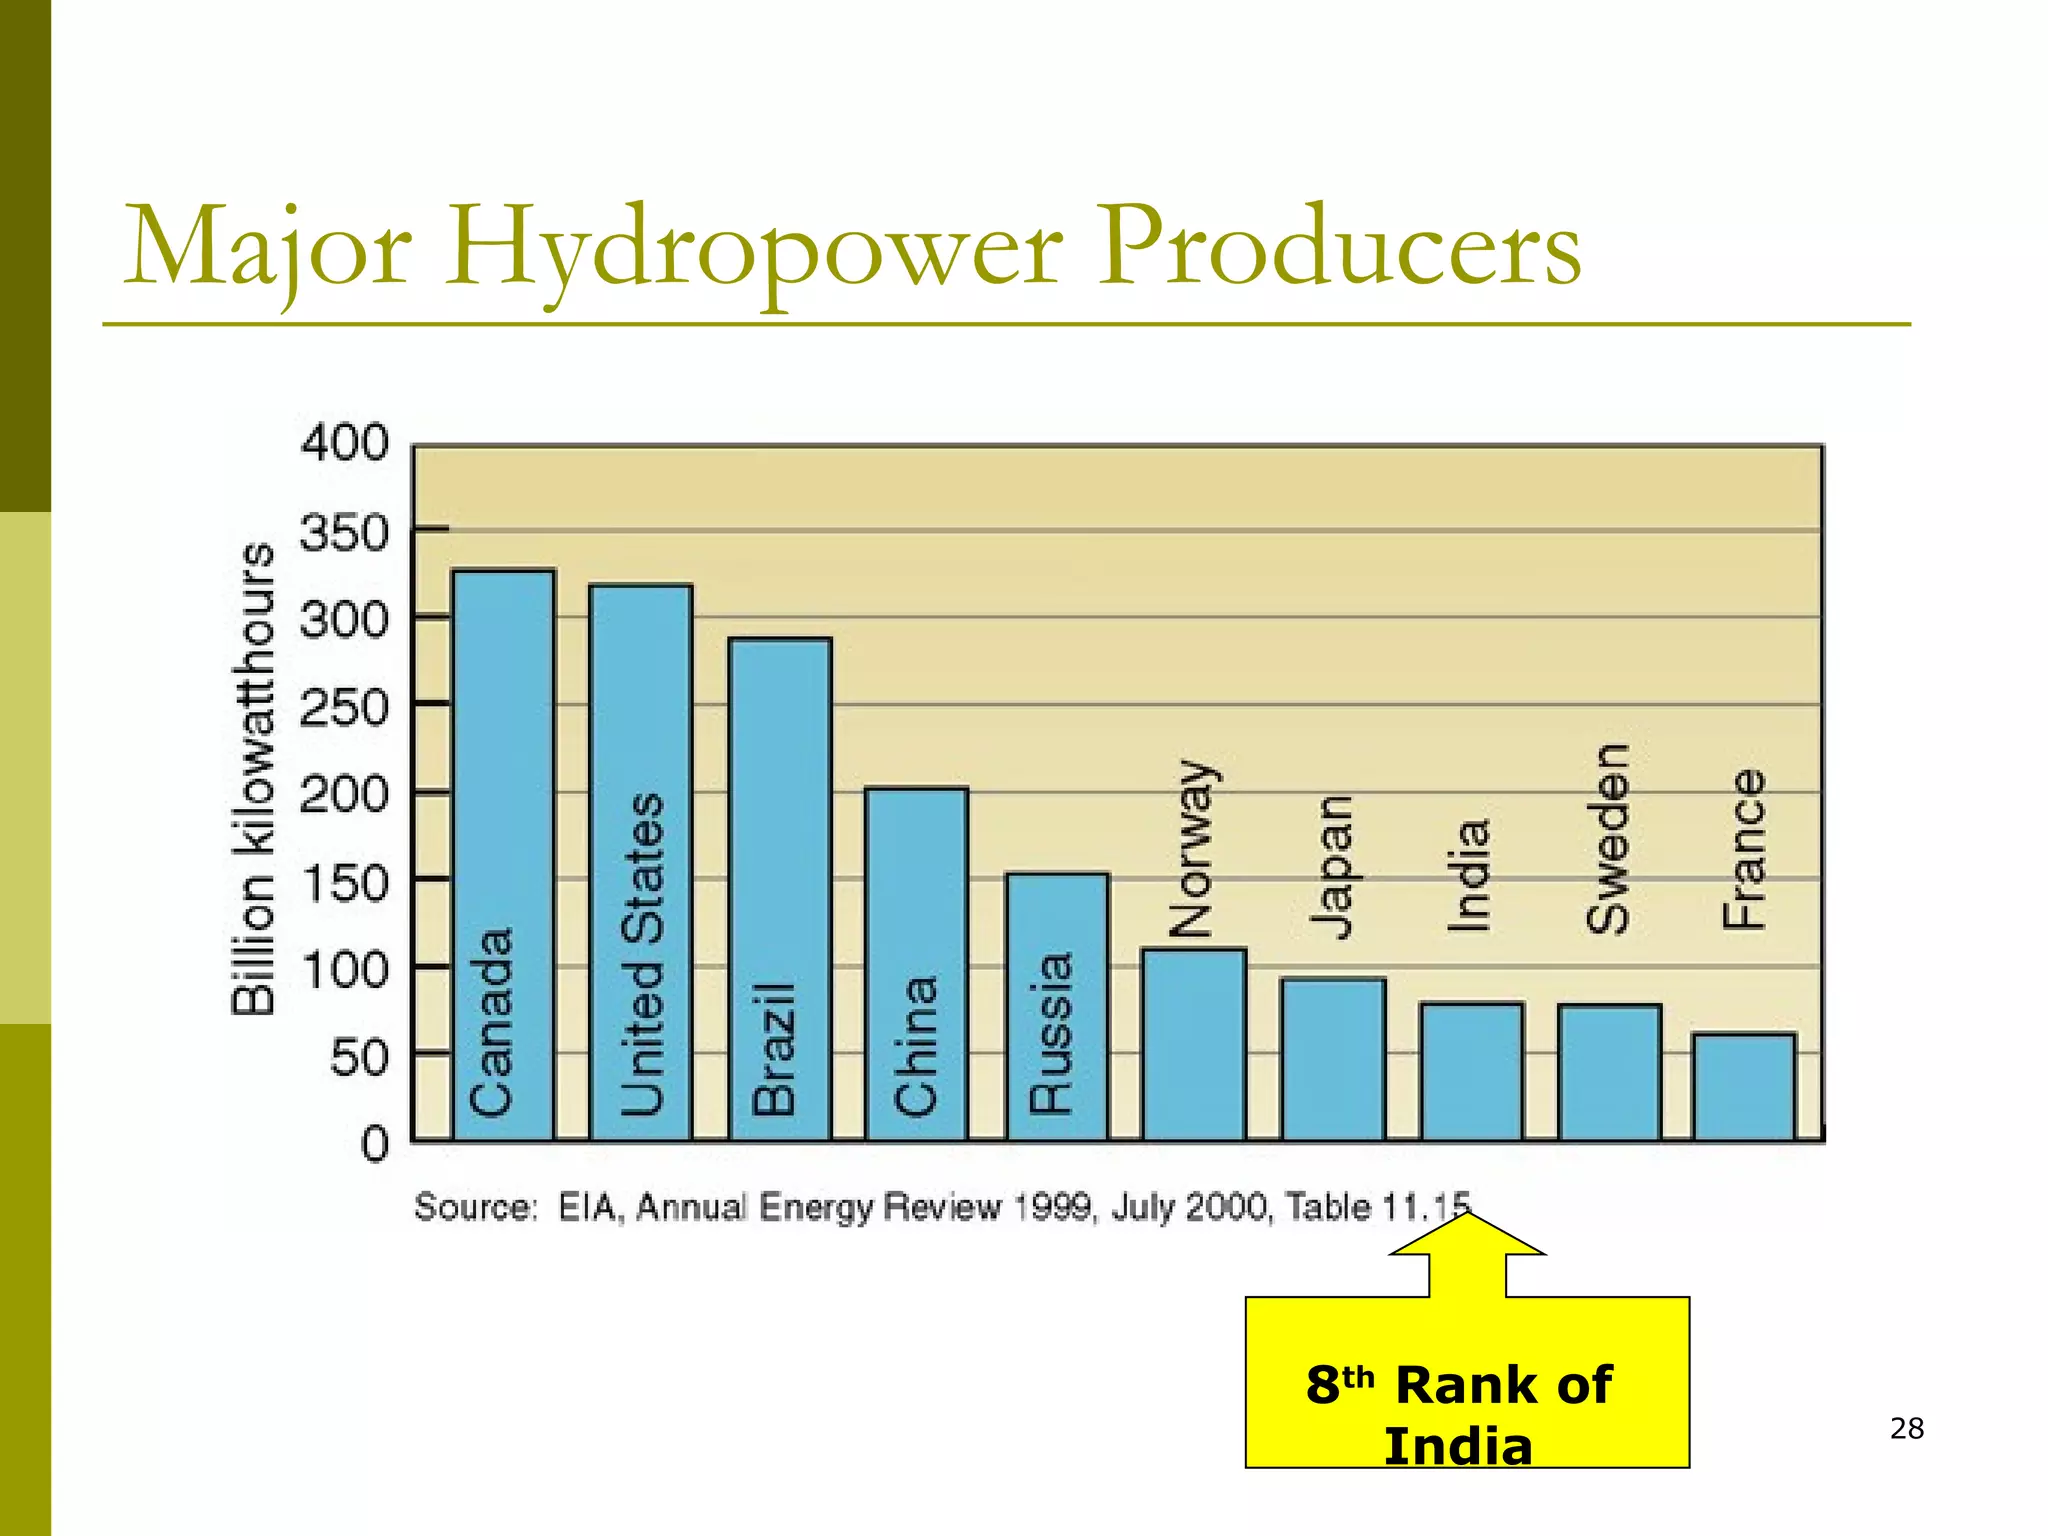
![OUR INDIA AT GLANCE
• Installed generating Capacity 159000MW
• Energy Generated 761000MUs
• Conventional thermal sources 80 %
• Hydro electricity 16 %
• Nuclear energy produced roughly 2%
• Renewable, [Geothermal & other] sources 2%
(All above fig are approximate for 2007)](https://image.slidesharecdn.com/renewablehydropower-130630120820-phpapp01/75/Best-ppt-onRenewable-hydropower-9-2048.jpg)


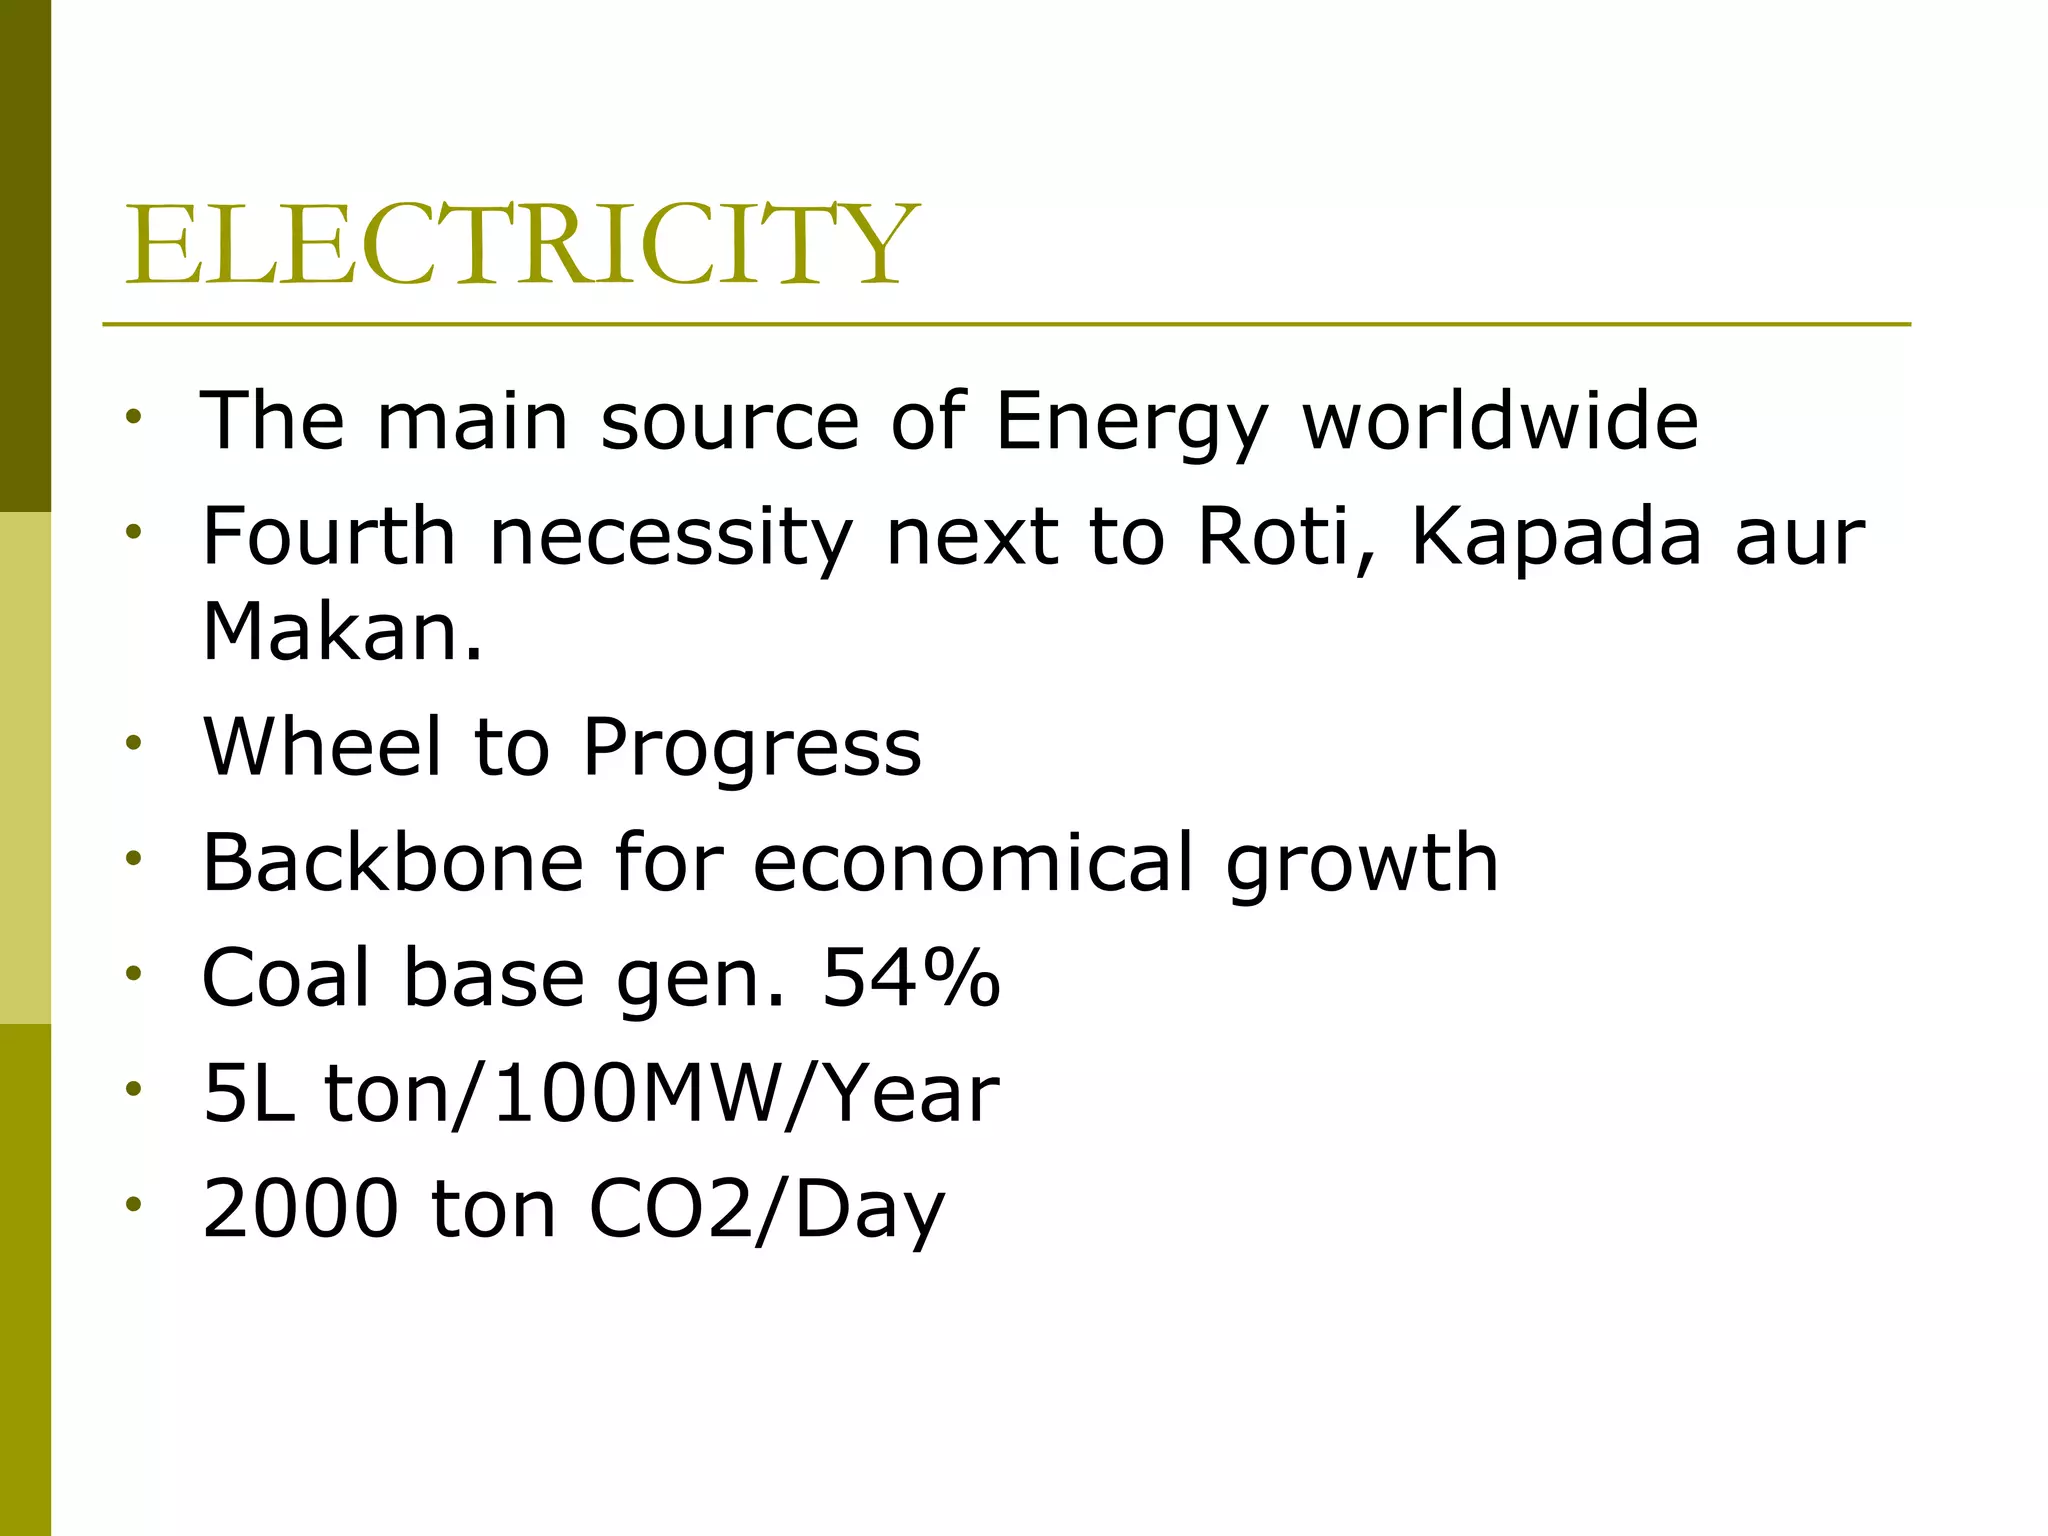
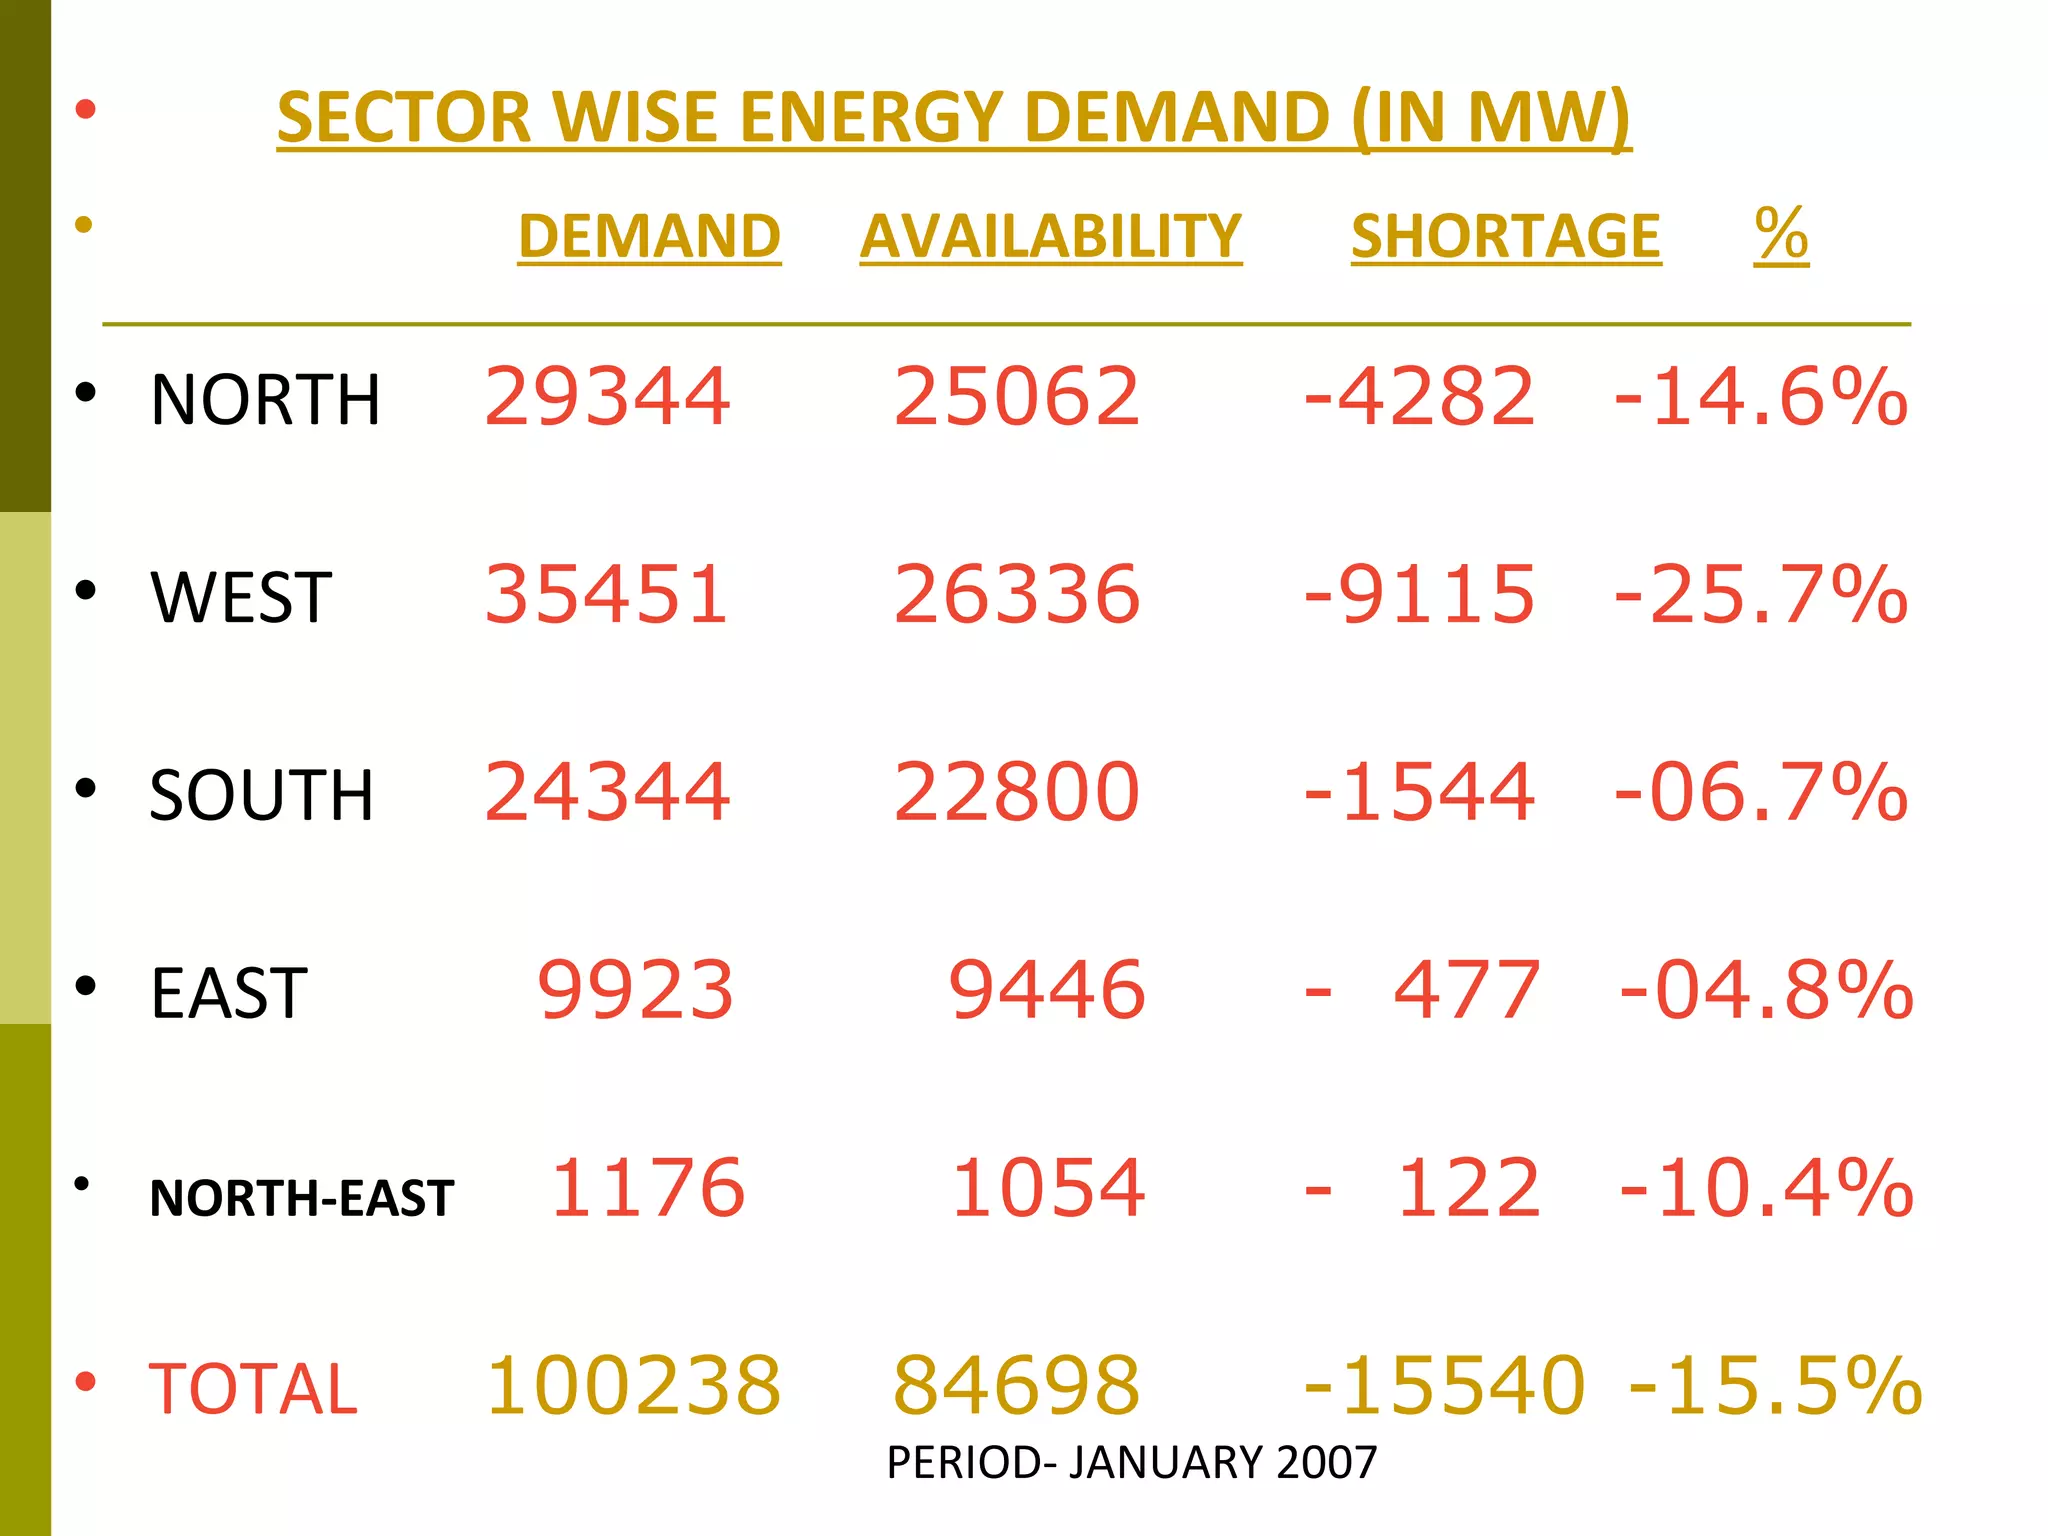
The document discusses India's energy crisis and reliance on coal for electricity generation. It notes that India faces significant power shortages, with demand outstripping increases in capacity. Nearly all electricity is generated from coal, oil, gas, hydro, and nuclear sources. Hydro provides around 16% of electricity but is dependent on seasonal factors. The document outlines India's installed capacity and generation figures as well as future plans to increase capacity. It also discusses various renewable energy sources including solar, wind and biomass as alternatives to address the shortage issues.


