GROUP ME!
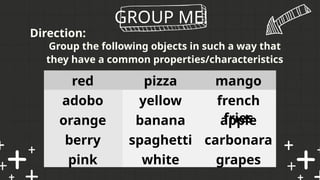
Group thefollowing objects in such a way that
they have a common properties/characteristics
Direction:
red
adobo
orange
berry
pink
pizza
yellow
banana
spaghetti
white
mango
french
fries
apple
carbonara
grapes
5.
GROUP ME!
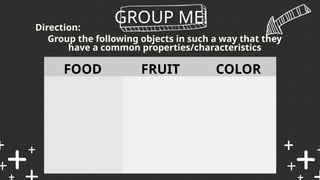
Group thefollowing objects in such a way that they
have a common properties/characteristics
Direction:
FOOD FRUIT COLOR
6.
GROUP ME!
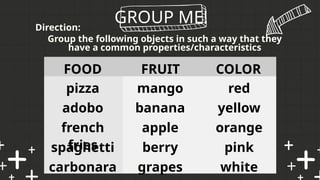
Group thefollowing objects in such a way that they
have a common properties/characteristics
Direction:
FOOD FRUIT COLOR
red
yellow
orange
pink
white
mango
banana
apple
berry
grapes
pizza
adobo
french
fries
spaghetti
carbonara
How many elementsare there in the given set
of ordered pairs
What elements belong to the first set? What
elements belong to the second set?
How do we illustrate/represent the set of
ordered pairs?
OBJECTIVES
At the endof the lesson, the student must be able to:
a. illustrate a relation and a function.
11.
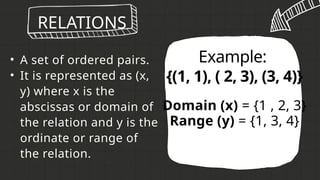
• A setof ordered pairs.
• It is represented as (x,
y) where x is the
abscissas or domain of
the relation and y is the
ordinate or range of
the relation.
RELATIONS
Example:
{(1, 1), ( 2, 3), (3, 4)}
Domain (x) = {1 , 2, 3}
Range (y) = {1, 3, 4}
12.
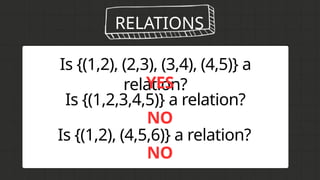
RELATIONS
Is {(1,2), (2,3),(3,4), (4,5)} a
relation?
Is {(1,2,3,4,5)} a relation?
Is {(1,2), (4,5,6)} a relation?
YES
NO
NO
13.
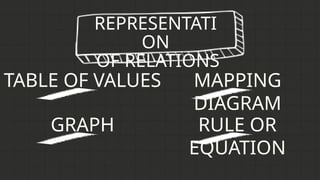
TABLE OF VALUESMAPPING
DIAGRAM
GRAPH RULE OR
EQUATION
REPRESENTATI
ON
OF RELATIONS
14.
REPRESENTATION OF
RELATIONS
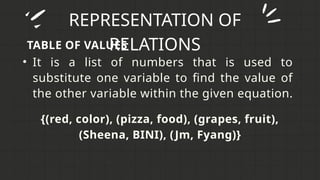
TABLE OFVALUES
• It is a list of numbers that is used to
substitute one variable to find the value of
the other variable within the given equation.
{(red, color), (pizza, food), (grapes, fruit),
(Sheena, BINI), (Jm, Fyang)}
15.
REPRESENTATION OF
RELATIONS
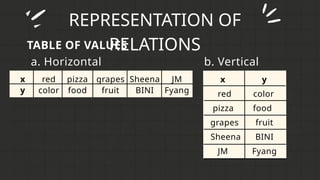
TABLE OFVALUES
x
y
red
color
pizza
food
grapes
fruit
Sheena
BINI
JM
Fyang
a. Horizontal b. Vertical
x y
red color
pizza food
grapes fruit
Sheena BINI
JM Fyang
16.
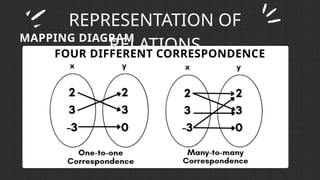
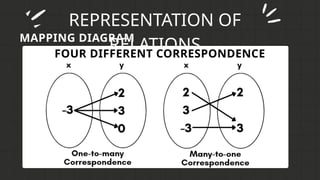
REPRESENTATION OF
RELATIONS
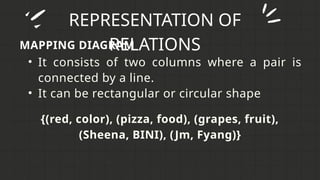
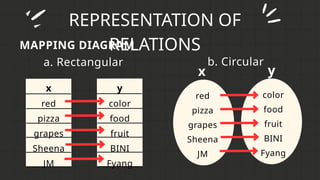
MAPPING DIAGRAM
•It consists of two columns where a pair is
connected by a line.
• It can be rectangular or circular shape
{(red, color), (pizza, food), (grapes, fruit),
(Sheena, BINI), (Jm, Fyang)}
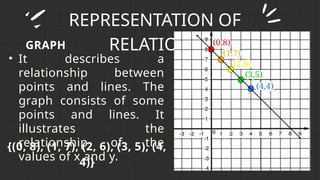
REPRESENTATION OF
RELATIONS
GRAPH
• Itdescribes a
relationship between
points and lines. The
graph consists of some
points and lines. It
illustrates the
relationship of the
values of x and y.
{(0, 8), (1, 7), (2, 6), (3, 5), (4,
4)}
21.
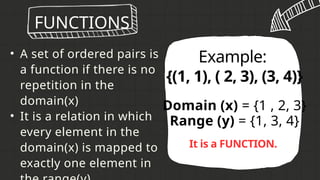
• A setof ordered pairs is
a function if there is no
repetition in the
domain(x)
• It is a relation in which
every element in the
domain(x) is mapped to
exactly one element in
FUNCTIONS
Example:
{(1, 1), ( 2, 3), (3, 4)}
Domain (x) = {1 , 2, 3}
Range (y) = {1, 3, 4}
It is a FUNCTION.
22.
REPRESENTATION OF
RELATIONS
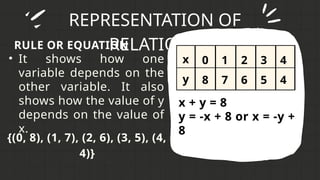
RULE OREQUATION
• It shows how one
variable depends on the
other variable. It also
shows how the value of y
depends on the value of
x.
{(0, 8), (1, 7), (2, 6), (3, 5), (4,
4)}
x + y = 8
y = -x + 8 or x = -y +
8
x
y
0
8
1
7
2
6
3
5
4
4
23.
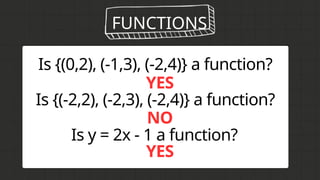
FUNCTIONS
Is {(0,2), (-1,3),(-2,4)} a function?
Is {(-2,2), (-2,3), (-2,4)} a function?
Is y = 2x - 1 a function?
YES
NO
YES
24.
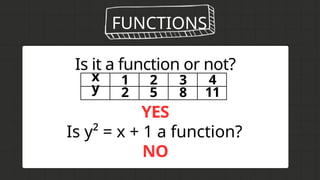
FUNCTIONS
Is it afunction or not?
Is y² = x + 1 a function?
YES
NO
x
y
1
2
2
5
3
8
4
11
25.
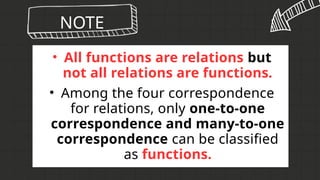
NOTE
• All functionsare relations but
not all relations are functions.
• Among the four correspondence
for relations, only one-to-one
correspondence and many-to-one
correspondence can be classified
as functions.
26.
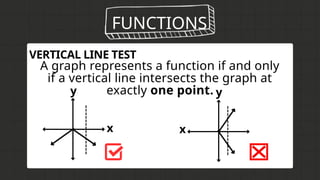
FUNCTIONS
VERTICAL LINE TEST
Agraph represents a function if and only
if a vertical line intersects the graph at
exactly one point.
x
y y
x
27.
I HAVE
WAYS!
Answer thefollowing in the Manila Paper and
choose three representative to present your
work.
Direction
:
28.
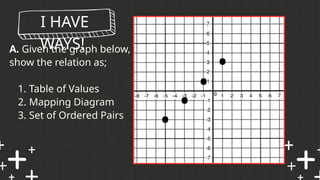
I HAVE
WAYS!
A. Giventhe graph below,
show the relation as;
1. Table of Values
2. Mapping Diagram
3. Set of Ordered Pairs
29.
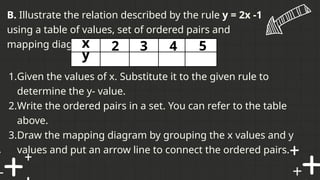
B. Illustrate therelation described by the rule y = 2x -1
using a table of values, set of ordered pairs and
mapping diagram.
x
y
2 3 4 5
1.Given the values of x. Substitute it to the given rule to
determine the y- value.
2.Write the ordered pairs in a set. You can refer to the table
above.
3.Draw the mapping diagram by grouping the x values and y
values and put an arrow line to connect the ordered pairs.
ASSIGNMEN
T
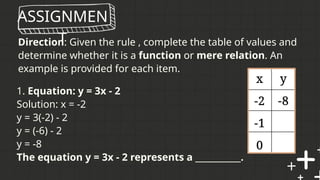
Direction: Given therule , complete the table of values and
determine whether it is a function or mere relation. An
example is provided for each item.
1. Equation: y = 3x - 2
Solution: x = -2
y = 3(-2) - 2
y = (-6) - 2
y = -8
The equation y = 3x - 2 represents a ___________.
33.
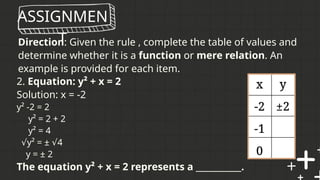
ASSIGNMEN
T
2. Equation: y²+ x = 2
Solution: x = -2
y² -2 = 2
y² = 2 + 2
y² = 4
√y² = ± 4
√
y = ± 2
The equation y² + x = 2 represents a ___________.
Direction: Given the rule , complete the table of values and
determine whether it is a function or mere relation. An
example is provided for each item.
34.
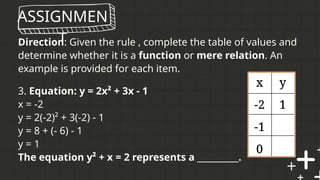
ASSIGNMEN
T
3. Equation: y= 2x² + 3x - 1
x = -2
y = 2(-2)² + 3(-2) - 1
y = 8 + (- 6) - 1
y = 1
The equation y² + x = 2 represents a __________.
Direction: Given the rule , complete the table of values and
determine whether it is a function or mere relation. An
example is provided for each item.